Grundlæggende statistik
| Institutionelle aktier (lange) | 83.833.374 - 45,43% (ex 13D/G) - change of -34,46MM shares -29,13% MRQ |
| Institutionel værdi (lang) | $ 1.274.312 USD ($1000) |
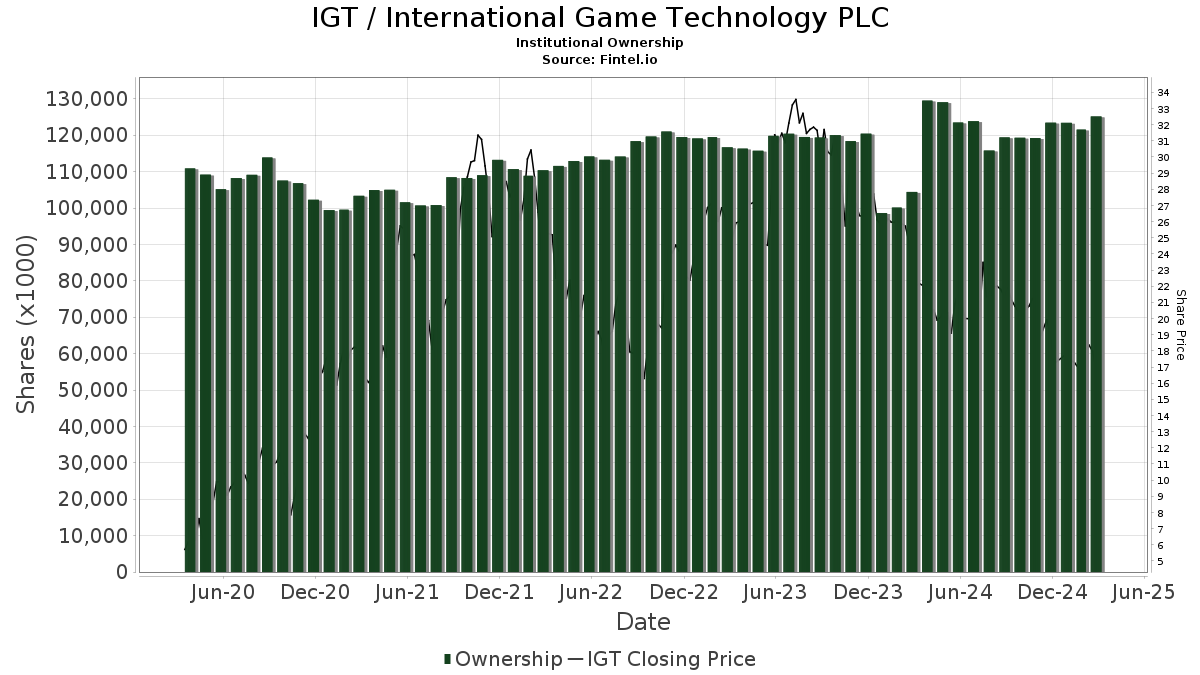
Institutionelt ejerskab og aktionærer
International Game Technology PLC (US:IGT) har 236 institutionelle ejere og aktionærer, der har indsendt 13D/G- eller 13F-formularer til Securities Exchange Commission (SEC). Disse institutioner har i alt 83,833,374 aktier. Største aktionærer omfatter Lazard Asset Management Llc, Massachusetts Financial Services Co /ma/, Samlyn Capital, Llc, Neuberger Berman Group LLC, BlackRock, Inc., PMACX - Victory Pioneer Multi-Asset Income Fund Class C, Brown Advisory Inc, Solel Partners LP, State Street Corp, and Goldman Sachs Group Inc .
International Game Technology PLC (NYSE:IGT) institutionel ejerskabsstruktur viser aktuelle positioner i virksomheden efter institutioner og fonde, samt seneste ændringer i positionsstørrelse. Større aktionærer kan omfatte individuelle investorer, investeringsforeninger, hedgefonde eller institutioner. Skema 13D angiver, at investoren besidder (eller besidder) mere end 5 % af virksomheden og har til hensigt (eller har til hensigt at) aktivt at forfølge en ændring i forretningsstrategi. Skema 13G indikerer en passiv investering på over 5%.
The share price as of July 1, 2025 is 16,29 / share. Previously, on March 27, 2025, the share price was 16,46 / share. This represents a decline of 1,03% over that period.
Fondens stemningsscore
Fund Sentiment Score (fka Ownership Accumulation Score) finder de aktier, der bliver mest købt af fonde. Det er resultatet af en sofistikeret, multi-faktor kvantitativ model, der identificerer virksomheder med de højeste niveauer af institutionel akkumulering. Scoringsmodellen bruger en kombination af den samlede stigning i oplyste ejere, ændringerne i porteføljeallokeringer i disse ejere og andre målinger. Tallet går fra 0 til 100, hvor højere tal indikerer et højere niveau af akkumulering for sine jævnaldrende, og 50 er gennemsnittet.
Opdateringsfrekvens: Dagligt
Se Ownership Explorer, som giver en liste over højest rangerende virksomheder.
AI+ Ask Fintel’s AI assistant about International Game Technology PLC.
Select a question to share a public post with an AI-crafted answer.
Thinking of good questions…
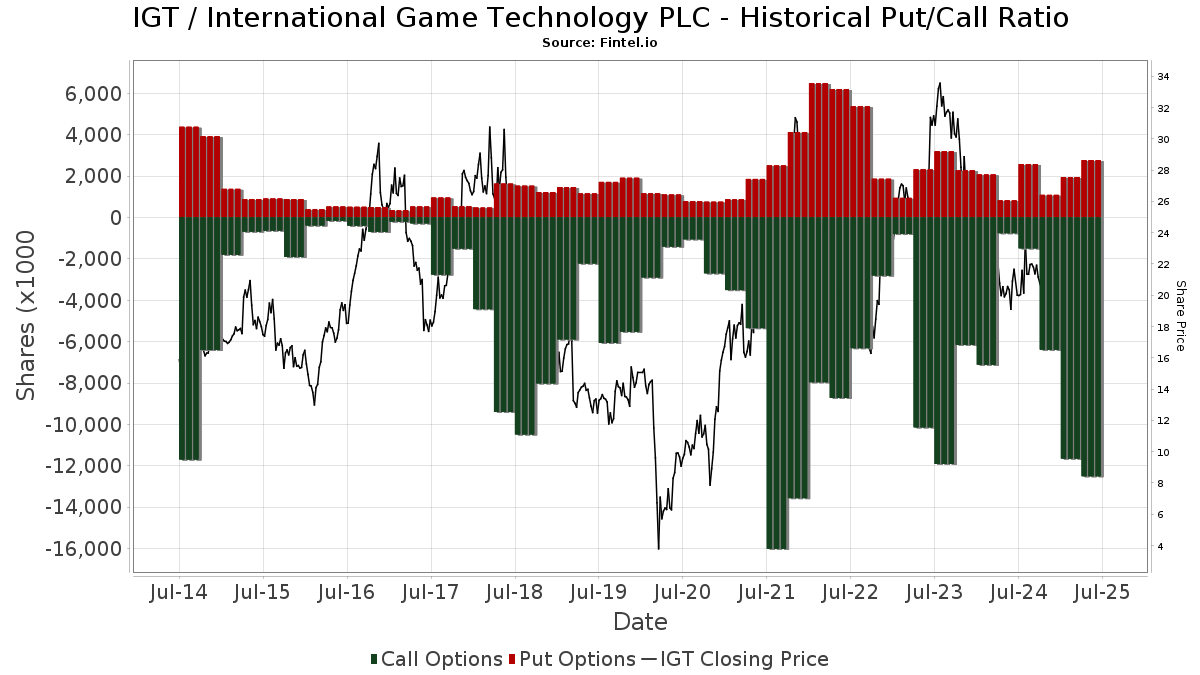
Institutionel Put/Call-forhold
Ud over at indberette standardaktie- og gældsudstedelser skal institutter med mere end 100 mill. aktiver under forvaltning også oplyse deres put- og call-optionsbeholdninger. Da salgsoptioner generelt indikerer negativ stemning, og købsoptioner indikerer positiv stemning, kan vi få en fornemmelse af den overordnede institutionelle stemning ved at plotte forholdet mellem put og kald. Diagrammet til højre viser det historiske put/call-forhold for dette instrument.
Brug af Put/Call Ratio som en indikator for investorernes stemning overvinder en af de vigtigste mangler ved at bruge totalt institutionelt ejerskab, som er, at en betydelig mængde af aktiver under forvaltning investeres passivt for at spore indekser. Passivt forvaltede fonde køber typisk ikke optioner, så indikatoren for put/call-forholdet følger mere nøje følelsen af aktivt forvaltede fonde.
13F og NPORT arkivering
Detaljer om 13F-arkivering er gratis. Detaljer om NP-ansøgninger kræver et premium-medlemskab. Grønne rækker angiver nye positioner. Røde rækker angiver lukkede positioner. Klik på linket ikon for at se den fulde transaktionshistorik.
Opgrader
for at låse premium-data op og eksportere til Excel ![]() .
.
| Fil dato | Kilde | Investor | Type | Gennemsnitlig pris (Øst) |
Aktier | Δ Aktier (%) |
Rapporteret Værdi ($1000) |
Δ Værdi (%) |
Port Alloc (%) |
|
|---|---|---|---|---|---|---|---|---|---|---|
| 2025-09-29 | NP | CFSSX - Column Small Cap Select Fund | 393.639 | 2,92 | 6.550 | 16,42 | ||||
| 2025-09-26 | NP | TISEX - TIAA-CREF Quant Small-Cap Equity Fund Institutional Class | 0 | -100,00 | 0 | -100,00 | ||||
| 2026-02-17 | 13F | Fmr Llc | 1.556.686 | -3,13 | 24.098 | -13,07 | ||||
| 2026-02-17 | 13F | Aquatic Capital Management LLC | 0 | -100,00 | 0 | |||||
| 2026-02-13 | 13F | Van Eck Associates Corp | 12.875 | -23,83 | 0 | |||||
| 2025-10-15 | 13F | Future Financial Wealth Managment LLC | 0 | -100,00 | 0 | |||||
| 2026-01-23 | 13F | State of Alaska, Department of Revenue | 10.904 | 4,42 | 0 | |||||
| 2026-02-12 | 13F | Brown Brothers Harriman & Co | 31 | -66,67 | 0 | -100,00 | ||||
| 2025-11-14 | 13F | Long Pond Capital, LP | Call | 0 | -100,00 | 0 | -100,00 | |||
| 2026-03-24 | 13F/A | Barclays Plc | Call | 0 | -100,00 | 0 | ||||
| 2026-01-23 | 13F | Farther Finance Advisors, LLC | 97 | 44,78 | 2 | 0,00 | ||||
| 2026-02-11 | 13F | Simplex Trading, Llc | Put | 9.600 | -58,08 | 149 | ||||
| 2026-02-17 | 13F | Engineers Gate Manager LP | 0 | -100,00 | 0 | |||||
| 2026-02-12 | 13F | Steward Partners Investment Advisory, Llc | 590 | 113,77 | 9 | 125,00 | ||||
| 2026-02-10 | 13F | Rothschild Investment Llc | 56 | -51,30 | 1 | -100,00 | ||||
| 2026-02-12 | 13F | State Board Of Administration Of Florida Retirement System | 31.009 | 0,00 | 480 | -10,11 | ||||
| 2026-02-10 | 13F | Intech Investment Management Llc | 45.557 | 12,01 | 705 | 0,57 | ||||
| 2026-02-11 | 13F | Simplex Trading, Llc | 6.663 | -28,95 | 103 | |||||
| 2026-02-11 | 13F | Simplex Trading, Llc | Call | 7.600 | -28,30 | 118 | ||||
| 2026-02-12 | 13F | DRW Securities, LLC | 0 | -100,00 | 0 | |||||
| 2026-02-12 | 13F | JPL Wealth Management, LLC | 0 | -100,00 | 0 | |||||
| 2025-09-29 | NP | RSSL - Global X Russell 2000 ETF | 57.285 | -17,16 | 850 | -25,04 | ||||
| 2026-01-07 | 13F | Massmutual Trust Co Fsb/adv | 175 | -33,21 | 3 | -50,00 | ||||
| 2026-02-06 | 13F | Motco | 30 | 0,00 | 0 | |||||
| 2026-02-13 | 13F | Kilter Group LLC | 74 | -16,85 | 1 | 0,00 | ||||
| 2026-02-17 | 13F | Hotchkis & Wiley Capital Management Llc | 780.554 | -3,17 | 12.083 | -13,11 | ||||
| 2026-02-17 | 13F | Boothbay Fund Management, Llc | 0 | -100,00 | 0 | |||||
| 2025-11-14 | 13F | Long Pond Capital, LP | 0 | -100,00 | 0 | -100,00 | ||||
| 2025-09-26 | NP | PMACX - Victory Pioneer Multi-Asset Income Fund Class C | 2.953.589 | 43.831 | ||||||
| 2026-01-23 | 13F | DHJJ Financial Advisors, Ltd. | 10 | 0,00 | 0 | |||||
| 2026-02-10 | 13F | Thompson Siegel & Walmsley Llc | 275.820 | -1,85 | 4 | 0,00 | ||||
| 2026-02-13 | 13F | Entropy Technologies, LP | 26.332 | 408 | ||||||
| 2026-02-17 | 13F | Shay Capital LLC | 343.600 | 3.336,00 | 5.319 | 2.991,86 | ||||
| 2026-02-17 | 13F | Rangeley Capital, LLC | 0 | -100,00 | 0 | |||||
| 2026-02-09 | 13F | Kingsview Wealth Management, LLC | 166.250 | 2.574 | ||||||
| 2025-11-05 | 13F | Key FInancial Inc | 0 | -100,00 | 0 | |||||
| 2026-02-12 | 13F | Renaissance Technologies Llc | 454.900 | 7.042 | ||||||
| 2026-02-13 | 13F | Golden State Wealth Management, LLC | 300 | 0,00 | 5 | -20,00 | ||||
| 2026-02-17 | 13F | Capital Fund Management S.a. | Call | 0 | -100,00 | 0 | -100,00 | |||
| 2025-11-04 | 13F | Legend Financial Advisors, Inc. | 0 | -100,00 | 0 | |||||
| 2025-11-14 | 13F | Samlyn Capital, Llc | Call | 0 | -100,00 | 0 | -100,00 | |||
| 2025-09-26 | NP | ESCQX - Embark Small Cap Equity Fund Retirement Class | 0 | -100,00 | 0 | -100,00 | ||||
| 2026-02-13 | 13F | Capula Management Ltd | 10.257 | -13,11 | 159 | -22,17 | ||||
| 2026-02-12 | 13F | Voya Investment Management Llc | 19.077 | -56,63 | 295 | -61,08 | ||||
| 2026-02-12 | 13F | Knott David M Jr | 2.500 | 0,00 | 39 | -11,63 | ||||
| 2026-02-13 | 13F | Walleye Capital LLC | Put | 0 | -100,00 | 0 | ||||
| 2026-02-10 | 13F/A | Northwestern Mutual Wealth Management Co | 1.194 | -0,83 | 18 | -10,00 | ||||
| 2026-02-11 | 13F | Fox Run Management, L.l.c. | 72.804 | 112,50 | 1.127 | 90,69 | ||||
| 2026-02-13 | 13F | Squarepoint Ops LLC | Put | 0 | -100,00 | 0 | ||||
| 2026-02-17 | 13F | D. E. Shaw & Co., Inc. | 31.818 | -34,72 | 493 | -41,43 | ||||
| 2026-01-30 | 13F | North Star Investment Management Corp. | 272 | 0,00 | 4 | 0,00 | ||||
| 2026-02-09 | 13F | Royce & Associates Lp | 1.607.713 | 2,92 | 24.887 | -7,64 | ||||
| 2026-02-11 | 13F | Group One Trading, L.p. | Put | 24.100 | -15,44 | 373 | -24,03 | |||
| 2026-02-17 | 13F | Lazard Asset Management Llc | 9.504.747 | -28,43 | 147.133 | -35,77 | ||||
| 2026-02-17 | 13F | California State Teachers Retirement System | 6.462 | -7,53 | 100 | -16,67 | ||||
| 2026-02-06 | 13F | IFP Advisors, Inc | 37 | 2,78 | 1 | -100,00 | ||||
| 2025-11-14 | 13F | Westchester Capital Management, LLC | 0 | -100,00 | 0 | -100,00 | ||||
| 2026-01-27 | 13F | Bayforest Capital Ltd | 9.843 | 152 | ||||||
| 2026-02-11 | 13F | Group One Trading, L.p. | 17.437 | 62,87 | 270 | 46,20 | ||||
| 2026-02-11 | 13F | Group One Trading, L.p. | Call | 38.900 | -2,51 | 602 | -12,50 | |||
| 2025-11-14 | 13F | Westchester Capital Management, LLC | Put | 0 | -100,00 | 0 | -100,00 | |||
| 2025-11-13 | 13F | Glenmede Investment Management, LP | 32.781 | -3,41 | 565 | 5,41 | ||||
| 2025-11-14 | 13F | Maverick Capital Ltd | 0 | -100,00 | 0 | |||||
| 2026-02-13 | 13F | Wells Fargo & Company/mn | 191.225 | 20,33 | 2.960 | 7,99 | ||||
| 2025-09-26 | NP | EBIT - Harbor AlphaEdge Small Cap Earners ETF | 3.195 | 23,74 | 47 | 11,90 | ||||
| 2026-02-13 | 13F | Mariner, LLC | 14.796 | -34,65 | 229 | -41,28 | ||||
| 2026-03-06 | 13F | Hsbc Holdings Plc | 84.960 | 11,23 | 1.318 | 1,07 | ||||
| 2026-03-04 | 13F | AG Campbell Advisory, LLC | 18 | 0 | ||||||
| 2026-01-15 | 13F | Nisa Investment Advisors, Llc | 3.477 | -26,04 | 54 | -34,57 | ||||
| 2026-02-05 | 13F | Allworth Financial LP | 524 | -2,42 | 8 | -11,11 | ||||
| 2026-02-13 | 13F | Brown Advisory Inc | 2.895.356 | 5,10 | 44.820 | -5,68 | ||||
| 2026-02-13 | 13F | Integrated Wealth Concepts LLC | 14.048 | 35,82 | 217 | 21,91 | ||||
| 2026-01-20 | 13F | Harbor Capital Advisors, Inc. | 2.847 | -1,69 | 0 | |||||
| 2026-02-03 | 13F | Garner Asset Management Corp | 41 | 1 | ||||||
| 2026-01-09 | 13F | SG Americas Securities, LLC | 49.034 | 94,35 | 1 | |||||
| 2026-02-11 | 13F | J.Safra Asset Management Corp | 0 | -100,00 | 0 | |||||
| 2026-02-13 | 13F | Great West Life Assurance Co /can/ | 542 | -84,19 | 0 | |||||
| 2026-02-13 | 13F | Morgan Stanley | 1.042.034 | 23,73 | 16.131 | 11,03 | ||||
| 2026-02-13 | 13F | Squarepoint Ops LLC | 0 | -100,00 | 0 | |||||
| 2026-02-18 | 13F | Mackenzie Financial Corp | 0 | -100,00 | 0 | |||||
| 2026-02-06 | 13F | Gsa Capital Partners Llp | 62.314 | -23,82 | 1 | -100,00 | ||||
| 2026-02-06 | 13F | ProShare Advisors LLC | 19.178 | 0,21 | 297 | -10,30 | ||||
| 2026-02-13 | 13F | Walleye Capital LLC | Call | 0 | -100,00 | 0 | ||||
| 2026-01-26 | 13F | Private Trust Co Na | 507 | -0,78 | 8 | -12,50 | ||||
| 2026-02-17 | 13F | Quantinno Capital Management LP | 20.615 | 21,26 | 319 | 8,87 | ||||
| 2026-01-23 | 13F | Assetmark, Inc | 171 | 3 | ||||||
| 2025-09-26 | NP | BKSE - BNY Mellon US Small Cap Core Equity ETF | 3.441 | -33,21 | 51 | -39,29 | ||||
| 2025-11-21 | 13F | Nebula Research & Development LLC | 0 | -100,00 | 0 | |||||
| 2026-02-17 | 13F | Advisor Group Holdings, Inc. | 12.452 | -16,63 | 193 | -24,11 | ||||
| 2026-02-13 | 13F | Rhumbline Advisers | 139.064 | -17,63 | 2.153 | -26,10 | ||||
| 2026-02-17 | 13F | Equitable Holdings, Inc. | 39.628 | 1,38 | 613 | -9,05 | ||||
| 2026-02-11 | 13F | Jpmorgan Chase & Co | 244.866 | -69,61 | 3.791 | -72,73 | ||||
| 2026-02-17 | 13F | Alden Global Capital LLC | 0 | -100,00 | 0 | |||||
| 2026-02-11 | 13F | Ameritas Investment Partners, Inc. | 8.522 | 132 | ||||||
| 2026-02-17 | 13F | Solel Partners LP | 2.795.324 | -18,27 | 43.272 | -26,66 | ||||
| 2026-01-16 | 13F | Ronald Blue Trust, Inc. | 0 | -100,00 | 0 | |||||
| 2026-02-10 | 13F | Bnp Paribas Arbitrage, Sa | 30.280 | -87,82 | 469 | -89,09 | ||||
| 2026-02-17 | 13F | Balyasny Asset Management Llc | 224.691 | 3.478 | ||||||
| 2026-02-05 | 13F | Gamco Investors, Inc. Et Al | 274.875 | 3,26 | 4.255 | -7,32 | ||||
| 2026-02-17 | 13F | ExodusPoint Capital Management, LP | 0 | -100,00 | 0 | -100,00 | ||||
| 2026-01-26 | 13F | Cwm, Llc | 4.942 | 145,14 | 0 | |||||
| 2026-01-29 | 13F | UBS Group AG | Put | 131.400 | -3,67 | 2.034 | -13,52 | |||
| 2026-02-13 | 13F | SRS Capital Advisors, Inc. | 6.707 | -14,16 | 104 | -23,13 | ||||
| 2026-02-17 | 13F | Occudo Quantitative Strategies Lp | 75.512 | 248,40 | 1.169 | 213,14 | ||||
| 2026-01-29 | 13F | UBS Group AG | Call | 67.100 | -12,97 | 1.039 | -21,90 | |||
| 2025-10-31 | 13F | Whittier Trust Co Of Nevada Inc | 0 | -100,00 | 0 | |||||
| 2025-09-26 | NP | PRF - Invesco FTSE RAFI US 1000 ETF This fund is a listed as child fund of Invesco Ltd. and if that institution has disclosed ownership in this security, then these positions will not be double counted when calculating total shares and total value | 42.554 | 3,21 | 632 | -6,66 | ||||
| 2026-01-29 | 13F | UBS Group AG | 850.421 | 233,84 | 13.165 | 199,59 | ||||
| 2026-02-17 | 13F | Dv Equities, Llc | 931 | 14 | ||||||
| 2026-02-05 | 13F | Bessemer Group Inc | 840 | -35,38 | 0 | |||||
| 2026-02-12 | 13F | New York State Common Retirement Fund | 35.016 | 0,00 | 542 | -10,26 | ||||
| 2026-02-10 | 13F | Bank of New York Mellon Corp | 360.994 | -20,47 | 5.588 | -28,62 | ||||
| 2026-02-12 | 13F | Nuveen, LLC | 259.516 | -68,01 | 4.017 | -71,29 | ||||
| 2026-02-17 | 13F | Qube Research & Technologies Ltd | 362.278 | 5.608 | ||||||
| 2026-02-13 | 13F | Parkside Financial Bank & Trust | 96 | 0,00 | 1 | 0,00 | ||||
| 2025-12-09 | 13F/A | Tudor Investment Corp Et Al | Put | 0 | -100,00 | 0 | -100,00 | |||
| 2026-01-26 | 13F | Mirae Asset Global Investments Co., Ltd. | 204.878 | -30,25 | 3.172 | -37,41 | ||||
| 2026-02-13 | 13F | Victory Capital Management Inc | 328.240 | -0,11 | 5.081 | -10,36 | ||||
| 2026-02-13 | 13F | Neuberger Berman Group LLC | 6.424.991 | -4,91 | 99.463 | -14,68 | ||||
| 2026-02-03 | 13F | Mma Asset Management Llc | 0 | -100,00 | 0 | |||||
| 2026-02-11 | 13F | LPL Financial LLC | 34.283 | -4,17 | 531 | -14,10 | ||||
| 2026-02-17 | 13F | SummitTX Capital, L.P. | 0 | -100,00 | 0 | |||||
| 2025-11-21 | 13F/A | CIBC Bancorp USA Inc. | 11.930 | 206 | ||||||
| 2026-02-12 | 13F | Wealthspire Advisors, LLC | 0 | -100,00 | 0 | |||||
| 2026-01-20 | 13F | Signaturefd, Llc | 505 | -9,66 | 8 | -22,22 | ||||
| 2025-10-17 | 13F | Deprince Race & Zollo Inc | 0 | -100,00 | 0 | -100,00 | ||||
| 2026-02-13 | 13F | Stanley Capital Management, LLC | 857.000 | -9,98 | 13.266 | -19,22 | ||||
| 2025-09-26 | NP | SLPIX - Small-cap Profund Investor Class | 101 | -9,01 | 1 | 0,00 | ||||
| 2025-09-26 | NP | FSSNX - Fidelity Small Cap Index Fund This fund is a listed as child fund of Fmr Llc and if that institution has disclosed ownership in this security, then these positions will not be double counted when calculating total shares and total value | 1.130.602 | -2,21 | 16.778 | -11,51 | ||||
| 2026-02-17 | 13F | MIRAE ASSET GLOBAL ETFS HOLDINGS Ltd. | 64.431 | -5,04 | 997 | -14,79 | ||||
| 2026-02-13 | 13F | Prudential Financial Inc | 21.475 | 49,09 | 332 | 33,87 | ||||
| 2025-11-14 | 13F | Bridgefront Capital, LLC | 0 | -100,00 | 0 | -100,00 | ||||
| 2026-02-17 | 13F | Tudor Investment Corp Et Al | 40.266 | -31,12 | 623 | -38,19 | ||||
| 2025-12-16 | 13F | Garde Capital, Inc. | 0 | -100,00 | 0 | |||||
| 2026-02-12 | 13F | Cibc World Markets Corp | 0 | -100,00 | 0 | |||||
| 2026-02-17 | 13F | Jump Financial, LLC | 196.542 | 3.042 | ||||||
| 2025-09-26 | NP | SUNAMERICA SERIES TRUST - SA Goldman Sachs Multi-Asset Insights Portfolio Class 1 | 11.838 | 181,86 | 176 | 157,35 | ||||
| 2026-02-17 | 13F | Jones Financial Companies Lllp | 2.639 | 63,00 | 41 | 48,15 | ||||
| 2026-02-09 | 13F | Geode Capital Management, Llc | 1.271.590 | -7,09 | 19.684 | -16,63 | ||||
| 2026-02-12 | 13F | BlackRock, Inc. | 5.818.117 | -3,47 | 90.064 | -13,38 | ||||
| 2026-02-13 | 13F | Transamerica Financial Advisors, Inc. | 4 | 0 | ||||||
| 2026-02-13 | 13F | Caitong International Asset Management Co., Ltd | 271 | -20,53 | 4 | -20,00 | ||||
| 2026-02-17 | 13F | Gotham Asset Management, LLC | 35.772 | 554 | ||||||
| 2026-02-17 | 13F | Ameriprise Financial Inc | 357.656 | 116,83 | 5.533 | 94,51 | ||||
| 2026-02-09 | 13F | Morningstar Investment Management LLC | 0 | -100,00 | 0 | |||||
| 2026-02-11 | 13F | CenterBook Partners LP | 10.534 | 163 | ||||||
| 2025-09-26 | NP | TIEIX - TIAA-CREF Equity Index Fund Institutional Class | 114.945 | 0,00 | 1.706 | -9,55 | ||||
| 2026-02-11 | 13F | Inceptionr Llc | 0 | -100,00 | 0 | |||||
| 2026-02-17 | 13F | Voloridge Investment Management, Llc | 147.180 | 2.278 | ||||||
| 2025-09-26 | NP | FLXSX - Fidelity Flex Small Cap Index Fund This fund is a listed as child fund of Fmr Llc and if that institution has disclosed ownership in this security, then these positions will not be double counted when calculating total shares and total value | 0 | -100,00 | 0 | -100,00 | ||||
| 2026-02-13 | 13F | Verition Fund Management LLC | 36.690 | -70,07 | 568 | -73,18 | ||||
| 2026-02-13 | 13F | Centiva Capital, LP | 14.277 | 221 | ||||||
| 2026-01-20 | 13F | Perpetual Ltd | 0 | -100,00 | 0 | |||||
| 2026-02-03 | 13F | Navigoe, LLC | 54 | 0,00 | 0 | |||||
| 2026-02-13 | 13F | Sterling Capital Management LLC | 6.051 | -21,91 | 94 | -30,08 | ||||
| 2026-02-13 | 13F | Centiva Capital, LP | Call | 217.400 | -32,96 | 3.365 | -39,85 | |||
| 2026-02-13 | 13F | Walleye Trading LLC | 10.466 | 162 | ||||||
| 2026-02-13 | 13F | Manufacturers Life Insurance Company, The | 32.399 | -14,85 | 502 | -23,63 | ||||
| 2026-02-13 | 13F | Walleye Trading LLC | Put | 41.600 | -38,19 | 644 | -44,57 | |||
| 2025-09-26 | NP | RTSSX - Tax-Managed U.S. Mid & Small Cap Fund Class S | 138.404 | 46,03 | 2.054 | 32,11 | ||||
| 2026-02-13 | 13F | Walleye Trading LLC | Call | 11.200 | -84,29 | 173 | -85,92 | |||
| 2026-02-17 | 13F | LMR Partners LLP | 100.000 | 0,00 | 1.548 | -10,26 | ||||
| 2025-09-29 | NP | SUNAMERICA SERIES TRUST - SA Small Cap Index Portfolio Class 1 | 12.870 | -0,46 | 191 | -10,38 | ||||
| 2026-02-06 | 13F | EverSource Wealth Advisors, LLC | 850 | 21,78 | 13 | 8,33 | ||||
| 2026-02-13 | 13F | Neo Ivy Capital Management | 7.561 | -91,17 | 117 | -92,08 | ||||
| 2026-01-16 | 13F | FNY Investment Advisers, LLC | 5.000 | 0,00 | 0 | |||||
| 2026-02-13 | 13F | Fieldview Capital Management, LLC | 57.090 | 884 | ||||||
| 2026-01-30 | 13F | Strategic Blueprint, LLC | 11.500 | 0,00 | 178 | -10,10 | ||||
| 2026-02-13 | 13F | Stifel Financial Corp | 140.575 | -16,58 | 2.176 | -25,15 | ||||
| 2026-02-06 | 13F | Mizuho Markets Cayman LP | 168.300 | 18,69 | 2.605 | 6,50 | ||||
| 2026-02-17 | 13F | Kemnay Advisory Services Inc. | 5.767 | 89 | ||||||
| 2026-02-17 | 13F | Tcw Group Inc | 351.500 | 5.441 | ||||||
| 2026-02-17 | 13F | Royal Bank Of Canada | 59.637 | -11,67 | 923 | -20,84 | ||||
| 2025-09-26 | NP | TISBX - TIAA-CREF Small-Cap Blend Index Fund Institutional Class | 148.737 | 3,71 | 2.207 | -6,16 | ||||
| 2026-02-17 | 13F | Trexquant Investment LP | 438.678 | 389,17 | 6.791 | 339,20 | ||||
| 2026-02-17 | 13F | Aqr Capital Management Llc | 19.556 | 23,21 | 303 | 10,62 | ||||
| 2025-11-14 | 13F | Wolverine Trading, Llc | 18.327 | 318 | ||||||
| 2025-11-14 | 13F | Wolverine Trading, Llc | Call | 126.700 | 2.196 | |||||
| 2025-11-14 | 13F | Wolverine Trading, Llc | Put | 131.100 | 2.272 | |||||
| 2026-02-13 | 13F | Sei Investments Co | 159.679 | -7,12 | 2.472 | -16,66 | ||||
| 2026-02-24 | 13F | Bell Investment Advisors, Inc | 55 | 0,00 | 1 | |||||
| 2025-09-29 | NP | CFSLX - Column Small Cap Fund | 67.402 | 1,07 | 1.122 | 14,39 | ||||
| 2026-02-05 | 13F | Plante Moran Financial Advisors, LLC | 14 | 0,00 | 0 | |||||
| 2026-02-09 | 13F | Harbour Investments, Inc. | 202 | 0,00 | 3 | 0,00 | ||||
| 2025-11-13 | 13F | Parallel Advisors, LLC | 0 | -100,00 | 0 | |||||
| 2026-02-12 | 13F | Quadrant Capital Group Llc | 3.891 | 13,94 | 60 | 3,45 | ||||
| 2025-11-14 | 13F | Skopos Labs, Inc. | 0 | -100,00 | 0 | |||||
| 2026-02-10 | 13F | Nomura Asset Management Co Ltd | 2.000 | 0,00 | 31 | -11,76 | ||||
| 2026-02-13 | 13F | Barclays Plc | 216.661 | -5,32 | 3.354 | -15,05 | ||||
| 2026-01-30 | 13F | Us Bancorp \de\ | 600 | -5,51 | 9 | -10,00 | ||||
| 2026-02-06 | 13F | Pnc Financial Services Group, Inc. | 6.014 | 22,63 | 93 | 10,71 | ||||
| 2026-02-17 | 13F | Capital Fund Management S.a. | Put | 42.600 | -21,40 | 659 | -29,44 | |||
| 2026-02-12 | 13F | Campbell & CO Investment Adviser LLC | 12.840 | 199 | ||||||
| 2025-11-07 | 13F | Fifth Third Bancorp | 0 | -100,00 | 0 | |||||
| 2025-11-13 | 13F | Vise Technologies, Inc. | 0 | -100,00 | 0 | |||||
| 2026-01-22 | 13F | Massachusetts Financial Services Co /ma/ | 8.382.186 | -6,22 | 129.756 | -15,84 | ||||
| 2026-02-11 | 13F | GW&K Investment Management, LLC | 330 | 0 | ||||||
| 2026-01-28 | 13F | WPG Advisers, LLC | 35 | 0,00 | 1 | |||||
| 2026-02-06 | 13F | Global Retirement Partners, LLC | 6.825 | 106 | ||||||
| 2026-02-17 | 13F | Public Employees Retirement System Of Ohio | 4.756 | 3,71 | 74 | -7,59 | ||||
| 2026-02-13 | 13F | State Street Corp | 1.928.942 | -4,28 | 29.860 | -14,10 | ||||
| 2026-02-17 | 13F | XTX Topco Ltd | 180.789 | 2.799 | ||||||
| 2026-02-17 | 13F | Northern Trust Corp | 703.045 | -15,96 | 10.883 | -24,58 | ||||
| 2026-02-11 | 13F | Deutsche Bank Ag\ | 686.677 | 34,30 | 10.630 | 20,52 | ||||
| 2026-02-18 | 13F | GWM Advisors LLC | 2.059 | 0,15 | 32 | -11,43 | ||||
| 2025-10-27 | 13F | First Horizon Corp | 0 | -100,00 | 0 | |||||
| 2026-01-30 | 13F | Pekin Hardy Strauss, Inc. | 12.000 | 0,00 | 186 | -10,63 | ||||
| 2026-02-13 | 13F | Ubs Asset Management Americas Inc | 495 | 8 | ||||||
| 2026-02-17 | 13F | Ancora Advisors, LLC | 0 | -100,00 | 0 | |||||
| 2026-02-13 | 13F | Smartleaf Asset Management LLC | 453 | 139,68 | 7 | 133,33 | ||||
| 2026-01-05 | 13F | GAMMA Investing LLC | 388 | 82,16 | 6 | 100,00 | ||||
| 2026-02-05 | 13F | Gabelli Funds Llc | 477.266 | 5,18 | 7.388 | -5,61 | ||||
| 2026-02-10 | 13F | Goldman Sachs Group Inc | Put | 366.600 | 0,00 | 5.675 | -10,26 | |||
| 2026-02-10 | 13F | Cherry Tree Wealth Management, LLC | 20 | 0,00 | 0 | |||||
| 2026-02-10 | 13F | Goldman Sachs Group Inc | 1.825.363 | -48,36 | 28.257 | -53,66 | ||||
| 2026-02-10 | 13F | Goldman Sachs Group Inc | Call | 116.600 | 0,00 | 1.805 | -10,29 | |||
| 2026-02-17 | 13F | Susquehanna International Group, Llp | Call | 394.900 | -12,79 | 6.113 | -21,73 | |||
| 2026-02-17 | 13F | Susquehanna International Group, Llp | 20.562 | 318 | ||||||
| 2026-02-13 | 13F | Arrowstreet Capital, Limited Partnership | 618.279 | -43,98 | 9.571 | -49,73 | ||||
| 2026-02-17 | 13F | Susquehanna International Group, Llp | Put | 138.700 | -1,84 | 2.147 | -11,90 | |||
| 2026-01-30 | 13F | American Capital Advisory, LLC | 2.731 | 6,85 | 42 | -4,55 | ||||
| 2025-11-14 | 13F | 1060 Capital, LLC | 0 | -100,00 | 0 | -100,00 | ||||
| 2026-02-17 | 13F | Millennium Management Llc | 851.812 | -70,85 | 13.186 | -73,84 | ||||
| 2026-01-27 | 13F | Cannon Global Investment Management, LLC | 0 | -100,00 | 0 | |||||
| 2025-09-26 | NP | SMLF - iShares Edge MSCI Multifactor USA Small-Cap ETF | 137.623 | 9,00 | 2.042 | -1,35 | ||||
| 2026-01-15 | 13F | Allspring Global Investments Holdings, LLC | 0 | -100,00 | 0 | |||||
| 2026-01-20 | 13F | Savvy Advisors, Inc. | 10.761 | 0,54 | 167 | -9,78 | ||||
| 2025-11-14 | 13F | Nomura Holdings Inc | 0 | -100,00 | 0 | -100,00 | ||||
| 2026-02-09 | 13F | Hartland & Co., LLC | 0 | -100,00 | 0 | |||||
| 2026-02-12 | 13F | MetLife Investment Management, LLC | 59.537 | -10,88 | 922 | -20,05 | ||||
| 2026-02-17 | 13F | Russell Investments Group, Ltd. | 333.895 | -12,36 | 5.169 | -21,35 | ||||
| 2026-02-17 | 13F | Samlyn Capital, Llc | 7.183.757 | 28,75 | 111.205 | 15,54 | ||||
| 2026-02-13 | 13F | Segall Bryant & Hamill, Llc | 189.557 | 2.934 | ||||||
| 2026-02-17 | 13F | Wellington Management Group Llp | 1.165.840 | -39,12 | 18.047 | -45,37 | ||||
| 2026-02-13 | 13F | Pinnacle Wealth Planning Services, Inc. | 94 | 1 | ||||||
| 2026-02-12 | 13F | Orvieto Partners, L.P. | 738.596 | 15,66 | 11.433 | 3,79 | ||||
| 2026-02-03 | 13F | SBI Securities Co., Ltd. | 4.612 | 73,38 | 71 | 57,78 | ||||
| 2025-09-26 | NP | REBYX - U.S. Small Cap Equity Fund Class Y | 37.762 | -31,56 | 560 | -38,05 | ||||
| 2026-02-17 | 13F | Man Group plc | 0 | -100,00 | 0 | -100,00 | ||||
| 2026-02-17 | 13F | Optiver Holding B.V. | 616 | -38,28 | 10 | -47,06 | ||||
| 2026-02-17 | 13F | Two Sigma Advisers, Lp | 0 | -100,00 | 0 | |||||
| 2026-02-04 | 13F | LRI Investments, LLC | 500 | 8 | ||||||
| 2026-02-12 | 13F | Orvieto Partners, L.P. | Call | 0 | -100,00 | 0 | -100,00 | |||
| 2026-02-17 | 13F | Holocene Advisors, LP | 17.432 | -77,51 | 270 | -79,87 | ||||
| 2026-01-06 | 13F | Investors Research Corp | 544 | 0,00 | 8 | -11,11 | ||||
| 2026-02-09 | 13F | Legal & General Group Plc | 20.242 | -23,95 | 313 | -31,81 | ||||
| 2026-02-17 | 13F | Mork Capital Management, LLC | 0 | -100,00 | 0 | |||||
| 2026-02-17 | 13F | Point72 Asset Management, L.P. | 35.520 | 550 | ||||||
| 2026-02-17 | 13F | Raymond James Financial Inc | 42.566 | -29,86 | 659 | -37,09 | ||||
| 2026-02-17 | 13F | Aristeia Capital Llc | 45.525 | 705 | ||||||
| 2026-02-03 | 13F | Carlson Capital L P | 38.700 | 599 | ||||||
| 2026-01-29 | 13F | IMC-Chicago, LLC | Put | 126.900 | -14,78 | 1.964 | -23,52 | |||
| 2026-01-29 | 13F | IMC-Chicago, LLC | Call | 139.800 | 3,71 | 2.164 | -6,92 | |||
| 2026-01-16 | 13F | Linden Thomas Advisory Services, LLC | 22.117 | -5,22 | 342 | -14,93 | ||||
| 2026-01-28 | 13F | Peregrine Capital Management Llc | 0 | -100,00 | 0 | |||||
| 2026-02-12 | 13F | Hrt Financial Lp | 843.262 | 389,20 | 13 | 550,00 | ||||
| 2026-02-11 | 13F | Cerity Partners LLC | 33.692 | 1,25 | 522 | -9,08 | ||||
| 2026-02-13 | 13F | National Bank Of Canada /fi/ | 1 | -99,76 | 0 | -100,00 | ||||
| 2026-02-17 | 13F | Citadel Advisors Llc | 975.992 | -46,84 | 15.108 | -52,29 | ||||
| 2026-02-17 | 13F | Graham Capital Management, L.P. | 107.625 | 1.666 | ||||||
| 2026-02-11 | 13F | Franklin Resources Inc | 277.871 | 1,18 | 4.301 | -9,20 | ||||
| 2026-02-06 | 13F | HighTower Advisors, LLC | 293.333 | -5,85 | 4.541 | -15,52 | ||||
| 2026-02-17 | 13F | Citadel Advisors Llc | Put | 1.172.900 | -3,51 | 18.156 | -13,42 | |||
| 2026-02-17 | 13F | Citadel Advisors Llc | Call | 1.220.100 | 1,24 | 18.887 | -9,14 | |||
| 2025-11-14 | 13F | Boothbay Fund Management, Llc | Call | 0 | -100,00 | 0 | -100,00 | |||
| 2026-02-13 | 13F | Marshall Wace, Llp | Call | 0 | -100,00 | 0 | ||||
| 2025-11-14 | 13F | TIG Advisors, LLC | 0 | -100,00 | 0 | |||||
| 2026-02-17 | 13F | Tower Research Capital LLC (TRC) | 5.358 | 91,84 | 83 | 70,83 | ||||
| 2026-02-17 | 13F | Glenmede Trust Co Na | 30.850 | -8,58 | 478 | -12,96 | ||||
| 2026-02-17 | 13F | GCM Grosvenor Holdings, LLC | 0 | -100,00 | 0 | |||||
| 2025-11-14 | 13F | Quarry LP | 0 | -100,00 | 0 | |||||
| 2026-02-17 | 13F | London Co Of Virginia | 0 | -100,00 | 0 | |||||
| 2026-02-12 | 13F | Jane Street Group, Llc | Call | 179.000 | -92,09 | 2.771 | -92,91 | |||
| 2026-02-12 | 13F | Jane Street Group, Llc | 577.743 | 8.943 | ||||||
| 2026-02-12 | 13F | Jane Street Group, Llc | Put | 108.300 | -31,37 | 1.676 | -38,43 | |||
| 2026-02-10 | 13F | Norges Bank | 1.263.918 | 19.565 | ||||||
| 2026-01-07 | 13F | Aventura Private Wealth, LLC | 82 | 0,00 | 1 | 0,00 | ||||
| 2026-02-13 | 13F | Marshall Wace, Llp | Put | 300 | 5 | |||||
| 2026-02-13 | 13F | Marshall Wace, Llp | 50.648 | 784 | ||||||
| 2026-02-17 | 13F | Bramshill Investments, LLC | 0 | -100,00 | 0 | |||||
| 2026-02-10 | 13F | Envestnet Asset Management Inc | 10.715 | -22,87 | 166 | -30,96 | ||||
| 2026-01-08 | 13F | Versant Capital Management, Inc | 45 | 0,00 | 1 | |||||
| 2026-02-17 | 13F | Prelude Capital Management, Llc | 72.718 | -19,58 | 1.126 | -27,84 | ||||
| 2026-02-05 | 13F | GABELLI & Co INVESTMENT ADVISERS, INC. | 129.954 | -10,59 | 2.012 | -19,78 | ||||
| 2026-02-14 | 13F | Rockefeller Capital Management L.P. | 3.362 | 1.020,67 | 52 | 940,00 | ||||
| 2026-02-13 | 13F | Macquarie Group Ltd | 0 | -100,00 | 0 | -100,00 | ||||
| 2026-02-13 | 13F | Squarepoint Ops LLC | Call | 0 | -100,00 | 0 | ||||
| 2026-02-10 | 13F | State of Wyoming | 0 | -100,00 | 0 | |||||
| 2025-09-26 | NP | PMYRX - Victory Pioneer Equity Premium Income Fund Class Y | 54.886 | 815 | ||||||
| 2026-02-13 | 13F | American Century Companies Inc | 105.812 | 602,65 | 1.638 | 532,05 | ||||
| 2026-02-12 | 13F | Federation des caisses Desjardins du Quebec | 1.100 | 17 | ||||||
| 2026-02-17 | 13F | Capital Fund Management S.a. | 75.620 | -53,98 | 1.171 | -58,72 | ||||
| 2026-01-21 | 13F | Kentucky Trust Co | 100 | 0,00 | 2 | 0,00 | ||||
| 2026-02-17 | 13F | Two Sigma Investments, Lp | 0 | -100,00 | 0 | -100,00 | ||||
| 2025-11-13 | 13F | Capital Research Global Investors | 0 | -100,00 | 0 | -100,00 | ||||
| 2026-02-11 | 13F | Empowered Funds, LLC | 3.656 | 57 | ||||||
| 2026-02-13 | 13F | Headlands Technologies LLC | 0 | -100,00 | 0 | |||||
| 2025-09-26 | NP | UAPIX - Ultrasmall-cap Profund Investor Class | 1.239 | 6,44 | 18 | -5,26 | ||||
| 2026-02-11 | 13F | Janney Montgomery Scott LLC | 31.634 | -19,26 | 0 | |||||
| 2026-02-13 | 13F | Police & Firemen's Retirement System of New Jersey | 27.821 | -10,21 | 431 | -19,48 | ||||
| 2026-02-05 | 13F | Amalgamated Bank | 3.298 | -16,29 | 0 | |||||
| 2026-01-30 | 13F | Archer Investment Corp | 66 | 1 | ||||||
| 2026-02-13 | 13F | Charles Schwab Investment Management Inc | 1.159.896 | -15,27 | 17.955 | -23,96 | ||||
| 2026-02-11 | 13F | Los Angeles Capital Management Llc | 505 | 8 | ||||||
| 2026-02-17 | 13F | Aster Capital Management (DIFC) Ltd | 1.133 | -77,46 | 18 | -80,23 | ||||
| 2026-02-17 | 13F | Jain Global LLC | 0 | -100,00 | 0 | |||||
| 2026-02-06 | 13F | Covestor Ltd | 8.033 | 71,98 | 0 | |||||
| 2026-02-12 | 13F | Dimensional Fund Advisors Lp | 891.726 | -0,52 | 13.804 | -10,73 | ||||
| 2026-02-13 | 13F | Diametric Capital, LP | 259.361 | 10,56 | 4.015 | -0,79 | ||||
| 2026-02-17 | 13F | Schonfeld Strategic Advisors LLC | 146.953 | 383,25 | 2.275 | 333,97 | ||||
| 2026-02-13 | 13F | MAI Capital Management | 47 | 0,00 | 1 | |||||
| 2026-02-19 | 13F | Invesco Ltd. | 534.599 | 340,86 | 8.276 | 295,74 | ||||
| 2026-02-05 | 13F | LGT Group Foundation | 28.710 | -29,99 | 445 | -37,85 | ||||
| 2026-02-17 | 13F | Bank Of America Corp /de/ | 879.183 | -19,86 | 13.610 | -28,09 | ||||
| 2026-02-17 | 13F | Fairfax Financial Holdings Ltd/ Can | 36.633 | 0,00 | 567 | -10,30 | ||||
| 2026-01-28 | 13F | CAPROCK Group, Inc. | 0 | -100,00 | 0 | |||||
| 2026-01-30 | 13F | R Squared Ltd | 12.740 | 197 | ||||||
| 2025-09-26 | NP | MSTSX - Morningstar Unconstrained Allocation Fund | 375.443 | 28,00 | 5.572 | 15,82 | ||||
| 2026-02-13 | 13F | Citigroup Inc | 10.387 | 14,41 | 161 | 2,56 | ||||
| 2025-11-14 | 13F | Caption Management, LLC | Put | 0 | -100,00 | 0 | ||||
| 2025-12-09 | 13F/A | Tudor Investment Corp Et Al | Call | 0 | -100,00 | 0 | -100,00 | |||
| 2025-11-14 | 13F | Parallax Volatility Advisers, L.P. | Call | 0 | -100,00 | 0 | ||||
| 2025-11-14 | 13F | Caption Management, LLC | Call | 0 | -100,00 | 0 | ||||
| 2026-01-29 | 13F | Vanguard Group Inc | 1.120.457 | -3,69 | 17.345 | -13,58 | ||||
| 2026-02-17 | 13F | Alliancebernstein L.p. | 91.378 | -27,69 | 1.415 | -35,14 | ||||
| 2025-11-14 | 13F | Parallax Volatility Advisers, L.P. | 0 | -100,00 | 0 | |||||
| 2025-11-14 | 13F | Kintayl Capital LP | 0 | -100,00 | 0 | |||||
| 2026-02-10 | 13F | Quantbot Technologies LP | 228.819 | -18,20 | 3.542 | -26,59 | ||||
| 2026-02-02 | 13F | Strs Ohio | 51.400 | 796 | ||||||
| 2026-02-17 | 13F | Price T Rowe Associates Inc /md/ | 60.210 | -0,87 | 1 | -100,00 | ||||
| 2025-09-26 | NP | USMIX - Extended Market Index Fund | 13.151 | -2,11 | 195 | -11,36 | ||||
| 2026-01-26 | 13F | Quadrant Private Wealth Management, LLC | 74.501 | -6,76 | 1.153 | -16,33 | ||||
| 2026-02-06 | 13F | Larson Financial Group LLC | 487 | 189,88 | 8 | 250,00 | ||||
| 2025-11-13 | 13F | Barrow Hanley Mewhinney & Strauss Llc | 0 | -100,00 | 0 | -100,00 | ||||
| 2025-09-26 | NP | TSMOX - TIAA-CREF Quant Small/Mid-Cap Equity Fund Retirement Class | 246.521 | 4,17 | 3.658 | -5,75 | ||||
| 2026-02-17 | 13F | Mangrove Partners | 0 | -100,00 | 0 | |||||
| 2026-03-24 | 13F/A | Barclays Plc | Put | 0 | -100,00 | 0 | ||||
| 2025-09-26 | NP | AVFIX - American Beacon Small Cap Value Fund Institutional Class | 0 | -100,00 | 0 | -100,00 | ||||
| 2026-02-13 | 13F | Walleye Capital LLC | 0 | -100,00 | 0 | |||||
| 2026-02-17 | 13F | Dark Forest Capital Management Lp | 0 | -100,00 | 0 | |||||
| 2026-02-13 | 13F | Solstein Capital, LLC | 81 | 0,00 | 1 | 0,00 | ||||
| 2026-02-13 | 13F | Aigen Investment Management, Lp | 20.272 | 314 | ||||||
| 2026-02-12 | 13F | Federated Hermes, Inc. | 0 | -100,00 | 0 | |||||
| 2026-02-13 | 13F | Dynamic Technology Lab Private Ltd | 29.457 | 456 |