Grundlæggende statistik
| Institutionelle ejere | 89 total, 89 long only, 0 short only, 0 long/short - change of 21,92% MRQ |
| Gennemsnitlig porteføljeallokering | 0.2979 % - change of 31,19% MRQ |
| Institutionelle aktier (lange) | 12.382.277 (ex 13D/G) - change of 2,10MM shares 20,43% MRQ |
| Institutionel værdi (lang) | $ 313.867 USD ($1000) |
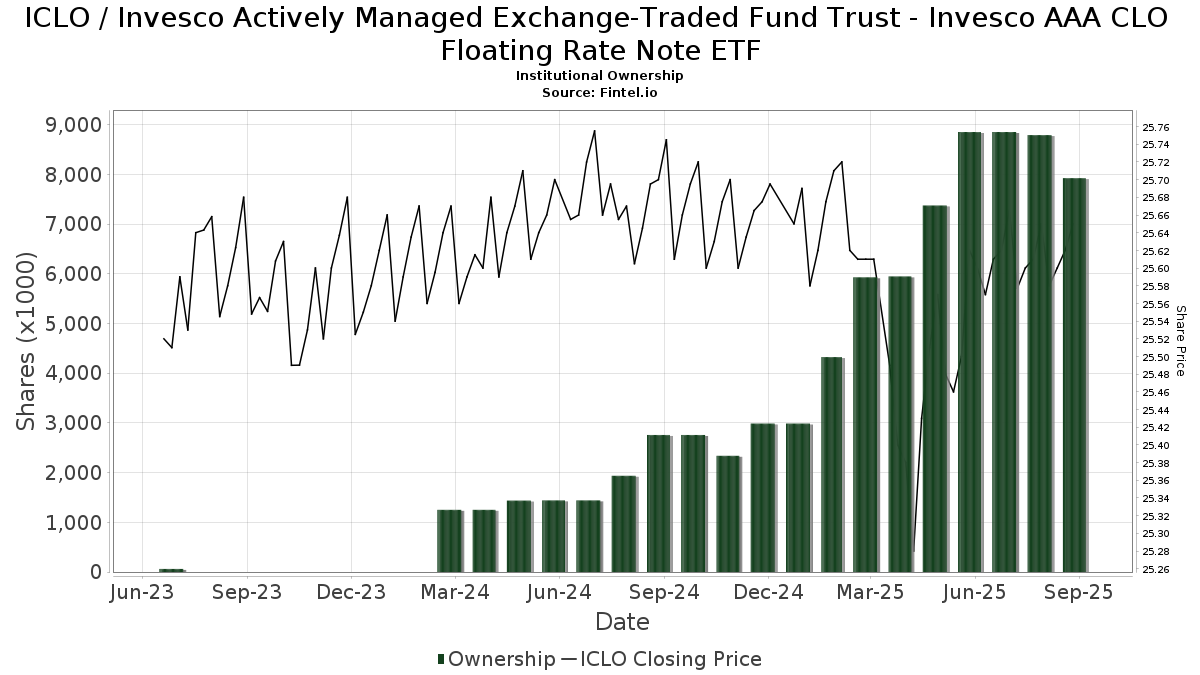
Institutionelt ejerskab og aktionærer
Invesco Actively Managed Exchange-Traded Fund Trust - Invesco AAA CLO Floating Rate Note ETF (US:ICLO) har 89 institutionelle ejere og aktionærer, der har indsendt 13D/G- eller 13F-formularer til Securities Exchange Commission (SEC). Disse institutioner har i alt 12,382,277 aktier. Største aktionærer omfatter LPL Financial LLC, Invesco Ltd., Bank of New York Mellon Corp, AE Wealth Management LLC, Modern Wealth Management, LLC, Private Advisor Group, LLC, Kingsview Wealth Management, LLC, Flagship Harbor Advisors, Llc, GSY - Invesco Ultra Short Duration ETF, and Rooted Wealth Advisors, Inc. .
Invesco Actively Managed Exchange-Traded Fund Trust - Invesco AAA CLO Floating Rate Note ETF (BATS:ICLO) institutionel ejerskabsstruktur viser aktuelle positioner i virksomheden efter institutioner og fonde, samt seneste ændringer i positionsstørrelse. Større aktionærer kan omfatte individuelle investorer, investeringsforeninger, hedgefonde eller institutioner. Skema 13D angiver, at investoren besidder (eller besidder) mere end 5 % af virksomheden og har til hensigt (eller har til hensigt at) aktivt at forfølge en ændring i forretningsstrategi. Skema 13G indikerer en passiv investering på over 5%.
The share price as of March 27, 2026 is 25,48 / share. Previously, on March 28, 2025, the share price was 25,46 / share. This represents an increase of 0,06% over that period.
Fondens stemningsscore
Fund Sentiment Score (fka Ownership Accumulation Score) finder de aktier, der bliver mest købt af fonde. Det er resultatet af en sofistikeret, multi-faktor kvantitativ model, der identificerer virksomheder med de højeste niveauer af institutionel akkumulering. Scoringsmodellen bruger en kombination af den samlede stigning i oplyste ejere, ændringerne i porteføljeallokeringer i disse ejere og andre målinger. Tallet går fra 0 til 100, hvor højere tal indikerer et højere niveau af akkumulering for sine jævnaldrende, og 50 er gennemsnittet.
Opdateringsfrekvens: Dagligt
Se Ownership Explorer, som giver en liste over højest rangerende virksomheder.
AI+ Ask Fintel’s AI assistant about Invesco Actively Managed Exchange-Traded Fund Trust - Invesco AAA CLO Floating Rate Note ETF.
Select a question to share a public post with an AI-crafted answer.
Thinking of good questions…
Institutionel Put/Call-forhold
Ud over at indberette standardaktie- og gældsudstedelser skal institutter med mere end 100 mill. aktiver under forvaltning også oplyse deres put- og call-optionsbeholdninger. Da salgsoptioner generelt indikerer negativ stemning, og købsoptioner indikerer positiv stemning, kan vi få en fornemmelse af den overordnede institutionelle stemning ved at plotte forholdet mellem put og kald. Diagrammet til højre viser det historiske put/call-forhold for dette instrument.
Brug af Put/Call Ratio som en indikator for investorernes stemning overvinder en af de vigtigste mangler ved at bruge totalt institutionelt ejerskab, som er, at en betydelig mængde af aktiver under forvaltning investeres passivt for at spore indekser. Passivt forvaltede fonde køber typisk ikke optioner, så indikatoren for put/call-forholdet følger mere nøje følelsen af aktivt forvaltede fonde.
13D/G-arkivering
Vi præsenterer 13D/G ansøgninger separat fra 13F ansøgninger på grund af den forskellige behandling af SEC. 13D/G-ansøgninger kan indgives af grupper af investorer (med én ledende), hvorimod 13F-ansøgninger ikke kan. Dette resulterer i situationer, hvor en investor kan indsende en 13D/G, der rapporterer én værdi for de samlede aktier (der repræsenterer alle de aktier, der ejes af investorgruppen), men derefter indsender en 13F, der rapporterer en anden værdi for de samlede aktier (der udelukkende repræsenterer deres egne) ejendomsret). Det betyder, at aktieejerskab af 13D/G-arkiver og 13F-arkiveringer ofte ikke er direkte sammenlignelige, så vi præsenterer dem separat.
Bemærk: Fra den 16. maj 2021 viser vi ikke længere ejere, der ikke har indsendt en 13D/G inden for det seneste år. Tidligere viste vi den fulde historie af 13D/G-arkiver. Generelt skal enheder, der er forpligtet til at indgive 13D/G-ansøgninger, indgive mindst årligt, før de indsender en afsluttende ansøgning. Dog forlader fonde nogle gange positioner uden at indsende en afsluttende ansøgning (dvs. de afvikler), så visning af den fulde historie resulterede nogle gange i forvirring om det nuværende ejerskab. For at undgå forvirring viser vi nu kun 'aktuelle' ejere - det vil sige - ejere, der har anmeldt inden for det seneste år.
Upgrade to unlock premium data.
| Fil dato | Form | Investor | Forrige Aktier |
Seneste Aktier |
Δ Aktier (Procent) |
Ejendomsret (Procent) |
Δ Ejerskab (Procent) |
|
|---|---|---|---|---|---|---|---|---|
| 2026-02-06 | Invesco Ltd. | 955,770 | 1,609,096 | 68.36 | 9.60 | 47.69 | ||
| 2025-10-28 | Bank of New York Mellon Corp | 1,087,126 | 1,099,237 | 1.11 | 7.50 | -14.77 |
13F og NPORT arkivering
Detaljer om 13F-arkivering er gratis. Detaljer om NP-ansøgninger kræver et premium-medlemskab. Grønne rækker angiver nye positioner. Røde rækker angiver lukkede positioner. Klik på linket ikon for at se den fulde transaktionshistorik.
Opgrader
for at låse premium-data op og eksportere til Excel ![]() .
.
| Fil dato | Kilde | Investor | Type | Gennemsnitlig pris (Øst) |
Aktier | Δ Aktier (%) |
Rapporteret Værdi ($1000) |
Δ Værdi (%) |
Port Alloc (%) |
|
|---|---|---|---|---|---|---|---|---|---|---|
| 2025-11-04 | 13F | Pineridge Advisors LLC | 559 | 17,93 | 14 | 16,67 | ||||
| 2026-01-22 | 13F | Centennial Advisors, LLC | 12.384 | 316 | ||||||
| 2026-02-13 | 13F | Morgan Stanley | 682 | -77,39 | 17 | -77,92 | ||||
| 2026-02-03 | 13F | CGC Financial Services, LLC | 2.151 | -1,47 | 55 | -1,82 | ||||
| 2026-02-17 | 13F | Regal Investment Advisors LLC | 22.938 | -19,69 | 586 | -19,84 | ||||
| 2026-02-13 | 13F | Goldstone Financial Group, LLC | 10.228 | 261 | ||||||
| 2026-01-22 | 13F | Networth Advisors, LLC | 803 | 21 | ||||||
| 2026-02-17 | 13F | Modern Wealth Management, LLC | 399.906 | 1,75 | 10.218 | 1,51 | ||||
| 2026-02-04 | 13F | Colonial River Wealth Management, LLC | 106.026 | 11,45 | 2.709 | 11,17 | ||||
| 2026-02-17 | 13F | Old Mission Capital Llc | 0 | -100,00 | 0 | |||||
| 2026-02-13 | 13F | Vienna Asset Management LLC | 36.214 | 925 | ||||||
| 2026-02-02 | 13F | Ashton Thomas Securities, Llc | 172.736 | 23,54 | 4.413 | 23,16 | ||||
| 2026-02-09 | 13F | Connecticut Capital Management Group, LLC | 130.025 | 3.322 | ||||||
| 2026-02-26 | 13F/A | Authentikos Wealth Advisory, LLC | 0 | -100,00 | 0 | |||||
| 2025-11-12 | 13F | Transce3nd, LLC | 0 | -100,00 | 0 | |||||
| 2026-01-21 | 13F | Flagship Harbor Advisors, Llc | 306.059 | 7,72 | 7.820 | 7,46 | ||||
| 2025-11-04 | 13F | Guerra Advisors Inc | 142 | 4 | ||||||
| 2026-02-19 | 13F | Invesco Ltd. | 1.609.096 | 68,36 | 41.112 | 67,96 | ||||
| 2026-02-12 | 13F | Sepio Capital, LP | 28.574 | 730 | ||||||
| 2026-02-06 | 13F | Axxcess Wealth Management, Llc | 104.937 | 10,74 | 2.681 | 10,51 | ||||
| 2026-02-17 | 13F | Private Advisor Group, LLC | 389.848 | 32,02 | 9.961 | 31,71 | ||||
| 2026-02-09 | 13F | Keating Financial Advisory Services, Inc. | 7.578 | 194 | ||||||
| 2025-11-14 | 13F | Flow Traders U.s. Llc | 0 | -100,00 | 0 | |||||
| 2026-02-11 | 13F | LPL Financial LLC | 3.384.749 | 38,43 | 86.480 | 38,11 | ||||
| 2026-02-12 | 13F | Jane Street Group, Llc | 65.802 | 1.681 | ||||||
| 2026-02-10 | 13F | Goldman Sachs Group Inc | 55.812 | 1.426 | ||||||
| 2026-01-13 | 13F | Avaii Wealth Management, Llc | 25.115 | 27,25 | 642 | 26,93 | ||||
| 2026-01-14 | 13F | Chris Bulman Inc | 0 | -100,00 | 0 | |||||
| 2026-02-17 | 13F | Cetera Investment Advisers | 47.118 | -28,51 | 1.204 | -28,69 | ||||
| 2026-02-17 | 13F | Tower Research Capital LLC (TRC) | 14.710 | 870,32 | 376 | 886,84 | ||||
| 2026-02-11 | 13F | J.w. Cole Advisors, Inc. | 16.223 | -43,86 | 415 | -44,05 | ||||
| 2026-02-17 | 13F | Gladstone Institutional Advisory LLC | 75.483 | 0,46 | 1.929 | 0,21 | ||||
| 2026-02-02 | 13F | B.O.S.S. Retirement Advisors, LLC | 77.463 | -62,53 | 1.979 | -62,62 | ||||
| 2026-02-02 | 13F | Truist Financial Corp | 24.053 | 17,35 | 615 | 17,18 | ||||
| 2026-01-08 | 13F | Wealth Enhancement Advisory Services, Llc | 203.793 | -12,01 | 5.213 | -12,11 | ||||
| 2026-02-12 | 13F | Commonwealth Equity Services, Llc | 75.022 | 28,50 | 1.917 | 191.500,00 | ||||
| 2026-02-10 | 13F | Root Financial Partners, LLC | 2.045 | -62,44 | 52 | -62,59 | ||||
| 2026-02-13 | 13F | Jacobi Capital Management LLC | 69.944 | -0,62 | 1.787 | -0,83 | ||||
| 2026-02-17 | 13F | Advisor Group Holdings, Inc. | 55.561 | 6,20 | 1.420 | 5,97 | ||||
| 2026-01-23 | 13F | Meridian Financial, LLC | 44.034 | 112,72 | 1.125 | 112,26 | ||||
| 2026-02-05 | 13F | Cambridge Investment Research Advisors, Inc. | 96.814 | 52,33 | 2 | 100,00 | ||||
| 2025-11-13 | 13F | UBS Group AG | 0 | -100,00 | 0 | -100,00 | ||||
| 2026-01-23 | 13F | U.S. Capital Wealth Advisors, LLC | 0 | -100,00 | 0 | |||||
| 2025-11-12 | 13F | Park Square Financial Group, LLC | 0 | -100,00 | 0 | -100,00 | ||||
| 2026-01-26 | 13F | San Luis Wealth Advisors LLC | 110.145 | 16,26 | 2.814 | 15,99 | ||||
| 2026-02-06 | 13F | Lloyd Advisory Services, LLC. | 769 | 20 | ||||||
| 2026-02-12 | 13F | Steward Partners Investment Advisory, Llc | 23.648 | 23,81 | 604 | 23,52 | ||||
| 2026-02-17 | 13F | Garden State Investment Advisory Services LLC | 142.671 | 13,97 | 3.645 | 13,69 | ||||
| 2026-01-29 | 13F | Comerica Bank | 6.645 | 29,56 | 170 | 29,01 | ||||
| 2026-01-09 | 13F | BOS Asset Management, LLC | 39.006 | 33,40 | 997 | 33,16 | ||||
| 2026-01-12 | 13F | Brucke Financial, Inc. | 48.390 | 155,96 | 1.236 | 155,90 | ||||
| 2026-02-17 | 13F | Elequin Capital Lp | 218 | 0,00 | 6 | 0,00 | ||||
| 2026-01-20 | 13F | ASL Financial, LLC | 132.828 | 3.419 | ||||||
| 2026-02-13 | 13F | Mariner, LLC | 95.240 | -19,54 | 2.433 | -19,73 | ||||
| 2026-02-09 | 13F | Rooted Wealth Advisors, Inc. | 241.051 | 0,12 | 6.159 | -0,08 | ||||
| 2026-01-29 | 13F | Quest 10 Wealth Builders, Inc. | 19.811 | -2,27 | 506 | -2,50 | ||||
| 2025-11-12 | 13F | Napa Wealth Management | 27.320 | 1,62 | 700 | 1,75 | ||||
| 2026-01-21 | 13F | Leo Wealth, LLC | 10.616 | 532 | ||||||
| 2026-01-28 | 13F | Geneos Wealth Management Inc. | 349 | -29,78 | 9 | -33,33 | ||||
| 2026-02-06 | 13F | Cedar Wealth Management, LLC | 74.214 | -3,26 | 1.896 | -3,46 | ||||
| 2025-12-02 | 13F | IFP Advisors, Inc | 0 | -100,00 | 0 | |||||
| 2026-01-26 | 13F | Slagle Financial, LLC | 8.433 | -5,10 | 215 | -5,29 | ||||
| 2026-03-11 | 13F | Green Ridge Wealth Planning LLC | 103.834 | 2.653 | ||||||
| 2026-01-26 | 13F | AE Wealth Management LLC | 990.873 | 4,74 | 25.317 | 4,49 | ||||
| 2026-02-05 | 13F | Triton Wealth Management, PLLC | 11.002 | 2,90 | 281 | 2,93 | ||||
| 2026-01-21 | 13F | Raleigh Capital Management Inc. | 3.337 | 85 | ||||||
| 2026-01-22 | 13F | Elm3 Financial Group, LLC | 159.783 | -26,83 | 4.082 | -27,00 | ||||
| 2026-01-26 | 13F | Key Capital Management, INC | 43.199 | 1.104 | ||||||
| 2026-02-12 | 13F | Hrt Financial Lp | 10.990 | 0 | ||||||
| 2026-01-26 | 13F | Merit Financial Group, LLC | 8.016 | 205 | ||||||
| 2026-02-10 | 13F | Beto Financial Group, Llc | 15.433 | 394 | ||||||
| 2026-02-02 | 13F | FSA Advisors, Inc. | 8.305 | 212 | ||||||
| 2026-02-17 | 13F | Royal Bank Of Canada | 7.890 | -56,02 | 202 | -55,99 | ||||
| 2026-02-17 | 13F | Bank Of America Corp /de/ | 83.537 | -0,72 | 2.134 | -0,93 | ||||
| 2026-01-26 | 13F | LifeWealth Investments, LLC | 28.802 | -1,55 | 736 | -1,87 | ||||
| 2026-02-13 | 13F | Sterling Capital Management LLC | 47 | 0,00 | 1 | 0,00 | ||||
| 2026-03-03 | 13F | NWF Advisory Services Inc. | 13.710 | -11,09 | 350 | -11,17 | ||||
| 2026-02-05 | 13F | Western Wealth Management, LLC | 34.847 | 19,64 | 890 | 19,46 | ||||
| 2026-02-17 | 13F | Jones Financial Companies Lllp | 42.403 | 21.757,22 | 1.083 | 26.975,00 | ||||
| 2026-01-23 | 13F | Howard Capital Management Inc. | 0 | -100,00 | 0 | |||||
| 2026-02-10 | 13F | Bank of New York Mellon Corp | 1.100.800 | 0,14 | 28.125 | -0,09 | ||||
| 2025-09-29 | NP | GSY - Invesco Ultra Short Duration ETF This fund is a listed as child fund of Invesco Ltd. and if that institution has disclosed ownership in this security, then these positions will not be double counted when calculating total shares and total value | 274.672 | 0,00 | 7.023 | 0,56 | ||||
| 2026-01-26 | 13F | Private Trust Co Na | 5.000 | 0,00 | 128 | -0,78 | ||||
| 2026-02-13 | 13F | Asset Allocation Strategies LLC | 126.439 | 8,54 | 3.231 | 8,28 | ||||
| 2026-01-20 | 13F | FLP Wealth Management, LLC | 1.329 | -86,66 | 279 | 9,41 | ||||
| 2025-11-13 | 13F | Fmr Llc | 0 | -100,00 | 0 | -100,00 | ||||
| 2026-02-11 | 13F | Endurance Services Ltd | 0 | -100,00 | 0 | |||||
| 2026-02-10 | 13F/A | Northwestern Mutual Wealth Management Co | 39 | 0,00 | 1 | |||||
| 2026-02-17 | 13F | Citadel Advisors Llc | 28.088 | -46,77 | 718 | -46,93 | ||||
| 2026-01-23 | 13F | Ritholtz Wealth Management | 156.510 | 3.999 | ||||||
| 2026-02-06 | 13F | Fortis Group Advisors, LLC | 0 | -100,00 | 0 | |||||
| 2026-02-06 | 13F | Kingdom Financial Group LLC. | 11.850 | 25,46 | 303 | 25,31 | ||||
| 2026-01-14 | 13F | Elevatus Welath Management | 173.450 | 261,23 | 4.432 | 260,54 | ||||
| 2026-02-10 | 13F | Envestnet Asset Management Inc | 83.305 | -8,33 | 2.128 | -8,55 | ||||
| 2026-01-15 | 13F | Brookstone Capital Management | 0 | -100,00 | 0 | |||||
| 2026-01-27 | 13F | Elevated Capital Advisors, LLC | 50 | 1 | ||||||
| 2026-02-09 | 13F | Harbour Investments, Inc. | 4.750 | -62,79 | 121 | -62,88 | ||||
| 2026-01-30 | 13F | Simplicity Wealth,LLC | 21.531 | 5,17 | 550 | 4,96 | ||||
| 2026-01-29 | 13F | Concurrent Investment Advisors, LLC | 87.413 | 95,38 | 2.233 | 95,02 | ||||
| 2026-02-09 | 13F | Kingsview Wealth Management, LLC | 337.345 | -3,58 | 8.619 | -3,80 | ||||
| 2026-02-18 | 13F | GWM Advisors LLC | 600 | 0,00 | 15 | 0,00 | ||||
| 2025-10-07 | 13F | TCP Asset Management, LLC | 0 | -100,00 | 0 | |||||
| 2026-02-04 | 13F | Pensionmark Financial Group, Llc | 20.989 | 90,65 | 288 | 2,49 | ||||
| 2026-02-03 | 13F | International Assets Investment Management, Llc | 800 | 20 |