Grundlæggende statistik
| Institutionelle ejere | 175 total, 175 long only, 0 short only, 0 long/short - change of -2,22% MRQ |
| Gennemsnitlig porteføljeallokering | 0.1285 % - change of -10,96% MRQ |
| Institutionelle aktier (lange) | 17.367.063 (ex 13D/G) - change of 0,38MM shares 2,22% MRQ |
| Institutionel værdi (lang) | $ 427.198 USD ($1000) |
Institutionelt ejerskab og aktionærer
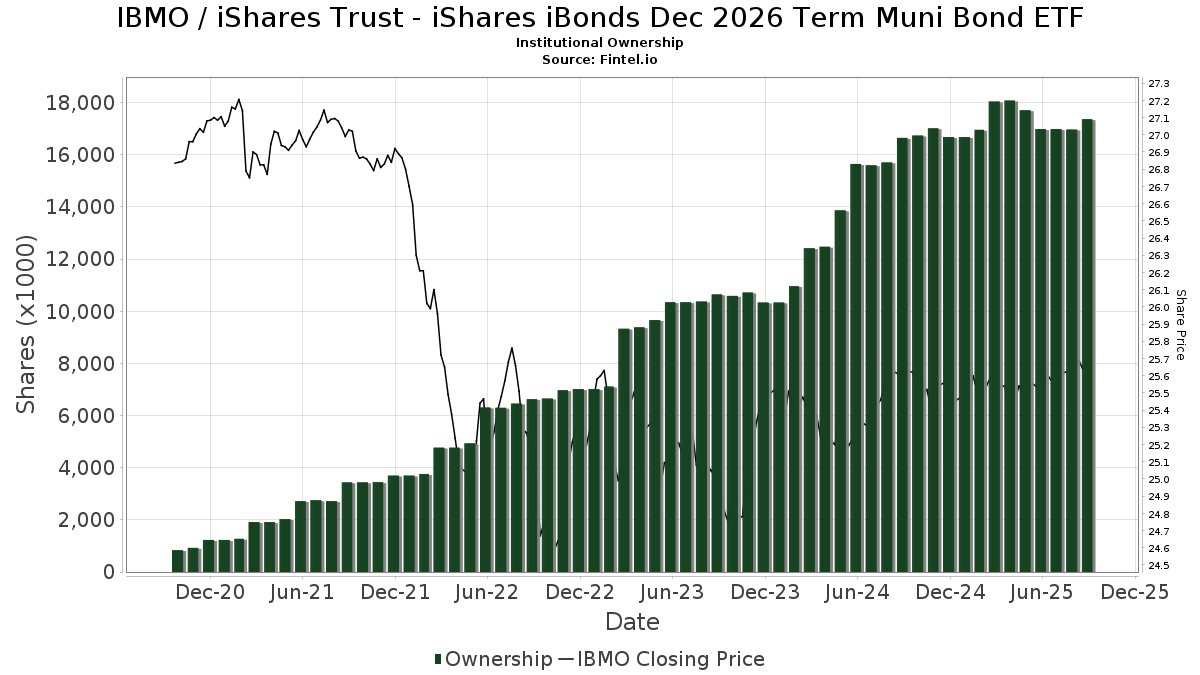
iShares Trust - iShares iBonds Dec 2026 Term Muni Bond ETF (US:IBMO) har 175 institutionelle ejere og aktionærer, der har indsendt 13D/G- eller 13F-formularer til Securities Exchange Commission (SEC). Disse institutioner har i alt 17,367,063 aktier. Største aktionærer omfatter Bank Of America Corp /de/, Mercer Global Advisors Inc /adv, Hartland & Co., LLC, Envestnet Asset Management Inc, Us Bancorp \de\, Morgan Stanley, GWM Advisors LLC, Wells Fargo & Company/mn, Kathmere Capital Management, LLC, and UBS Group AG .
iShares Trust - iShares iBonds Dec 2026 Term Muni Bond ETF (BATS:IBMO) institutionel ejerskabsstruktur viser aktuelle positioner i virksomheden efter institutioner og fonde, samt seneste ændringer i positionsstørrelse. Større aktionærer kan omfatte individuelle investorer, investeringsforeninger, hedgefonde eller institutioner. Skema 13D angiver, at investoren besidder (eller besidder) mere end 5 % af virksomheden og har til hensigt (eller har til hensigt at) aktivt at forfølge en ændring i forretningsstrategi. Skema 13G indikerer en passiv investering på over 5%.
The share price as of September 12, 2025 is 25,71 / share. Previously, on September 16, 2024, the share price was 25,65 / share. This represents an increase of 0,23% over that period.
Fondens stemningsscore
Fund Sentiment Score (fka Ownership Accumulation Score) finder de aktier, der bliver mest købt af fonde. Det er resultatet af en sofistikeret, multi-faktor kvantitativ model, der identificerer virksomheder med de højeste niveauer af institutionel akkumulering. Scoringsmodellen bruger en kombination af den samlede stigning i oplyste ejere, ændringerne i porteføljeallokeringer i disse ejere og andre målinger. Tallet går fra 0 til 100, hvor højere tal indikerer et højere niveau af akkumulering for sine jævnaldrende, og 50 er gennemsnittet.
Opdateringsfrekvens: Dagligt
Se Ownership Explorer, som giver en liste over højest rangerende virksomheder.
Institutionel Put/Call-forhold
Ud over at indberette standardaktie- og gældsudstedelser skal institutter med mere end 100 mill. aktiver under forvaltning også oplyse deres put- og call-optionsbeholdninger. Da salgsoptioner generelt indikerer negativ stemning, og købsoptioner indikerer positiv stemning, kan vi få en fornemmelse af den overordnede institutionelle stemning ved at plotte forholdet mellem put og kald. Diagrammet til højre viser det historiske put/call-forhold for dette instrument.
Brug af Put/Call Ratio som en indikator for investorernes stemning overvinder en af de vigtigste mangler ved at bruge totalt institutionelt ejerskab, som er, at en betydelig mængde af aktiver under forvaltning investeres passivt for at spore indekser. Passivt forvaltede fonde køber typisk ikke optioner, så indikatoren for put/call-forholdet følger mere nøje følelsen af aktivt forvaltede fonde.
13F og NPORT arkivering
Detaljer om 13F-arkivering er gratis. Detaljer om NP-ansøgninger kræver et premium-medlemskab. Grønne rækker angiver nye positioner. Røde rækker angiver lukkede positioner. Klik på linket ikon for at se den fulde transaktionshistorik.
Opgrader
for at låse premium-data op og eksportere til Excel ![]() .
.
| Fil dato | Kilde | Investor | Type | Gennemsnitlig pris (Øst) |
Aktier | Δ Aktier (%) |
Rapporteret Værdi ($1000) |
Δ Værdi (%) |
Port Alloc (%) |
|
|---|---|---|---|---|---|---|---|---|---|---|
| 2025-05-05 | 13F | Creekmur Asset Management LLC | 0 | -100,00 | 0 | |||||
| 2025-07-16 | 13F | Signaturefd, Llc | 8.988 | 0,00 | 230 | 0,44 | ||||
| 2025-08-04 | 13F | Atria Investments Llc | 38.536 | -16,99 | 987 | -16,78 | ||||
| 2025-08-04 | 13F | Spinnaker Trust | 47.700 | 5,80 | 1.222 | 6,08 | ||||
| 2025-08-14 | 13F | Mercer Global Advisors Inc /adv | 947.342 | 10,28 | 24.274 | 10,55 | ||||
| 2025-07-15 | 13F | Cora Capital Advisors Llc | 12.500 | 0,00 | 320 | 0,31 | ||||
| 2025-08-07 | 13F | Rossmore Private Capital | 11.736 | 0,00 | 301 | 0,33 | ||||
| 2025-08-12 | 13F | BlackRock, Inc. | 147 | 0,68 | 4 | 0,00 | ||||
| 2025-07-17 | 13F | Archford Capital Strategies, LLC | 16.384 | 3,65 | 420 | 3,71 | ||||
| 2025-07-29 | 13F | Stratos Wealth Partners, LTD. | 34.352 | -22,48 | 880 | -22,26 | ||||
| 2025-08-11 | 13F | United Capital Financial Advisers, Llc | 108.197 | 0,08 | 2.772 | 0,33 | ||||
| 2025-08-12 | 13F | Deutsche Bank Ag\ | 41.021 | 0,00 | 1.051 | 0,19 | ||||
| 2025-08-14 | 13F | Garden State Investment Advisory Services LLC | 0 | -100,00 | 0 | |||||
| 2025-07-07 | 13F | Trust Co | 13.708 | -0,01 | 351 | 0,29 | ||||
| 2025-07-22 | 13F | Partners Wealth Management, Llc | 11.489 | 0,00 | 293 | 0,00 | ||||
| 2025-07-16 | 13F | Evergreen Private Wealth LLC | 44.590 | -0,97 | 1.143 | -0,70 | ||||
| 2025-07-17 | 13F | Coastline Trust Co | 1.918 | 0,00 | 49 | 0,00 | ||||
| 2025-08-15 | 13F | Captrust Financial Advisors | 18.689 | -8,31 | 479 | -8,08 | ||||
| 2025-07-10 | 13F | Global Financial Private Client, LLC | 0 | -100,00 | 0 | |||||
| 2025-07-11 | 13F | Quantum Financial Advisors, LLC | 156.480 | 2,79 | 4.009 | 3,03 | ||||
| 2025-08-12 | 13F | Wealthbridge Capital Management, Llc | 15.433 | 5,27 | 395 | 5,61 | ||||
| 2025-08-15 | 13F | Morgan Stanley | 688.174 | 0,09 | 17.633 | 0,34 | ||||
| 2025-07-15 | 13F | Droms Strauss Advisors Inc /mo/ /adv | 11.714 | 3,52 | 300 | 3,81 | ||||
| 2025-08-14 | 13F | Susquehanna International Group, Llp | 0 | -100,00 | 0 | |||||
| 2025-07-09 | 13F | Praetorian Wealth Management, Inc. | 237.175 | 0,12 | 6.077 | 0,36 | ||||
| 2025-08-12 | 13F | Steward Partners Investment Advisory, Llc | 8.474 | 0,00 | 217 | 0,46 | ||||
| 2025-08-14 | 13F | Goldman Sachs Group Inc | 28.310 | 151,44 | 725 | 152,61 | ||||
| 2025-07-15 | 13F | Postrock Partners Llc | 38.416 | 3,64 | 984 | 3,91 | ||||
| 2025-08-12 | 13F | Covington Investment Advisors Inc. | 306.590 | 1,76 | 8 | 0,00 | ||||
| 2025-08-06 | 13F | Rialto Wealth Management, LLC | 965 | 0,00 | 25 | 0,00 | ||||
| 2025-08-01 | 13F | First National Trust Co | 9.949 | 12,63 | 255 | 12,89 | ||||
| 2025-08-14 | 13F | UBS Group AG | 447.469 | -4,57 | 11.465 | -4,34 | ||||
| 2025-04-11 | 13F | First Affirmative Financial Network | 19.444 | 4,22 | 497 | 4,64 | ||||
| 2025-07-01 | 13F | Harbor Investment Advisory, Llc | 3.656 | 0,00 | 94 | 0,00 | ||||
| 2025-08-11 | 13F | Summit Wealth Partners, LLC | 8.918 | 0,00 | 229 | 0,44 | ||||
| 2025-05-07 | 13F | HB Wealth Management, LLC | 0 | -100,00 | 0 | |||||
| 2025-05-14 | 13F | Evergreen Wealth Solutions, LLC | 0 | -100,00 | 0 | |||||
| 2025-08-14 | 13F | Benjamin Edwards Inc | 47.752 | -1,72 | 1.224 | -1,45 | ||||
| 2025-07-29 | 13F | Roof Eidam & Maycock/adv | 29.703 | 0,16 | 761 | 0,53 | ||||
| 2025-07-30 | 13F | Granite Harbor Advisors, Inc. | 44.803 | -7,30 | 1.148 | -7,13 | ||||
| 2025-07-11 | 13F | Financial Advisory Corp | 26.910 | 690 | ||||||
| 2025-08-13 | 13F | Beacon Pointe Advisors, LLC | 48.859 | -8,47 | 1.252 | -8,28 | ||||
| 2025-08-14 | 13F | Diversify Advisory Services, LLC | 8.140 | 0,78 | 209 | 0,97 | ||||
| 2025-08-06 | 13F | Commonwealth Equity Services, Llc | 149.722 | -2,51 | 4 | 0,00 | ||||
| 2025-08-14 | 13F | Jane Street Group, Llc | 82.820 | 159,18 | 2.122 | 160,05 | ||||
| 2025-08-07 | 13F | Allworth Financial LP | 802 | 0,00 | 21 | 0,00 | ||||
| 2025-07-23 | 13F | Valmark Advisers, Inc. | 63.358 | 8,77 | 1.623 | 9,07 | ||||
| 2025-07-16 | 13F | Kerntke Otto McGlone Wealth Management Group | 0 | -100,00 | 0 | |||||
| 2025-08-14 | 13F | Glen Eagle Advisors, LLC | 3.225 | 0,00 | 83 | 0,00 | ||||
| 2025-08-08 | 13F | Wrapmanager Inc | 13.881 | -4,37 | 356 | -4,31 | ||||
| 2025-07-22 | 13F | Woodmont Investment Counsel Llc | 65.336 | -0,60 | 1.674 | -0,36 | ||||
| 2025-08-05 | 13F | American Capital Advisory, LLC | 2.221 | 0,00 | 57 | 0,00 | ||||
| 2025-08-14 | 13F | Stifel Financial Corp | 131.227 | 4,87 | 3.362 | 5,13 | ||||
| 2025-08-14 | 13F | Integrated Wealth Concepts LLC | 336.583 | 3,47 | 8.624 | 3,73 | ||||
| 2025-08-14 | 13F | Wiley Bros.-aintree Capital, Llc | 15.130 | -25,92 | 388 | -21,66 | ||||
| 2025-08-13 | 13F | Northwestern Mutual Wealth Management Co | 287.385 | 6,92 | 7.364 | 7,18 | ||||
| 2025-08-14 | 13F | Raymond James Financial Inc | 204.997 | -28,16 | 5.253 | -27,99 | ||||
| 2025-08-14 | 13F | Colony Group, LLC | 65.243 | 8,80 | 1.672 | 9,07 | ||||
| 2025-08-01 | 13F | Envestnet Asset Management Inc | 878.008 | 0,52 | 22.497 | 0,77 | ||||
| 2025-07-31 | 13F | Cambridge Investment Research Advisors, Inc. | 33.963 | 119,31 | 1 | |||||
| 2025-08-12 | 13F | Ameritas Investment Partners, Inc. | 6.455 | -6,08 | 165 | -5,71 | ||||
| 2025-04-24 | 13F | Aspect Partners, LLC | 0 | -100,00 | 0 | |||||
| 2025-07-18 | 13F | Foundry Financial Group, Inc. | 39.977 | 0,10 | 1.024 | 0,39 | ||||
| 2025-07-23 | 13F | Beaumont Asset Management, L.L.C. | 8.320 | 213 | ||||||
| 2025-05-15 | 13F/A | Orion Portfolio Solutions, LLC | 44.564 | 438,80 | 1.139 | 442,38 | ||||
| 2025-07-25 | 13F | Commonwealth Financial Services, LLC | 13.655 | -3,12 | 350 | -3,06 | ||||
| 2025-07-21 | 13F | Cornell Pochily Investment Advisors, Inc. | 7.935 | 203 | ||||||
| 2025-08-14 | 13F | Wells Fargo & Company/mn | 503.073 | 2,03 | 12.890 | 2,29 | ||||
| 2025-07-16 | 13F | Novem Group | 21.753 | 1,13 | 557 | 1,46 | ||||
| 2025-04-15 | 13F | Members Wealth Llc | 22.406 | 3,64 | 573 | 3,81 | ||||
| 2025-08-05 | 13F | Hills Bank & Trust Co | 383.212 | 17,75 | 9.819 | 18,05 | ||||
| 2025-08-14 | 13F | STAR Financial Bank | 0 | -100,00 | 0 | |||||
| 2025-08-19 | 13F | Asset Dedication, LLC | 9.282 | 0,00 | 238 | 0,00 | ||||
| 2025-09-04 | 13F/A | Advisor Group Holdings, Inc. | 107.449 | -6,24 | 2.753 | -6,04 | ||||
| 2025-08-08 | 13F | Creative Planning | 11.556 | 0,00 | 296 | 0,34 | ||||
| 2025-08-12 | 13F | Argent Trust Co | 0 | -100,00 | 0 | -100,00 | ||||
| 2025-07-24 | 13F | Us Bancorp \de\ | 734.542 | 6,75 | 18.821 | 7,02 | ||||
| 2025-07-14 | 13F | Sentinel Pension Advisors Inc | 68.613 | -0,20 | 1.758 | 0,06 | ||||
| 2025-07-17 | 13F | Janney Montgomery Scott LLC | 14.125 | -36,77 | 0 | |||||
| 2025-08-01 | 13F | Ashton Thomas Private Wealth, LLC | 0 | -100,00 | 0 | |||||
| 2025-08-15 | 13F | Howland Capital Management Llc | 188.806 | 3,92 | 4.838 | 4,18 | ||||
| 2025-08-11 | 13F | HighTower Advisors, LLC | 329.979 | -4,25 | 8.455 | -4,01 | ||||
| 2025-08-13 | 13F | Baird Financial Group, Inc. | 10.000 | 0,00 | 256 | 0,39 | ||||
| 2025-05-07 | 13F | Mb, Levis & Associates, Llc | 0 | -100,00 | 0 | -100,00 | ||||
| 2025-07-17 | 13F | E Six Thirteen, Llc | 135.772 | 0,00 | 3.479 | 0,23 | ||||
| 2025-08-07 | 13F | New England Private Wealth Advisors LLC | 73.288 | 0,05 | 1.878 | 0,27 | ||||
| 2025-08-15 | 13F | CI Private Wealth, LLC | 23.406 | -51,98 | 600 | -51,89 | ||||
| 2025-08-05 | 13F | Huntington National Bank | 0 | |||||||
| 2025-08-14 | 13F | Mariner, LLC | 41.741 | -0,22 | 1.070 | 0,00 | ||||
| 2025-08-14 | 13F | Glenview Trust Co | 58.838 | 0,00 | 1.508 | 0,27 | ||||
| 2025-07-25 | 13F | Apollon Wealth Management, LLC | 14.000 | -30,00 | 359 | -29,94 | ||||
| 2025-05-09 | 13F | Ogorek Anthony Joseph /ny/ /adv | 0 | -100,00 | 0 | |||||
| 2025-08-14 | 13F | IHT Wealth Management, LLC | 42.008 | 0,58 | 1.076 | 0,84 | ||||
| 2025-08-05 | 13F | Gould Asset Management Llc /ca/ | 20.375 | 17,23 | 522 | 17,57 | ||||
| 2025-07-30 | 13F | Rehmann Capital Advisory Group | 12.479 | 0,16 | 320 | 0,31 | ||||
| 2025-08-13 | 13F | Peloton Wealth Strategists | 11.000 | 0,00 | 0 | |||||
| 2025-08-06 | 13F | AE Wealth Management LLC | 0 | -100,00 | 0 | |||||
| 2025-07-28 | 13F | Harbour Investments, Inc. | 1.936 | 426,09 | 50 | 444,44 | ||||
| 2025-08-07 | 13F | Kestra Private Wealth Services, Llc | 60.724 | 10,88 | 1.556 | 11,15 | ||||
| 2025-08-06 | 13F | Savant Capital, LLC | 9.312 | 0,00 | 239 | 0,00 | ||||
| 2025-08-13 | 13F | Lido Advisors, LLC | 319.096 | 13,02 | 8.176 | 13,30 | ||||
| 2025-08-13 | 13F | RIA Advisory Group LLC | 55.323 | 4,77 | 1.418 | 5,04 | ||||
| 2025-08-08 | 13F | Hartland & Co., LLC | 882.174 | 3,13 | 22.604 | 3,38 | ||||
| 2025-07-16 | 13F | Kathmere Capital Management, LLC | 474.005 | -10,29 | 12.145 | -10,06 | ||||
| 2025-07-24 | 13F | Moseley Investment Management Inc | 55.929 | -9,69 | 1.433 | -9,42 | ||||
| 2025-07-24 | 13F | Cyndeo Wealth Partners, LLC | 133.532 | -17,50 | 3.421 | -17,29 | ||||
| 2025-07-11 | 13F | Farther Finance Advisors, LLC | 180 | 0,00 | 5 | 0,00 | ||||
| 2025-08-11 | 13F | Arrow Financial Corp | 9.451 | 0,00 | 242 | 0,41 | ||||
| 2025-08-13 | 13F | Smith, Moore & Co. | 13.848 | 71,45 | 355 | 71,84 | ||||
| 2025-07-18 | 13F | Precision Wealth Strategies, LLC | 10.225 | 262 | ||||||
| 2025-08-06 | 13F | Horan Securities, Inc. | 8.453 | 0,00 | 217 | 0,00 | ||||
| 2025-08-14 | 13F/A | Rockefeller Capital Management L.P. | 10.403 | 0,29 | 267 | 0,38 | ||||
| 2025-08-12 | 13F | LPL Financial LLC | 388.657 | 0,19 | 9.959 | 0,43 | ||||
| 2025-07-17 | 13F/A | Capital Investment Advisors, LLC | 63.738 | 11,05 | 1.633 | 11,39 | ||||
| 2025-08-08 | 13F | Cetera Investment Advisers | 45.411 | 13,88 | 1.164 | 14,13 | ||||
| 2025-07-08 | 13F | Richard P Slaughter Associates Inc | 0 | -100,00 | 0 | |||||
| 2025-07-22 | 13F | Strid Group, LLC | 13.404 | -57,01 | 343 | -56,91 | ||||
| 2025-07-31 | 13F | Resonant Capital Advisors, LLC | 27.461 | 0,00 | 704 | 0,29 | ||||
| 2025-08-11 | 13F | Actinver Wealth Management, Inc. | 11.127 | 2,52 | 285 | 2,89 | ||||
| 2025-07-31 | 13F | Leavell Investment Management, Inc. | 270.987 | 1,83 | 6.944 | 2,09 | ||||
| 2025-08-01 | 13F | Schmidt P J Investment Management Inc | 0 | -100,00 | 0 | |||||
| 2025-07-08 | 13F | Legacy Private Trust Co. | 7.870 | 0,00 | 202 | 0,00 | ||||
| 2025-08-27 | 13F/A | Brinker Capital Investments, LLC | 54.917 | 23,23 | 1.407 | 23,53 | ||||
| 2025-08-14 | 13F | Ameriprise Financial Inc | 143.957 | -9,03 | 3.689 | -8,74 | ||||
| 2025-07-08 | 13F | Prism Advisors, Inc. | 35.665 | 0,00 | 914 | 0,22 | ||||
| 2025-08-14 | 13F | Comerica Bank | 836 | -5,32 | 21 | -4,55 | ||||
| 2025-07-30 | 13F | Patten Group, Inc. | 9.111 | 0,00 | 233 | 0,43 | ||||
| 2025-04-16 | 13F | Wealth Enhancement Advisory Services, Llc | 0 | -100,00 | 0 | |||||
| 2025-05-13 | 13F | PFG Private Wealth Management, LLC | 0 | -100,00 | 0 | |||||
| 2025-08-14 | 13F | Royal Bank Of Canada | 95.232 | -0,63 | 2.440 | -0,37 | ||||
| 2025-08-11 | 13F | Avantax Planning Partners, Inc. | 13.229 | 0,00 | 339 | 0,00 | ||||
| 2025-08-07 | 13F | CENTRAL TRUST Co | 172.675 | 6,59 | 4.424 | 6,86 | ||||
| 2025-08-04 | 13F | ArborFi Advisors, LLC | 0 | -100,00 | 0 | |||||
| 2025-08-13 | 13F | MONECO Advisors, LLC | 10.893 | 0,00 | 279 | 0,36 | ||||
| 2025-08-14 | 13F | Fmr Llc | 300 | -96,09 | 8 | -96,43 | ||||
| 2025-05-12 | 13F | Sandy Spring Bank | 43.869 | 1,11 | 1.121 | 1,54 | ||||
| 2025-08-12 | 13F | Proequities, Inc. | 0 | 0 | ||||||
| 2025-08-15 | 13F | Stonebridge Capital Advisors LLC | 0 | -100,00 | 0 | |||||
| 2025-07-28 | 13F | Nestegg Advisors, Inc. | 0 | -100,00 | 0 | |||||
| 2025-08-13 | 13F | Baltimore-Washington Financial Advisors, Inc. | 8.179 | 0,00 | 210 | 0,00 | ||||
| 2025-07-17 | 13F | Catalytic Wealth RIA, LLC | 31.114 | -2,05 | 797 | -1,73 | ||||
| 2025-07-24 | 13F | IFP Advisors, Inc | 34.578 | 12,47 | 886 | 12,74 | ||||
| 2025-08-06 | 13F | Atlantic Union Bankshares Corp | 43.830 | 1.123 | ||||||
| 2025-08-15 | 13F | Kestra Advisory Services, LLC | 0 | -100,00 | 0 | |||||
| 2025-07-09 | 13F | Bank of New Hampshire | 2.905 | 0,00 | 74 | 0,00 | ||||
| 2025-08-13 | 13F | Jones Financial Companies Lllp | 2.141 | 0,00 | 55 | 0,00 | ||||
| 2025-07-21 | 13F | Crews Bank & Trust | 30.981 | 0,00 | 794 | 0,25 | ||||
| 2025-07-30 | 13F | Phillips Financial Management, Llc | 59.217 | 19,55 | 1.517 | 19,83 | ||||
| 2025-08-14 | 13F | Bank Of America Corp /de/ | 1.963.364 | 4,07 | 50.307 | 4,33 | ||||
| 2025-08-14 | 13F | 10Elms LLP | 23.794 | 1,71 | 610 | 2,01 | ||||
| 2025-07-29 | 13F | Private Trust Co Na | 9.739 | 28,58 | 250 | 29,02 | ||||
| 2025-08-11 | 13F | Private Advisor Group, LLC | 17.719 | 454 | ||||||
| 2025-08-14 | 13F | GWM Advisors LLC | 615.172 | 8,01 | 15.763 | 8,27 | ||||
| 2025-08-11 | 13F | Shufro Rose & Co Llc | 9.964 | 0,00 | 255 | 0,00 | ||||
| 2025-08-13 | 13F | Cary Street Partners Financial Llc | 9.595 | 0,00 | 246 | 0,00 | ||||
| 2025-08-14 | 13F | Modern Wealth Management, LLC | 45.042 | 18,37 | 1.154 | 18,72 | ||||
| 2025-07-28 | 13F | WJ Wealth Management, LLC | 12.179 | -71,89 | 312 | -71,82 | ||||
| 2025-05-16 | 13F/A | Kestra Investment Management, LLC | 0 | -100,00 | 0 | |||||
| 2025-07-29 | 13F | Accretive Wealth Partners, LLC | 8.196 | 210 | ||||||
| 2025-08-14 | 13F | Kovitz Investment Group Partners, LLC | 69.052 | 60,12 | 1.769 | 60,53 | ||||
| 2025-07-22 | 13F | Belpointe Asset Management LLC | 47.256 | 1.211 | ||||||
| 2025-07-22 | 13F | Blue Square Asset Management, Llc | 44.750 | -1,99 | 1.147 | -1,80 | ||||
| 2025-07-21 | 13F | Atwater Malick LLC | 97.835 | 3,30 | 2.507 | 3,55 | ||||
| 2025-08-07 | 13F | Sound View Wealth Advisors Group, LLC | 205.621 | 30,66 | 5.269 | 30,98 | ||||
| 2025-08-15 | 13F | Scissortail Wealth Management, LLC | 55.165 | -15,00 | 1.413 | -14,78 | ||||
| 2025-07-21 | 13F | Cliftonlarsonallen Wealth Advisors, Llc | 181.579 | 25,75 | 4.653 | 26,07 | ||||
| 2025-07-30 | 13F | Klingman & Associates, LLC | 11.767 | -16,50 | 302 | -16,39 | ||||
| 2025-07-30 | 13F | Princeton Global Asset Management LLC | 15.700 | 0,00 | 402 | 0,25 | ||||
| 2025-07-30 | 13F | Brookstone Capital Management | 11.068 | 22,22 | 284 | 22,51 | ||||
| 2025-08-12 | 13F | Eldridge Investment Advisors, Inc. | 8.000 | 0,00 | 205 | 0,00 | ||||
| 2025-08-14 | 13F | EP Wealth Advisors, Inc. | 11.490 | 294 | ||||||
| 2025-04-29 | 13F | 4J Wealth Management LLC | 0 | -100,00 | 0 | -100,00 | ||||
| 2025-07-01 | 13F | Confluence Investment Management Llc | 72.848 | -3,47 | 1.867 | -3,22 | ||||
| 2025-07-29 | 13F | Regions Financial Corp | 74.452 | -0,78 | 1.908 | -0,52 | ||||
| 2025-07-25 | 13F | Stephens Consulting, LLC | 313 | 0,00 | 8 | 0,00 | ||||
| 2025-07-11 | 13F | Lantz Financial LLC | 40.469 | 2,63 | 1.037 | 2,88 | ||||
| 2025-07-18 | 13F | Newman Dignan & Sheerar, Inc. | 105.943 | -10,77 | 2.715 | -10,19 | ||||
| 2025-07-23 | 13F | Sax Wealth Advisors, Llc | 15.021 | 385 | ||||||
| 2025-08-12 | 13F | Coldstream Capital Management Inc | 113.042 | 7,43 | 2.896 | 7,70 | ||||
| 2025-04-28 | 13F | Buffington Mohr McNeal | 11.490 | 9,33 | 294 | 9,74 | ||||
| 2025-08-07 | 13F | Addison Advisors LLC | 895 | 23 | ||||||
| 2025-07-30 | 13F | Strategic Blueprint, LLC | 8.381 | 215 | ||||||
| 2025-08-01 | 13F | James Investment Research Inc | 58.755 | 0,00 | 1.505 | 0,27 | ||||
| 2025-07-21 | 13F | Exchange Capital Management, Inc. | 14.899 | -3,25 | 382 | -3,05 | ||||
| 2025-08-07 | 13F | Hughes Financial Services, LLC | 6.686 | 6,26 | 171 | 6,88 | ||||
| 2025-08-01 | 13F | Signature Wealth Management Group | 59.477 | 1,34 | 1.524 | 1,53 | ||||
| 2025-08-11 | 13F | Principal Securities, Inc. | 1.943 | -4,47 | 50 | -3,92 | ||||
| 2025-08-14 | 13F | Financial Engines Advisors L.L.C. | 44.232 | 35,65 | 1.133 | 36,01 | ||||
| 2025-07-29 | 13F | Sigma Investment Counselors Inc | 10.000 | 0,00 | 256 | 0,39 | ||||
| 2025-07-09 | 13F | Lbmc Investment Advisors, Llc | 411.927 | 12,40 | 10.555 | 12,67 | ||||
| 2025-07-30 | 13F | Avidian Wealth Solutions, LLC | 8.554 | 219 | ||||||
| 2025-07-08 | 13F | Parallel Advisors, LLC | 22.690 | 15,90 | 581 | 16,20 | ||||
| 2025-07-25 | 13F | Cwm, Llc | 55.193 | 12,65 | 1 | 0,00 | ||||
| 2025-07-30 | 13F | Sonata Capital Group Inc | 95.287 | 0,00 | 2 | 0,00 | ||||
| 2025-08-12 | 13F | PSI Advisors, LLC | 0 | -100,00 | 0 | |||||
| 2025-07-24 | 13F | Riverchase Wealth Management, Llc | 19.229 | 0,00 | 493 | 0,20 | ||||
| 2025-08-11 | 13F | CFS Investment Advisory Services, LLC | 25.536 | -0,60 | 1 | |||||
| 2025-08-14 | 13F | Godshalk Welsh Capital Management, Inc. | 24.000 | 615 | ||||||
| 2025-07-02 | 13F | Crumly & Associates Inc. | 0 | -100,00 | 0 | |||||
| 2025-08-12 | 13F | Cooper/haims Advisors, Llc | 10.000 | 0,00 | 256 | 0,39 | ||||
| 2025-07-18 | 13F | TPG Advisors LLC | 9.094 | 0,00 | 233 | 0,43 | ||||
| 2025-08-04 | 13F | Assetmark, Inc | 36.944 | 330,08 | 947 | 331,96 | ||||
| 2025-08-14 | 13F | Snowden Capital Advisors LLC | 31.700 | 0,00 | 812 | 0,25 |