Grundlæggende statistik
| Institutionelle aktier (lange) | 158.395.247 - 91,04% (ex 13D/G) - change of -37,30MM shares -19,06% MRQ |
| Institutionel værdi (lang) | $ 1.516.504 USD ($1000) |
Institutionelt ejerskab og aktionærer
Huntsman Corporation (US:HUN) har 354 institutionelle ejere og aktionærer, der har indsendt 13D/G- eller 13F-formularer til Securities Exchange Commission (SEC). Disse institutioner har i alt 158,395,247 aktier. Største aktionærer omfatter BlackRock, Inc., Vanguard Group Inc, Aqr Capital Management Llc, Charles Schwab Investment Management Inc, Invesco Ltd., Dimensional Fund Advisors Lp, Soros Fund Management Llc, Pzena Investment Management Llc, Morgan Stanley, and UBS Group AG .
Huntsman Corporation (NYSE:HUN) institutionel ejerskabsstruktur viser aktuelle positioner i virksomheden efter institutioner og fonde, samt seneste ændringer i positionsstørrelse. Større aktionærer kan omfatte individuelle investorer, investeringsforeninger, hedgefonde eller institutioner. Skema 13D angiver, at investoren besidder (eller besidder) mere end 5 % af virksomheden og har til hensigt (eller har til hensigt at) aktivt at forfølge en ændring i forretningsstrategi. Skema 13G indikerer en passiv investering på over 5%.
The share price as of April 8, 2026 is 13,57 / share. Previously, on April 9, 2025, the share price was 14,26 / share. This represents a decline of 4,84% over that period.

Fondens stemningsscore
Fund Sentiment Score (fka Ownership Accumulation Score) finder de aktier, der bliver mest købt af fonde. Det er resultatet af en sofistikeret, multi-faktor kvantitativ model, der identificerer virksomheder med de højeste niveauer af institutionel akkumulering. Scoringsmodellen bruger en kombination af den samlede stigning i oplyste ejere, ændringerne i porteføljeallokeringer i disse ejere og andre målinger. Tallet går fra 0 til 100, hvor højere tal indikerer et højere niveau af akkumulering for sine jævnaldrende, og 50 er gennemsnittet.
Opdateringsfrekvens: Dagligt
Se Ownership Explorer, som giver en liste over højest rangerende virksomheder.
AI+ Ask Fintel’s AI assistant about Huntsman Corporation.
Select a question to share a public post with an AI-crafted answer.
Thinking of good questions…
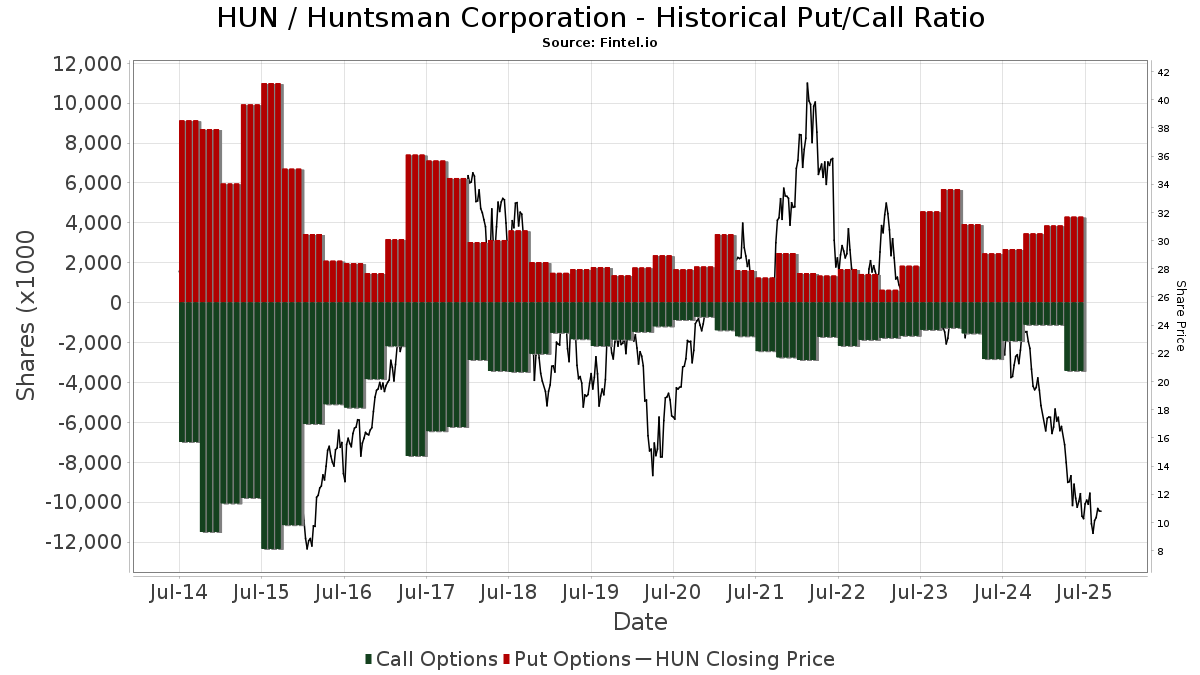
Institutionel Put/Call-forhold
Ud over at indberette standardaktie- og gældsudstedelser skal institutter med mere end 100 mill. aktiver under forvaltning også oplyse deres put- og call-optionsbeholdninger. Da salgsoptioner generelt indikerer negativ stemning, og købsoptioner indikerer positiv stemning, kan vi få en fornemmelse af den overordnede institutionelle stemning ved at plotte forholdet mellem put og kald. Diagrammet til højre viser det historiske put/call-forhold for dette instrument.
Brug af Put/Call Ratio som en indikator for investorernes stemning overvinder en af de vigtigste mangler ved at bruge totalt institutionelt ejerskab, som er, at en betydelig mængde af aktiver under forvaltning investeres passivt for at spore indekser. Passivt forvaltede fonde køber typisk ikke optioner, så indikatoren for put/call-forholdet følger mere nøje følelsen af aktivt forvaltede fonde.
13D/G-arkivering
Vi præsenterer 13D/G ansøgninger separat fra 13F ansøgninger på grund af den forskellige behandling af SEC. 13D/G-ansøgninger kan indgives af grupper af investorer (med én ledende), hvorimod 13F-ansøgninger ikke kan. Dette resulterer i situationer, hvor en investor kan indsende en 13D/G, der rapporterer én værdi for de samlede aktier (der repræsenterer alle de aktier, der ejes af investorgruppen), men derefter indsender en 13F, der rapporterer en anden værdi for de samlede aktier (der udelukkende repræsenterer deres egne) ejendomsret). Det betyder, at aktieejerskab af 13D/G-arkiver og 13F-arkiveringer ofte ikke er direkte sammenlignelige, så vi præsenterer dem separat.
Bemærk: Fra den 16. maj 2021 viser vi ikke længere ejere, der ikke har indsendt en 13D/G inden for det seneste år. Tidligere viste vi den fulde historie af 13D/G-arkiver. Generelt skal enheder, der er forpligtet til at indgive 13D/G-ansøgninger, indgive mindst årligt, før de indsender en afsluttende ansøgning. Dog forlader fonde nogle gange positioner uden at indsende en afsluttende ansøgning (dvs. de afvikler), så visning af den fulde historie resulterede nogle gange i forvirring om det nuværende ejerskab. For at undgå forvirring viser vi nu kun 'aktuelle' ejere - det vil sige - ejere, der har anmeldt inden for det seneste år.
Upgrade to unlock premium data.
| Fil dato | Form | Investor | Forrige Aktier |
Seneste Aktier |
Δ Aktier (Procent) |
Ejendomsret (Procent) |
Δ Ejerskab (Procent) |
|
|---|---|---|---|---|---|---|---|---|
| 2026-03-27 | VANGUARD GROUP INC | 17,880,912 | 0 | -100.00 | 0.00 | -100.00 | ||
| 2026-02-20 | Peter R. Huntsman | 8,905,173 | 5.09 | |||||
| 2025-11-14 | AQR CAPITAL MANAGEMENT LLC | 9,926,971 | 12,062,972 | 21.52 | 6.94 | 21.54 | ||
| 2025-10-09 | DIMENSIONAL FUND ADVISORS LP | 10,214,140 | 7,916,836 | -22.49 | 4.60 | -19.30 | ||
| 2025-04-24 | BlackRock, Inc. | 16,133,924 | 10,653,137 | -33.97 | 6.10 | -34.41 |
13F og NPORT arkivering
Detaljer om 13F-arkivering er gratis. Detaljer om NP-ansøgninger kræver et premium-medlemskab. Grønne rækker angiver nye positioner. Røde rækker angiver lukkede positioner. Klik på linket ikon for at se den fulde transaktionshistorik.
Opgrader
for at låse premium-data op og eksportere til Excel ![]() .
.
| Fil dato | Kilde | Investor | Type | Gennemsnitlig pris (Øst) |
Aktier | Δ Aktier (%) |
Rapporteret Værdi ($1000) |
Δ Værdi (%) |
Port Alloc (%) |
|
|---|---|---|---|---|---|---|---|---|---|---|
| 2026-02-17 | 13F | Engineers Gate Manager LP | 615.505 | 3,74 | 6.155 | 15,54 | ||||
| 2026-02-13 | 13F | Quarry LP | 4.702 | -63,59 | 47 | -59,13 | ||||
| 2026-02-13 | 13F | American Century Companies Inc | 1.513.205 | 48,77 | 15.132 | 65,68 | ||||
| 2026-02-20 | 13F | Sunbelt Securities, Inc. | 132 | 1 | ||||||
| 2026-01-30 | 13F/A | M&t Bank Corp | 38.190 | 40,80 | 382 | 56,79 | ||||
| 2026-02-13 | 13F | Soros Fund Management Llc | Call | 5.900.000 | 59.000 | |||||
| 2026-02-17 | 13F | Caption Management, LLC | Call | 565.000 | 101,79 | 5.650 | 124,74 | |||
| 2026-02-13 | 13F | Soros Fund Management Llc | 38.435 | 384 | ||||||
| 2026-02-13 | 13F | Thomist Capital Management, LP | Call | 0 | -100,00 | 0 | ||||
| 2026-02-13 | 13F | Great West Life Assurance Co /can/ | 45.574 | -14,55 | 0 | |||||
| 2026-02-17 | 13F | Caption Management, LLC | 207.000 | -49,08 | 2.070 | -43,29 | ||||
| 2026-01-26 | 13F | KBC Group NV | 6.899 | 0,00 | 0 | |||||
| 2026-02-05 | 13F | Bessemer Group Inc | 0 | -100,00 | 0 | |||||
| 2026-02-13 | 13F | Colony Group, LLC | 36.280 | -11,66 | 363 | -1,63 | ||||
| 2026-02-06 | 13F | GPS Wealth Strategies Group, LLC | 150 | -75,69 | 2 | -80,00 | ||||
| 2025-11-14 | 13F | Binnacle Investments Inc | 23 | 0 | ||||||
| 2026-02-04 | 13F | Naples Global Advisors, Llc | 57.205 | -6,17 | 572 | 4,57 | ||||
| 2026-02-13 | 13F | Platinum Investment Management Ltd | 6.761 | 68 | ||||||
| 2026-02-10 | 13F | Bank of New York Mellon Corp | 543.045 | -58,83 | 5.430 | -54,16 | ||||
| 2026-01-26 | 13F | Foster Victor Wealth Advisors, LLC | 16.335 | 8,88 | 195 | 39,57 | ||||
| 2026-02-13 | 13F | Marshall Wace, Llp | 711.784 | 7.118 | ||||||
| 2026-02-11 | 13F | Empowered Funds, LLC | 14.413 | 3,98 | 144 | 16,13 | ||||
| 2026-01-30 | 13F | Activest Wealth Management | 5 | 0 | ||||||
| 2026-02-12 | 13F | State Board Of Administration Of Florida Retirement System | 201.980 | 0,00 | 2.020 | 11,36 | ||||
| 2026-01-22 | 13F | Red Tortoise LLC | 251 | 3 | ||||||
| 2026-02-13 | 13F | Sei Investments Co | 157.188 | 165,44 | 1.572 | 195,86 | ||||
| 2026-02-13 | 13F | Arkadios Wealth Advisors | 66.531 | -34,17 | 665 | -26,68 | ||||
| 2026-02-06 | 13F | EverSource Wealth Advisors, LLC | 5.568 | -25,26 | 56 | -16,67 | ||||
| 2026-02-10 | 13F | State of Wyoming | 100.631 | 404,95 | 1.006 | 465,17 | ||||
| 2026-02-17 | 13F | Prelude Capital Management, Llc | 12.833 | -38,37 | 128 | -31,18 | ||||
| 2026-02-13 | 13F | Walleye Trading LLC | Put | 361.200 | 22,48 | 3.612 | 36,40 | |||
| 2026-02-14 | 13F | Rockefeller Capital Management L.P. | 916 | -68,83 | 9 | -65,38 | ||||
| 2026-04-03 | 13F | Investors Research Corp | 63.979 | 0,00 | 852 | 33,18 | ||||
| 2026-02-13 | 13F | Walleye Trading LLC | Call | 33.900 | -72,37 | 339 | -69,21 | |||
| 2026-02-13 | 13F | Parkside Financial Bank & Trust | 6.514 | 1.005,94 | 65 | 1.200,00 | ||||
| 2026-02-13 | 13F | Walleye Trading LLC | 332.078 | 125,57 | 3.321 | 151,32 | ||||
| 2026-02-17 | 13F | Brevan Howard Capital Management LP | 243.988 | 3,86 | 2.440 | 15,65 | ||||
| 2026-02-13 | 13F | Y-Intercept (Hong Kong) Ltd | 0 | -100,00 | 0 | |||||
| 2026-02-17 | 13F | Voleon Capital Management Lp | 92.428 | 924 | ||||||
| 2026-01-28 | 13F | Teacher Retirement System Of Texas | 0 | -100,00 | 0 | |||||
| 2026-02-17 | 13F | Qube Research & Technologies Ltd | 287.265 | -77,55 | 2.873 | -75,01 | ||||
| 2026-02-17 | 13F | Millennium Management Llc | 3.155.872 | -5,67 | 31.559 | 5,05 | ||||
| 2025-10-28 | 13F | Campbell & CO Investment Adviser LLC | 0 | -100,00 | 0 | -100,00 | ||||
| 2026-02-12 | 13F | First Wilshire Securities Management Inc | 0 | -100,00 | 0 | |||||
| 2026-02-13 | 13F | First Trust Advisors Lp | 277.513 | -67,04 | 2.775 | -63,29 | ||||
| 2026-02-17 | 13F | Dv Equities, Llc | 309 | 3 | ||||||
| 2026-02-11 | 13F | Cerity Partners LLC | 78.183 | -74,49 | 782 | -71,61 | ||||
| 2026-02-09 | 13F | Hartland & Co., LLC | 84 | -95,37 | 1 | -100,00 | ||||
| 2026-02-13 | 13F | Recurrent Investment Advisors LLC | 246.276 | 2.463 | ||||||
| 2026-02-11 | 13F | Vise Technologies, Inc. | 18.225 | 182 | ||||||
| 2025-10-22 | 13F | Geneos Wealth Management Inc. | 0 | -100,00 | 0 | -100,00 | ||||
| 2026-02-09 | 13F | Systematic Financial Management Lp | 0 | -100,00 | 0 | |||||
| 2026-02-18 | 13F | GWM Advisors LLC | 26.187 | -86,52 | 262 | -85,03 | ||||
| 2026-01-23 | 13F | Sumitomo Mitsui Trust Holdings, Inc. | 41.523 | -1,15 | 415 | 10,08 | ||||
| 2026-02-17 | 13F | Masters Capital Management Llc | 1.000.000 | 10.000 | ||||||
| 2026-02-17 | 13F | Ilex Capital Partners (UK) LLP | 0 | -100,00 | 0 | |||||
| 2026-01-27 | 13F | Evergreen Capital Management Llc | 13.501 | -84,82 | 135 | -83,08 | ||||
| 2025-11-14 | 13F | Twinbeech Capital Lp | 0 | -100,00 | 0 | |||||
| 2025-11-14 | 13F | Sapience Investments, LLC | 0 | -100,00 | 0 | |||||
| 2026-02-12 | 13F | Skopos Labs, Inc. | 21.170 | 7.100,68 | 215 | 5.275,00 | ||||
| 2026-02-17 | 13F | Mercer Global Advisors Inc /adv | 62.390 | -32,86 | 624 | -25,30 | ||||
| 2025-11-14 | 13F | California Public Employees Retirement System | 0 | -100,00 | 0 | -100,00 | ||||
| 2026-01-21 | 13F | Oak Thistle LLC | 83.775 | -50,36 | 838 | -44,75 | ||||
| 2026-02-19 | 13F | CI Private Wealth, LLC | 53.654 | 537 | ||||||
| 2026-02-13 | 13F | Quinn Opportunity Partners LLC | 15.000 | 150 | ||||||
| 2026-02-13 | 13F | Morgan Stanley | 5.046.274 | 12,17 | 50.463 | 24,92 | ||||
| 2026-01-23 | 13F | Private Wealth Management Group, LLC | 351 | -28,80 | 4 | -25,00 | ||||
| 2026-02-11 | 13F | Hilton Head Capital Partners, LLC | 18 | 0 | ||||||
| 2026-02-12 | 13F | EntryPoint Capital, LLC | 26.305 | 16,53 | 263 | 30,20 | ||||
| 2025-11-14 | 13F | DRW Securities, LLC | 0 | -100,00 | 0 | |||||
| 2026-02-13 | 13F | Dymon Asia Capital (singapore) Pte. Ltd. | 100.100 | 1.001 | ||||||
| 2025-11-14 | 13F | Teza Capital Management LLC | 0 | -100,00 | 0 | -100,00 | ||||
| 2026-02-13 | 13F | Umb Bank N A/mo | 289 | 3 | ||||||
| 2026-02-05 | 13F | Allworth Financial LP | 5.335 | -41,94 | 53 | -35,37 | ||||
| 2026-02-17 | 13F | Ancora Advisors, LLC | 1.795 | 18 | ||||||
| 2026-01-29 | 13F | Vanguard Group Inc | 17.880.912 | 9,31 | 178.809 | 21,73 | ||||
| 2026-02-13 | 13F | Jacobs Levy Equity Management, Inc | 3.134.488 | -17,07 | 31.345 | -7,65 | ||||
| 2026-02-13 | 13F | Bank Of Nova Scotia | 209.000 | 167,95 | 2.090 | 198,57 | ||||
| 2026-02-10 | 13F | Impact Partnership Wealth, LLC | 14.366 | 144 | ||||||
| 2026-02-13 | 13F | Prudential Financial Inc | 0 | -100,00 | 0 | |||||
| 2025-11-06 | 13F | Bryce Point Capital, LLC | 0 | -100,00 | 0 | |||||
| 2026-02-17 | 13F | Alliancebernstein L.p. | 43.899 | -54,41 | 439 | -49,31 | ||||
| 2026-02-13 | 13F | Walleye Capital LLC | 141.643 | -87,22 | 1.416 | -85,77 | ||||
| 2026-02-17 | 13F | Walnut Level Capital LLC | 85.000 | 0,00 | 850 | 11,40 | ||||
| 2026-01-21 | 13F | Steadtrust LLC | 0 | -100,00 | 0 | -100,00 | ||||
| 2026-02-05 | 13F | Amalgamated Bank | 10.002 | 17,24 | 0 | |||||
| 2026-02-17 | 13F | Freestone Grove Partners LP | 0 | -100,00 | 0 | |||||
| 2026-02-17 | 13F | Farringdon Capital, Ltd. | 37.826 | -15,56 | 378 | -5,97 | ||||
| 2026-02-10 | 13F | Collar Capital Management, LLC | 148.203 | -2,85 | 1.482 | 8,25 | ||||
| 2026-02-13 | 13F | Walleye Capital LLC | Call | 103.800 | -74,01 | 1.038 | -71,05 | |||
| 2026-02-13 | 13F | Walleye Capital LLC | Put | 358.700 | 51,86 | 3.587 | 69,12 | |||
| 2026-01-28 | 13F | Arizona State Retirement System | 46.606 | -4,58 | 466 | 6,39 | ||||
| 2026-02-09 | 13F | Fisher Asset Management, LLC | 0 | -100,00 | 0 | |||||
| 2026-02-23 | 13F | Kera Capital Partners, Inc. | 19.976 | -7,86 | 216 | 11,34 | ||||
| 2026-02-12 | 13F | Dimensional Fund Advisors Lp | 5.947.590 | -24,87 | 59.477 | -16,34 | ||||
| 2026-02-12 | 13F | BRYN MAWR TRUST Co | 0 | -100,00 | 0 | -100,00 | ||||
| 2026-04-07 | 13F | CoreCap Advisors, LLC | 63 | 0,00 | 1 | |||||
| 2026-02-12 | 13F | Sit Investment Associates Inc | 0 | -100,00 | 0 | |||||
| 2026-02-12 | 13F | Nuveen, LLC | 212.916 | -56,54 | 2.129 | -51,60 | ||||
| 2026-02-13 | 13F | Seven Six Capital Management, LLC | 0 | -100,00 | 0 | |||||
| 2026-02-10 | 13F | Connor, Clark & Lunn Investment Management Ltd. | 92.027 | 920 | ||||||
| 2026-02-13 | 13F | Smartleaf Asset Management LLC | 6 | -50,00 | 0 | |||||
| 2026-01-29 | 13F | IMC-Chicago, LLC | 123.679 | 122,71 | 1.237 | 148,19 | ||||
| 2026-01-29 | 13F | IMC-Chicago, LLC | Put | 172.700 | 64,79 | 1.727 | 83,53 | |||
| 2026-02-17 | 13F | Two Sigma Advisers, Lp | 1.551.100 | -10,23 | 15.511 | -0,03 | ||||
| 2026-01-29 | 13F | IMC-Chicago, LLC | Call | 89.900 | 20,51 | 899 | 34,38 | |||
| 2026-02-11 | 13F | Los Angeles Capital Management Llc | 909 | 7 | ||||||
| 2026-02-17 | 13F | Hbk Investments L P | Put | 300.000 | 3.000 | |||||
| 2026-02-17 | 13F | Lighthouse Investment Partners, LLC | 272.288 | 2.723 | ||||||
| 2026-02-17 | 13F | Oxford Asset Management Llp | 46.036 | -40,87 | 460 | -43,28 | ||||
| 2025-10-28 | 13F | Arlington Trust Co LLC | 0 | -100,00 | 0 | |||||
| 2026-02-13 | 13F | Kestra Advisory Services, LLC | 2.033 | 20 | ||||||
| 2025-11-07 | 13F | Shell Asset Management Co | 5.667 | -57,16 | 0 | |||||
| 2026-02-13 | 13F | MAI Capital Management | 2.083 | -17,70 | 21 | -9,09 | ||||
| 2026-01-23 | 13F | Halbert Hargrove Global Advisors, Llc | 0 | -100,00 | 0 | |||||
| 2026-02-17 | 13F | Millennium Management Llc | Put | 0 | -100,00 | 0 | ||||
| 2026-02-09 | 13F | Huntington National Bank | 1.653 | -5,87 | 17 | 6,67 | ||||
| 2026-01-20 | 13F | Wall Street Access Asset Management, LLC | 29.013 | 2.013,11 | 290 | 2.316,67 | ||||
| 2026-02-12 | 13F | Counterpoint Mutual Funds LLC | 0 | -100,00 | 0 | |||||
| 2026-02-17 | 13F | Millennium Management Llc | Call | 0 | -100,00 | 0 | ||||
| 2026-02-11 | 13F | Deutsche Bank Ag\ | 19.289 | 32,98 | 193 | 47,69 | ||||
| 2026-02-03 | 13F | Ethic Inc. | 0 | -100,00 | 0 | |||||
| 2026-02-12 | 13F | Hrt Financial Lp | 870.589 | 42,61 | 9 | 60,00 | ||||
| 2026-02-17 | 13F | Ameriprise Financial Inc | 150.770 | 5,63 | 1.508 | 17,64 | ||||
| 2026-02-24 | 13F | Bell Investment Advisors, Inc | 0 | -100,00 | 0 | |||||
| 2026-01-26 | 13F | Whittier Trust Co Of Nevada Inc | 55 | 0,00 | 1 | |||||
| 2026-01-16 | 13F | Ronald Blue Trust, Inc. | 0 | -100,00 | 0 | |||||
| 2026-02-12 | 13F | CIBC Private Wealth Group, LLC | 2.170 | 22 | ||||||
| 2026-02-17 | 13F | Quantinno Capital Management LP | 769.905 | 81,63 | 7.699 | 102,29 | ||||
| 2026-02-13 | 13F | Rhumbline Advisers | 151.760 | -1,03 | 1.518 | 10,25 | ||||
| 2026-02-17 | 13F | Gotham Asset Management, LLC | 1.806.207 | 4.003,15 | 18.062 | 4.472,66 | ||||
| 2026-01-26 | 13F | Cwm, Llc | 113.146 | -66,01 | 1 | -50,00 | ||||
| 2026-01-27 | 13F | Shayne & Co., Llc | 80.941 | -3,99 | 809 | 6,87 | ||||
| 2026-02-03 | 13F | Mitsubishi UFJ Kokusai Asset Management Co., Ltd. | 71.617 | 37,81 | 730 | 56,44 | ||||
| 2025-11-06 | 13F | Assetmark, Inc | 0 | -100,00 | 0 | |||||
| 2025-11-13 | 13F/A | Peak6 Llc | Call | 0 | -100,00 | 0 | -100,00 | |||
| 2026-01-30 | 13F | Citizens National Bank Trust Department | 0 | -100,00 | 0 | |||||
| 2026-02-17 | 13F | Trexquant Investment LP | 1.417.476 | 88,31 | 14.175 | 109,71 | ||||
| 2026-01-29 | 13F | UMA Financial Services, Inc. | 24.406 | 0,34 | 244 | 11,93 | ||||
| 2026-02-13 | 13F | Citigroup Inc | 608.838 | 95,13 | 6.088 | 117,35 | ||||
| 2026-01-23 | 13F | Ogorek Anthony Joseph /ny/ /adv | 54 | -80,00 | 0 | |||||
| 2026-02-13 | 13F | Sterling Capital Management LLC | 9.722 | -4,32 | 97 | 6,59 | ||||
| 2026-02-05 | 13F | High Note Wealth, LLC | 480 | 0,00 | 5 | 0,00 | ||||
| 2026-02-11 | 13F | Syon Capital Llc | 16.127 | 161 | ||||||
| 2026-02-13 | 13F | Toroso Investments, LLC | 98.963 | 111,04 | 990 | 134,92 | ||||
| 2026-02-06 | 13F | IFP Advisors, Inc | 8.094 | 267,91 | 81 | 321,05 | ||||
| 2026-02-17 | 13F | Scientech Research LLC | 17.737 | 177 | ||||||
| 2026-01-30 | 13F | Harbor Advisors LLC | 29.146 | 0,00 | 291 | 11,49 | ||||
| 2026-02-17 | 13F | Quadrature Capital Ltd | 0 | -100,00 | 0 | |||||
| 2026-02-11 | 13F | Buckingham Strategic Partners | 11.154 | -57,80 | 112 | -51,53 | ||||
| 2026-02-05 | 13F | Elyxium Wealth, LLC | 274 | 3 | ||||||
| 2026-02-13 | 13F | Icon Advisers Inc/co | 49.500 | -83,08 | 495 | -81,15 | ||||
| 2026-01-30 | 13F | Torren Management, LLC | 44 | 0 | ||||||
| 2026-02-13 | 13F | Barclays Plc | 2.208.925 | 135,37 | 22.089 | -2,74 | ||||
| 2026-02-13 | 13F | Barclays Plc | Put | 2.320.600 | 41,98 | 23.206 | -41,33 | |||
| 2026-02-10 | 13F | Quantbot Technologies LP | 259.835 | -13,27 | 2.598 | -3,42 | ||||
| 2026-02-17 | 13F | D. E. Shaw & Co., Inc. | Call | 242.400 | 225,37 | 2.424 | 262,33 | |||
| 2026-01-30 | 13F | Interchange Capital Partners, LLC | 12.006 | 120 | ||||||
| 2026-02-17 | 13F | Graham Capital Management, L.P. | 87.090 | -55,80 | 871 | -50,82 | ||||
| 2026-02-17 | 13F | D. E. Shaw & Co., Inc. | 249.507 | -49,11 | 2.495 | -43,32 | ||||
| 2026-01-09 | 13F | SG Americas Securities, LLC | 3.377.627 | 61,90 | 34 | 83,33 | ||||
| 2026-02-17 | 13F | D. E. Shaw & Co., Inc. | Put | 324.700 | 76,56 | 3.247 | 96,67 | |||
| 2026-02-11 | 13F | Fox Run Management, L.l.c. | 85.364 | 854 | ||||||
| 2026-01-29 | 13F | Pictet Asset Management Holding SA | 31.732 | 21,28 | 317 | 35,47 | ||||
| 2026-01-20 | 13F/A | Miller Wealth Advisors, Llc | 4 | 0,00 | 0 | |||||
| 2026-02-11 | 13F | Nikko Asset Management Americas, Inc. | 41.523 | 415 | ||||||
| 2026-01-23 | 13F | Avion Wealth | 50 | -3,85 | 0 | |||||
| 2026-02-13 | 13F | Cullen Capital Management, LLC | 20.231 | 49,35 | 202 | 66,94 | ||||
| 2026-02-17 | 13F | Man Group plc | 879.604 | 1,15 | 8.796 | 12,64 | ||||
| 2026-01-23 | 13F | State of Alaska, Department of Revenue | 9.051 | 4,66 | 0 | |||||
| 2025-11-14 | 13F | Banco Bilbao Vizcaya Argentaria, S.a. | 0 | -100,00 | 0 | |||||
| 2026-01-13 | 13F | Matrix Trust Co | 6.524 | -75,41 | 0 | |||||
| 2026-02-11 | 13F | SOUTH STATE Corp | 75 | 150,00 | 1 | |||||
| 2026-01-27 | 13F | Bayforest Capital Ltd | 29.581 | 354,74 | 296 | 408,62 | ||||
| 2026-02-17 | 13F | Susquehanna International Group, Llp | 573.591 | 91,23 | 5.736 | 112,96 | ||||
| 2026-02-17 | 13F | Susquehanna International Group, Llp | Put | 386.100 | -35,37 | 3.861 | -28,02 | |||
| 2026-02-17 | 13F | Worldquant Millennium Advisors Llc | 126.801 | -30,72 | 1.268 | -22,82 | ||||
| 2025-11-13 | 13F | Fuller & Thaler Asset Management, Inc. | 0 | -100,00 | 0 | -100,00 | ||||
| 2026-02-17 | 13F | Susquehanna International Group, Llp | Call | 552.100 | 22,31 | 5.521 | 36,22 | |||
| 2026-01-12 | 13F | DAVENPORT & Co LLC | 15.375 | 39,14 | 154 | 54,55 | ||||
| 2026-01-21 | 13F | Prime Capital Investment Advisors, LLC | 0 | -100,00 | 0 | |||||
| 2026-01-14 | 13F | Pallas Capital Advisors LLC | 36.543 | 32,31 | 365 | 47,18 | ||||
| 2026-02-17 | 13F | Guggenheim Capital Llc | 43.022 | 2,93 | 430 | 14,67 | ||||
| 2026-01-28 | 13F | Peregrine Capital Management Llc | 0 | -100,00 | 0 | |||||
| 2026-01-30 | 13F | AMG National Trust Bank | 93.805 | -42,28 | 938 | -35,71 | ||||
| 2026-02-02 | 13F | Bay Harbor Wealth Management, LLC | 0 | -100,00 | 0 | |||||
| 2026-02-10 | 13F | Sivia Capital Partners, LLC | 0 | -100,00 | 0 | |||||
| 2025-11-05 | 13F | Envestnet Asset Management Inc | 0 | -100,00 | 0 | |||||
| 2026-02-10 | 13F | Savant Capital, LLC | 0 | -100,00 | 0 | |||||
| 2026-02-17 | 13F | United Capital Financial Advisers, Llc | 0 | -100,00 | 0 | |||||
| 2026-02-17 | 13F | MIRAE ASSET GLOBAL ETFS HOLDINGS Ltd. | 0 | -100,00 | 0 | |||||
| 2026-01-26 | 13F | Private Trust Co Na | 0 | -100,00 | 0 | |||||
| 2026-02-17 | 13F | Hotchkis & Wiley Capital Management Llc | 1.294.140 | 18,38 | 12.941 | 31,82 | ||||
| 2026-02-13 | 13F | BNP Paribas Asset Management Holding S.A. | 2.192 | 47,02 | 0 | |||||
| 2026-01-29 | 13F | Huntleigh Advisors, Inc. | 0 | -100,00 | 0 | |||||
| 2026-02-10 | 13F | Axq Capital, Lp | 61.197 | -62,50 | 612 | -58,29 | ||||
| 2026-02-17 | 13F | Caption Management, LLC | Put | 0 | -100,00 | 0 | ||||
| 2026-02-17 | 13F | Atom Investors LP | 0 | -100,00 | 0 | |||||
| 2026-01-23 | 13F | Deprince Race & Zollo Inc | 0 | -100,00 | 0 | |||||
| 2026-02-13 | 13F | Bridgefront Capital, LLC | 106.580 | 1.066 | ||||||
| 2026-02-17 | 13F | Strive Financial Group ,LLC | 13 | 0 | ||||||
| 2026-02-19 | 13F | Invesco Ltd. | 6.862.912 | 3,00 | 68.629 | 14,70 | ||||
| 2026-02-03 | 13F | Garner Asset Management Corp | 17.168 | 28,01 | 172 | 42,50 | ||||
| 2026-02-13 | 13F | Hudson Bay Capital Management LP | Put | 0 | -100,00 | 0 | ||||
| 2026-02-17 | 13F | Tower Research Capital LLC (TRC) | 9.566 | 202,43 | 96 | 239,29 | ||||
| 2026-01-30 | 13F | Caldwell Securities, Inc | 1.038 | 0,87 | 10 | 11,11 | ||||
| 2026-02-12 | 13F | Federation des caisses Desjardins du Quebec | 0 | -100,00 | 0 | |||||
| 2026-02-13 | 13F | Commerce Bank | 0 | -100,00 | 0 | |||||
| 2026-01-16 | 13F | FNY Investment Advisers, LLC | Call | 27 | 0 | |||||
| 2026-02-13 | 13F | Public Employees Retirement Association Of Colorado | 16.952 | 0,00 | 0 | |||||
| 2025-10-31 | 13F | Poinciana Advisors Group, Llc | 0 | -100,00 | 0 | -100,00 | ||||
| 2026-02-18 | 13F | Mackenzie Financial Corp | 10.639 | 0,00 | 108 | 12,63 | ||||
| 2026-02-13 | 13F | Peak6 Llc | 79.412 | 794 | ||||||
| 2026-02-17 | 13F | Lombard Odier Asset Management (USA) Corp | 15.886 | -69,26 | 159 | -65,95 | ||||
| 2026-02-05 | 13F | Gabelli Funds Llc | 38.000 | -69,37 | 380 | -65,86 | ||||
| 2026-02-17 | 13F | Raymond James Financial Inc | 48.048 | -62,78 | 480 | -58,58 | ||||
| 2026-03-06 | 13F | Hsbc Holdings Plc | 157.782 | 12,33 | 1.589 | 29,00 | ||||
| 2026-02-05 | 13F | HFM Investment Advisors, LLC | 0 | -100,00 | 0 | |||||
| 2026-02-11 | 13F | J.w. Cole Advisors, Inc. | 12.112 | 5,83 | 121 | 18,63 | ||||
| 2026-02-12 | 13F | Caerus Investment Advisors, LLC | 0 | -100,00 | 0 | |||||
| 2026-01-21 | 13F | Albion Financial Group /ut | 35 | 0,00 | 0 | |||||
| 2026-02-17 | 13F | Jones Financial Companies Lllp | 0 | -100,00 | 0 | |||||
| 2026-02-17 | 13F | Amundi | 336.187 | -72,11 | 3.362 | -70,31 | ||||
| 2026-04-07 | 13F | Farther Finance Advisors, LLC | 2.126 | 69,13 | 28 | 125,00 | ||||
| 2026-02-12 | 13F | Ensign Peak Advisors, Inc | 12.588 | -73,82 | 126 | -71,00 | ||||
| 2026-02-17 | 13F | Susquehanna Portfolio Strategies, LLC | 319.694 | 1,14 | 3.197 | 12,61 | ||||
| 2026-02-11 | 13F | Group One Trading, L.p. | Put | 188.800 | -59,60 | 1.888 | -55,00 | |||
| 2026-02-11 | 13F | Group One Trading, L.p. | Call | 213.100 | 90,95 | 2.131 | 112,67 | |||
| 2026-02-11 | 13F | Group One Trading, L.p. | 286.009 | -2,37 | 2.860 | 8,75 | ||||
| 2026-02-17 | 13F | Cambria Investment Management, L.P. | 832.707 | 17,87 | 8.327 | 31,26 | ||||
| 2026-02-23 | 13F | Virtu Financial LLC | 35.143 | 0 | ||||||
| 2025-11-14 | 13F | WealthTrak Capital Management LLC | 0 | -100,00 | 0 | |||||
| 2026-01-26 | 13F | Merit Financial Group, LLC | 23.294 | -36,82 | 233 | -29,91 | ||||
| 2026-03-05 | 13F | Bayban | 68 | 1 | ||||||
| 2026-02-12 | 13F | Wealthspire Advisors, LLC | 0 | -100,00 | 0 | |||||
| 2026-02-11 | 13F | Waddell & Associates, Llc | 0 | -100,00 | 0 | |||||
| 2026-02-17 | 13F | Royal Bank Of Canada | 41.789 | -81,02 | 418 | -78,86 | ||||
| 2026-02-06 | 13F | Larson Financial Group LLC | 2.799 | 19,06 | 28 | 28,57 | ||||
| 2025-11-14 | 13F | Dean Capital Management | 0 | -100,00 | 0 | |||||
| 2025-10-31 | 13F | Towarzystwo Funduszy Inwestycyjnych Allianz Polska S.A. | 0 | -100,00 | 0 | -100,00 | ||||
| 2026-02-13 | 13F | JustInvest LLC | 23.737 | 22,06 | 237 | 36,21 | ||||
| 2026-02-09 | 13F | Geode Capital Management, Llc | 2.724.518 | -18,60 | 27.252 | -9,35 | ||||
| 2026-02-10 | 13F | Daiwa Securities Group Inc. | 13.863 | 8,61 | 0 | |||||
| 2026-02-10 | 13F | Goldman Sachs Group Inc | 845.955 | -26,83 | 8.460 | -18,52 | ||||
| 2026-02-10 | 13F | Norges Bank | 151.699 | 1.517 | ||||||
| 2026-02-17 | 13F | Fmr Llc | 349.544 | 161,99 | 3.495 | 191,74 | ||||
| 2026-02-06 | 13F | Handelsbanken Fonder AB | 35.613 | 0,00 | 0 | |||||
| 2026-02-10 | 13F | Root Financial Partners, LLC | 38 | -71,43 | 0 | -100,00 | ||||
| 2026-02-09 | 13F | Optimize Financial Inc | 26.824 | 1,45 | 268 | 13,08 | ||||
| 2025-11-14 | 13F | Full Sail Capital, LLC | 0 | -100,00 | 0 | -100,00 | ||||
| 2026-02-13 | 13F | Stifel Financial Corp | 1.693.853 | -5,24 | 16.939 | 5,53 | ||||
| 2026-02-11 | 13F | LPL Financial LLC | 119.888 | -17,40 | 1.199 | -8,06 | ||||
| 2025-10-24 | 13F | Hemington Wealth Management | 37 | -19,57 | 0 | |||||
| 2025-11-21 | 13F | Nebula Research & Development LLC | 0 | -100,00 | 0 | |||||
| 2026-01-28 | 13F | Universal- Beteiligungs- und Servicegesellschaft mbH | 14.944 | 0,00 | 149 | 11,19 | ||||
| 2025-10-20 | 13F | OMNI 360 Wealth, Inc. | 0 | -100,00 | 0 | |||||
| 2026-01-23 | 13F | Twelve Points Wealth Management LLC | 82.541 | -51,53 | 967 | -36,76 | ||||
| 2026-02-13 | 13F | Wexford Capital Lp | 9.425 | 94 | ||||||
| 2026-02-04 | 13F | Virginia Retirement Systems Et Al | 35.000 | 350 | ||||||
| 2026-02-02 | 13F | Strs Ohio | 3.936 | 0,15 | 39 | 11,43 | ||||
| 2025-10-30 | 13F | Twin Peaks Wealth Advisors, LLC | 0 | -100,00 | 0 | |||||
| 2026-02-17 | 13F | PDT Partners, LLC | 13.824 | 138 | ||||||
| 2026-02-13 | 13F | Wells Fargo & Company/mn | 165.175 | 128,29 | 1.652 | 154,39 | ||||
| 2026-02-17 | 13F | Dark Forest Capital Management Lp | 118.920 | 349,54 | 1.189 | 401,69 | ||||
| 2026-01-14 | 13F | Spire Wealth Management | 0 | -100,00 | 0 | |||||
| 2026-02-17 | 13F | Capital Fund Management S.a. | Put | 179.900 | -60,43 | 1.799 | -55,93 | |||
| 2026-02-17 | 13F | Capital Fund Management S.a. | Call | 177.300 | -68,07 | 1.773 | -64,43 | |||
| 2026-02-13 | 13F | Entropy Technologies, LP | 13.776 | -52,19 | 138 | -46,90 | ||||
| 2026-02-13 | 13F | Ieq Capital, Llc | 54.766 | -82,40 | 548 | -80,42 | ||||
| 2026-01-16 | 13F | Perigon Wealth Management, LLC | 0 | -100,00 | 0 | |||||
| 2025-11-03 | 13F | SYM FINANCIAL Corp | 0 | -100,00 | 0 | |||||
| 2025-12-09 | 13F/A | Tudor Investment Corp Et Al | Put | 11.700 | -57,14 | 105 | -63,03 | |||
| 2026-02-17 | 13F | Concentric Capital Strategies, LP | Call | 0 | -100,00 | 0 | ||||
| 2026-02-11 | 13F | Jpmorgan Chase & Co | 340.067 | 15,30 | 3.401 | 28,40 | ||||
| 2026-02-03 | 13F | Orion Capital Management LLC | 1.000 | 0,00 | 10 | 25,00 | ||||
| 2025-11-14 | 13F | FIFTHDELTA Ltd | 0 | -100,00 | 0 | |||||
| 2026-02-17 | 13F | Boothbay Fund Management, Llc | 19.797 | -36,33 | 198 | -29,39 | ||||
| 2026-02-13 | 13F | State Street Corp | 3.667.631 | 11,72 | 36.676 | 24,41 | ||||
| 2026-02-12 | 13F | Cibc World Markets Corp | 134.300 | 1.343 | ||||||
| 2025-11-12 | 13F | Royce & Associates Lp | 0 | -100,00 | 0 | -100,00 | ||||
| 2026-02-13 | 13F | Pinnacle Wealth Planning Services, Inc. | 337 | 3 | ||||||
| 2026-01-27 | 13F | Zurcher Kantonalbank (Zurich Cantonalbank) | 66.889 | 0,00 | 669 | 11,33 | ||||
| 2026-02-06 | 13F | Pzena Investment Management Llc | 5.705.178 | 5,77 | 57.052 | 17,79 | ||||
| 2026-02-13 | 13F | Squarepoint Ops LLC | Call | 136.400 | -62,37 | 1.364 | -58,10 | |||
| 2026-01-28 | 13F | Davis Capital Management | 204 | 0,00 | 2 | 100,00 | ||||
| 2026-02-11 | 13F | Parallel Advisors, LLC | 13.084 | -30,40 | 131 | -22,62 | ||||
| 2026-02-13 | 13F | Squarepoint Ops LLC | Put | 71.000 | -56,23 | 710 | -51,24 | |||
| 2025-11-06 | 13F | Whipplewood Advisors, LLC | 0 | -100,00 | 0 | |||||
| 2026-02-13 | 13F | Squarepoint Ops LLC | 1.169.956 | 78,33 | 11.700 | 98,59 | ||||
| 2026-02-17 | 13F | Advisor Group Holdings, Inc. | 2.453 | -49,47 | 25 | -48,94 | ||||
| 2026-02-17 | 13F | Summit Trail Advisors, Llc | 99.619 | 3,17 | 996 | 14,88 | ||||
| 2026-02-13 | 13F | Caxton Associates Llp | 63.944 | -29,18 | 639 | -21,11 | ||||
| 2026-01-30 | 13F | Us Bancorp \de\ | 21.013 | 25,12 | 210 | 40,00 | ||||
| 2026-02-12 | 13F | Regents Gate Capital LLP | 0 | -100,00 | 0 | |||||
| 2026-02-11 | 13F | CoreFirst Bank & Trust | 1.029 | 0,00 | 10 | 11,11 | ||||
| 2025-11-06 | 13F | Ing Groep Nv | 0 | -100,00 | 0 | -100,00 | ||||
| 2026-02-11 | 13F | Allianz Asset Management GmbH | 1.289.722 | 35,46 | 12.897 | 50,86 | ||||
| 2026-02-13 | 13F | Police & Firemen's Retirement System of New Jersey | 69.062 | 0,00 | 691 | 11,29 | ||||
| 2025-11-14 | 13F | Concentric Capital Strategies, LP | 0 | -100,00 | 0 | -100,00 | ||||
| 2026-02-05 | 13F | Mesirow Financial Investment Management, Inc. | 0 | -100,00 | 0 | |||||
| 2026-01-13 | 13F | Norden Group Llc | 14.353 | 144 | ||||||
| 2026-02-02 | 13F | Fifth Third Bancorp | 10.010 | 0,00 | 100 | 12,36 | ||||
| 2026-01-07 | 13F | Massmutual Trust Co Fsb/adv | 306 | -57,50 | 3 | -50,00 | ||||
| 2026-02-17 | 13F | Mirabella Financial Services Llp | 37.917 | 176,75 | 379 | 208,13 | ||||
| 2025-11-12 | 13F | Bare Financial Services, Inc | 0 | -100,00 | 0 | |||||
| 2026-02-06 | 13F | Covestor Ltd | 908 | -0,11 | 0 | |||||
| 2026-02-12 | 13F | Brown Brothers Harriman & Co | 1.425 | 0,00 | 14 | 16,67 | ||||
| 2026-02-13 | 13F | Verition Fund Management LLC | 264.315 | -24,21 | 2.643 | -15,59 | ||||
| 2026-01-22 | 13F | Financial Consulate, Inc | 42 | 0,00 | 0 | |||||
| 2026-02-10 | 13F | Acadian Asset Management Llc | 524.685 | 132,11 | 5 | 150,00 | ||||
| 2026-02-23 | 13F | Mv Capital Management, Inc. | 408 | 973,68 | 4 | |||||
| 2026-02-10 | 13F | Bnp Paribas Arbitrage, Sa | 1.182.590 | 236,19 | 11.826 | 274,45 | ||||
| 2026-02-17 | 13F | Aquatic Capital Management LLC | 154.501 | -70,16 | 1.545 | -66,76 | ||||
| 2026-02-17 | 13F | Evolve Private Wealth, Llc | 13.316 | 133 | ||||||
| 2025-11-12 | 13F | Legato Capital Management LLC | 0 | -100,00 | 0 | -100,00 | ||||
| 2026-02-13 | 13F | Manufacturers Life Insurance Company, The | 0 | -100,00 | 0 | |||||
| 2026-02-09 | 13F | Quest Partners LLC | 70.961 | -22,08 | 710 | -13,22 | ||||
| 2026-01-15 | 13F | Fortitude Family Office, LLC | 0 | -100,00 | 0 | |||||
| 2026-02-10 | 13F | DT Investment Partners, LLC | 200 | 0,00 | 2 | 100,00 | ||||
| 2026-02-10 | 13F | Machina Capital S.a.s. | 12.138 | 121 | ||||||
| 2026-03-30 | 13F/A | Barclays Plc | Call | 0 | -100,00 | 0 | ||||
| 2026-02-17 | 13F | Creative Planning | 190.115 | -1,90 | 1.901 | 9,25 | ||||
| 2026-02-03 | 13F | McIlrath & Eck, LLC | 489 | 0,00 | 5 | 0,00 | ||||
| 2026-02-13 | 13F | Transamerica Financial Advisors, Inc. | 51 | 1 | ||||||
| 2025-11-10 | 13F | New Millennium Group LLC | 0 | -100,00 | 0 | |||||
| 2026-02-17 | 13F | Odyssean, LLC | 25.492 | 255 | ||||||
| 2026-02-11 | 13F | Zions Bancorporation, National Association /ut/ | 3.368 | 0,00 | 34 | 10,00 | ||||
| 2026-02-10 | 13F | Rothschild Investment Llc | 844 | -91,46 | 8 | -90,91 | ||||
| 2025-11-14 | 13F | Point72 Hong Kong Ltd | 117.077 | 1.051 | ||||||
| 2026-02-17 | 13F | Holocene Advisors, LP | 341.663 | -24,10 | 3.417 | -15,49 | ||||
| 2026-02-12 | 13F | Renaissance Technologies Llc | 1.271.800 | -6,70 | 12.718 | 3,90 | ||||
| 2026-02-17 | 13F | Tudor Investment Corp Et Al | 970.857 | 49,20 | 9.709 | 66,15 | ||||
| 2026-01-26 | 13F | Old Point Trust & Financial Services N A | 0 | -100,00 | 0 | |||||
| 2026-02-17 | 13F | Tudor Investment Corp Et Al | Call | 232.900 | 1.278,11 | 2.329 | 1.442,38 | |||
| 2026-01-28 | 13F | HB Wealth Management, LLC | 10.713 | 3,51 | 107 | 16,30 | ||||
| 2026-02-12 | 13F | Principal Securities, Inc. | 0 | -100,00 | 0 | -100,00 | ||||
| 2026-02-12 | 13F | Scotia Capital Inc. | 23.500 | 0,00 | 235 | 11,37 | ||||
| 2026-02-17 | 13F | Aster Capital Management (DIFC) Ltd | 0 | -100,00 | 0 | |||||
| 2026-02-17 | 13F | Northern Trust Corp | 1.018.651 | 0,69 | 10.187 | 12,13 | ||||
| 2026-02-17 | 13F | CWM Advisors, LLC | 11.515 | 115 | ||||||
| 2026-02-11 | 13F | Inceptionr Llc | 15.591 | -76,83 | 156 | -74,34 | ||||
| 2026-02-11 | 13F | Simplex Trading, Llc | 77.623 | 46,63 | 776 | |||||
| 2026-02-12 | 13F | Wedbush Securities Inc | 0 | -100,00 | 0 | |||||
| 2026-02-11 | 13F | Simplex Trading, Llc | Call | 192.800 | 12,03 | 1.928 | 192.700,00 | |||
| 2026-01-15 | 13F | Nisa Investment Advisors, Llc | 53.215 | -26,33 | 532 | -17,90 | ||||
| 2026-02-11 | 13F | Simplex Trading, Llc | Put | 81.500 | -54,26 | 815 | 81.400,00 | |||
| 2026-02-12 | 13F | Brinker Capital Investments, LLC | 0 | -100,00 | 0 | |||||
| 2026-01-21 | 13F | SJS Investment Consulting Inc. | 3.976 | 9,74 | 40 | 21,88 | ||||
| 2026-02-13 | 13F | Landscape Capital Management, L.l.c. | 12.799 | -66,37 | 128 | -62,76 | ||||
| 2026-01-27 | 13F | Brighton Jones Llc | 0 | -100,00 | 0 | |||||
| 2026-02-13 | 13F | Charles Schwab Investment Management Inc | 6.969.687 | 5,08 | 69.697 | 17,02 | ||||
| 2026-02-17 | 13F | Jump Financial, LLC | 55.700 | -95,55 | 557 | -95,04 | ||||
| 2026-02-17 | 13F | Point72 Asset Management, L.P. | 1.777.252 | 342,48 | 17.773 | 392,85 | ||||
| 2026-02-17 | 13F | Point72 Asset Management, L.P. | Put | 218.900 | 2.189 | |||||
| 2026-02-17 | 13F | Point72 Asset Management, L.P. | Call | 174.700 | 1.747 | |||||
| 2026-02-12 | 13F | Quadrant Capital Group Llc | 980 | 49,85 | 10 | 80,00 | ||||
| 2026-02-17 | 13F | Aqr Capital Management Llc | 11.404.040 | -5,46 | 114.040 | 6,70 | ||||
| 2026-01-21 | 13F | Newbridge Financial Services Group, Inc. | 500 | 0,00 | 5 | 25,00 | ||||
| 2026-01-30 | 13F | Mitsubishi UFJ Trust & Banking Corp | 142.050 | 53,35 | 1.420 | 70,88 | ||||
| 2026-02-13 | 13F | Edgestream Partners, L.P. | 68.807 | 688 | ||||||
| 2026-02-24 | 13F | DGS Capital Management, LLC | 13.984 | 140 | ||||||
| 2026-01-29 | 13F | Dunhill Financial, LLC | 3 | 0 | ||||||
| 2026-02-17 | 13F | Greenland Capital Management LP | Put | 0 | -100,00 | 0 | -100,00 | |||
| 2025-11-14 | 13F | Point72 (DIFC) Ltd | 80.409 | 722 | ||||||
| 2026-02-10 | 13F | Bruce G. Allen Investments, LLC | 131 | -34,83 | 1 | 0,00 | ||||
| 2026-02-12 | 13F | New York State Common Retirement Fund | 97.641 | -76,27 | 976 | -73,58 | ||||
| 2026-02-13 | 13F | Impala Asset Management LLC | 537.000 | -68,98 | 5.370 | -65,45 | ||||
| 2026-02-02 | 13F | Danske Bank A/s | 700 | 0,00 | 7 | 16,67 | ||||
| 2025-11-13 | 13F | Diametric Capital, LP | 0 | -100,00 | 0 | |||||
| 2026-02-11 | 13F | Manchester Capital Management LLC | 904 | 9 | ||||||
| 2026-02-12 | 13F | BlackRock, Inc. | 18.045.015 | -1,81 | 180.450 | 9,35 | ||||
| 2026-01-26 | 13F | Mirae Asset Global Investments Co., Ltd. | 147.657 | -3,06 | 1.477 | 7,97 | ||||
| 2026-02-02 | 13F | Oppenheimer & Co Inc | 44.574 | 2,83 | 446 | 14,40 | ||||
| 2026-02-13 | 13F | Arrowstreet Capital, Limited Partnership | 478.050 | 4.780 | ||||||
| 2026-02-17 | 13F | Two Sigma Investments, Lp | 1.673.316 | -41,11 | 16.733 | -34,42 | ||||
| 2026-02-12 | 13F | Advisors Asset Management, Inc. | 716.084 | -1,59 | 7.161 | 9,58 | ||||
| 2026-02-17 | 13F | Susquehanna Fundamental Investments, Llc | 28.445 | -85,05 | 284 | -83,37 | ||||
| 2026-01-29 | 13F | UBS Group AG | 3.797.674 | -48,43 | 37.977 | -42,57 | ||||
| 2026-01-16 | 13F | Linden Thomas Advisory Services, LLC | 21.147 | -4,36 | 211 | 6,57 | ||||
| 2026-02-17 | 13F | Forest Hill Capital, LLC | 286.000 | -4,03 | 2.860 | 6,88 | ||||
| 2026-02-17 | 13F | Magnetar Financial LLC | 0 | -100,00 | 0 | |||||
| 2026-02-02 | 13F | Cornerstone Planning Group LLC | 95 | 1 | ||||||
| 2026-02-17 | 13F | Janus Henderson Group Plc | 78.929 | 0,00 | 790 | 11,44 | ||||
| 2025-11-13 | 13F | FORA Capital, LLC | 0 | -100,00 | 0 | |||||
| 2025-11-14 | 13F | Polymer Capital Management (US) LLC | 0 | -100,00 | 0 | |||||
| 2026-04-07 | 13F | Signaturefd, Llc | 10.709 | 0,27 | 143 | 33,96 | ||||
| 2026-02-17 | 13F | XTX Topco Ltd | 85.247 | 852 | ||||||
| 2026-02-17 | 13F | Citadel Advisors Llc | 639.073 | -43,59 | 6.391 | -37,19 | ||||
| 2026-01-21 | 13F | Capital Advisors, Ltd. LLC | 1.613 | 25,23 | 0 | |||||
| 2026-02-17 | 13F | Citadel Advisors Llc | Call | 407.400 | 141,21 | 4.074 | 168,73 | |||
| 2026-02-13 | 13F | Integrated Wealth Concepts LLC | 0 | -100,00 | 0 | |||||
| 2026-02-17 | 13F | Citadel Advisors Llc | Put | 649.500 | -8,30 | 6.495 | 2,12 | |||
| 2026-02-02 | 13F | Sachetta, LLC | 106 | -61,59 | 1 | -50,00 | ||||
| 2026-02-09 | 13F | Legal & General Group Plc | 287.219 | 8,64 | 2.872 | 20,98 | ||||
| 2026-02-17 | 13F | SummitTX Capital, L.P. | 0 | -100,00 | 0 | |||||
| 2026-02-13 | 13F | National Bank Of Canada /fi/ | 244 | -56,51 | 2 | -60,00 | ||||
| 2026-02-10 | 13F/A | Northwestern Mutual Wealth Management Co | 634 | -68,35 | 6 | -64,71 | ||||
| 2026-02-12 | 13F | Jane Street Group, Llc | 282.819 | -79,93 | 2.828 | -77,65 | ||||
| 2026-02-11 | 13F | O'shaughnessy Asset Management, Llc | 22.430 | 53,82 | 224 | 72,31 | ||||
| 2026-02-12 | 13F | Jane Street Group, Llc | Put | 357.000 | -50,57 | 3.570 | -44,95 | |||
| 2026-02-17 | 13F | Balyasny Asset Management Llc | 121.371 | 1.214 | ||||||
| 2025-11-14 | 13F | Dean Investment Associates, Llc | 0 | -100,00 | 0 | |||||
| 2026-01-28 | 13F | Klp Kapitalforvaltning As | 35.200 | -8,09 | 352 | 2,62 | ||||
| 2026-02-03 | 13F | Strengthening Families & Communities, LLC | 0 | -100,00 | 0 | |||||
| 2025-11-14 | 13F | ExodusPoint Capital Management, LP | 0 | -100,00 | 0 | -100,00 | ||||
| 2026-02-11 | 13F | Meeder Advisory Services, Inc. | 0 | -100,00 | 0 | -100,00 | ||||
| 2026-02-17 | 13F | Bayesian Capital Management, LP | 11.300 | 113 | ||||||
| 2026-01-27 | 13F | TD Waterhouse Canada Inc. | 11 | -21,43 | 0 | |||||
| 2026-01-29 | 13F | Sanctuary Advisors, LLC | 11.005 | 3,65 | 110 | 15,79 | ||||
| 2026-02-11 | 13F | Prestige Wealth Management Group LLC | 90 | 0,00 | 1 | |||||
| 2026-02-17 | 13F | Price T Rowe Associates Inc /md/ | 124.541 | -23,39 | 1 | 0,00 | ||||
| 2026-02-03 | 13F | Sequoia Financial Advisors, LLC | 38.156 | 73,22 | 382 | 93,40 | ||||
| 2026-02-10 | 13F | Nomura Asset Management Co Ltd | 4.000 | 0,00 | 40 | 14,29 | ||||
| 2025-10-21 | 13F | Radnor Capital Management, LLC | 0 | -100,00 | 0 | |||||
| 2026-02-06 | 13F | Global Retirement Partners, LLC | 237 | 2 | ||||||
| 2025-10-22 | 13F | Byrne Asset Management LLC | 0 | -100,00 | 0 | |||||
| 2026-02-12 | 13F | Voya Investment Management Llc | 93.557 | 17,84 | 936 | 31,32 | ||||
| 2026-02-17 | 13F | Canada Pension Plan Investment Board | 379.900 | 21,34 | 3.799 | 35,15 | ||||
| 2026-02-17 | 13F | Wellington Management Group Llp | 616.700 | -0,67 | 6.167 | 10,62 | ||||
| 2026-02-05 | 13F | Thrivent Financial For Lutherans | 121.198 | 126,43 | 1 | |||||
| 2026-02-13 | 13F | Caitong International Asset Management Co., Ltd | 0 | -100,00 | 0 | |||||
| 2026-02-17 | 13F | State Of Wisconsin Investment Board | 91.638 | 413,41 | 916 | 472,50 | ||||
| 2026-02-05 | 13F | Gamco Investors, Inc. Et Al | 323.500 | 10,22 | 3.235 | 22,77 | ||||
| 2026-02-11 | 13F | Strategic Advocates LLC | 3.000 | 0,00 | 31 | 15,38 | ||||
| 2026-02-13 | 13F | Ubs Asset Management Americas Inc | 477.566 | 0,29 | 4.776 | 11,67 | ||||
| 2026-02-17 | 13F/A | Sentinus, LLC | 10.261 | 103 | ||||||
| 2026-02-09 | 13F | Harbour Investments, Inc. | 189 | 0,00 | 2 | 0,00 | ||||
| 2026-01-08 | 13F | True Wealth Design, LLC | 742 | -72,99 | 7 | -70,83 | ||||
| 2026-02-06 | 13F | Gsa Capital Partners Llp | 79.925 | -13,29 | 1 | |||||
| 2026-01-28 | 13F | WPG Advisers, LLC | 29 | 0,00 | 0 | |||||
| 2026-02-12 | 13F | Jane Street Group, Llc | Call | 154.300 | -3,98 | 1.543 | 6,93 | |||
| 2026-02-13 | 13F | Solstein Capital, LLC | 168 | 0,00 | 2 | 0,00 | ||||
| 2026-02-17 | 13F | Voloridge Investment Management, Llc | 2.128.020 | 194,26 | 21.280 | 227,69 | ||||
| 2026-02-17 | 13F | Bank Of America Corp /de/ | 1.357.210 | 16,09 | 13.572 | 29,28 | ||||
| 2026-02-17 | 13F | Mpwm Advisory Solutions, Llc | 2.000 | 20 | ||||||
| 2026-01-15 | 13F | Frank, Rimerman Advisors LLC | 0 | -100,00 | 0 | -100,00 | ||||
| 2025-11-14 | 13F | Cubist Systematic Strategies, LLC | Put | 35.300 | 317 | |||||
| 2026-02-17 | 13F | Schonfeld Strategic Advisors LLC | 268.843 | -52,43 | 2.688 | -47,03 | ||||
| 2026-01-27 | 13F | Optas, LLC | 13.368 | 134 | ||||||
| 2025-11-14 | 13F | Cubist Systematic Strategies, LLC | Call | 70.500 | 633 | |||||
| 2026-01-09 | 13F | Diversified Trust Co | 56.683 | 567 | ||||||
| 2025-11-14 | 13F | Cubist Systematic Strategies, LLC | 1.620.448 | 14.552 | ||||||
| 2026-02-13 | 13F | Kennondale Capital Management LLC | 27.810 | 0,00 | 278 | 11,65 | ||||
| 2026-02-06 | 13F | Pnc Financial Services Group, Inc. | 12.252 | -7,75 | 123 | 2,52 | ||||
| 2026-02-13 | 13F | SRS Capital Advisors, Inc. | 19.019 | -94,22 | 190 | -93,57 | ||||
| 2025-11-14 | 13F | Woodline Partners LP | 0 | -100,00 | 0 | |||||
| 2026-01-21 | 13F | Franklin Street Advisors Inc /nc | 62.500 | 0,00 | 625 | 11,41 | ||||
| 2026-02-03 | 13F | SBI Securities Co., Ltd. | 776 | -5,60 | 8 | 0,00 | ||||
| 2026-02-17 | 13F | Aventail Capital Group, LP | 184.899 | -17,58 | 1.849 | -8,24 | ||||
| 2026-02-17 | 13F | Public Employees Retirement System Of Ohio | 49.463 | -21,05 | 495 | -12,10 | ||||
| 2026-02-13 | 13F | Panagora Asset Management Inc | 13.988 | 0,18 | 140 | 11,20 | ||||
| 2026-02-12 | 13F | Swiss National Bank | 325.474 | 1,72 | 3.255 | 13,26 | ||||
| 2026-01-28 | 13F | Chicago Partners Investment Group LLC | 11.293 | 134 | ||||||
| 2026-02-17 | 13F | Perbak Capital Partners LLP | 41.946 | -69,41 | 419 | -65,96 | ||||
| 2026-02-17 | 13F | Petrus Trust Company, LTA | 0 | -100,00 | 0 | |||||
| 2026-04-06 | 13F | Versant Capital Management, Inc | 1.002 | 32,89 | 13 | 85,71 | ||||
| 2025-11-14 | 13F | Sig Brokerage, Lp | Call | 0 | -100,00 | 0 | ||||
| 2026-02-13 | 13F | Inspire Advisors, LLC | 29.886 | -89,34 | 299 | -88,16 | ||||
| 2026-01-16 | 13F | DiNuzzo Private Wealth, Inc. | 0 | -100,00 | 0 | |||||
| 2026-02-04 | 13F | Ameritas Advisory Services, LLC | 0 | -100,00 | 0 | |||||
| 2026-02-11 | 13F | Deseret Mutual Benefit Administrators | 1.641 | 0,00 | 16 | 14,29 | ||||
| 2026-02-13 | 13F | Victory Capital Management Inc | 18.856 | -0,01 | 189 | 11,24 | ||||
| 2026-04-08 | 13F | Wealth Enhancement Advisory Services, Llc | 85.307 | 28,01 | 951 | 30,63 | ||||
| 2026-02-17 | 13F | Sherbrooke Park Advisers Llc | 0 | -100,00 | 0 | |||||
| 2025-11-14 | 13F | Mount Yale Investment Advisors, LLC | 0 | -100,00 | 0 | -100,00 | ||||
| 2026-02-17 | 13F | Advisory Services Network, LLC | 0 | -100,00 | 0 | |||||
| 2026-02-17 | 13F/A | RBF Capital, LLC | 20.000 | 200 | ||||||
| 2026-02-17 | 13F | Russell Investments Group, Ltd. | 1.779.307 | 17,95 | 17.796 | 31,37 | ||||
| 2025-11-07 | 13F | State of New Jersey Common Pension Fund D | 0 | -100,00 | 0 | -100,00 | ||||
| 2026-01-29 | 13F | Comerica Bank | 1.455 | -45,16 | 15 | -39,13 | ||||
| 2026-02-17 | 13F | Capital Fund Management S.a. | 165.644 | 1.656 | ||||||
| 2026-02-13 | 13F | Macquarie Group Ltd | 0 | -100,00 | 0 | |||||
| 2026-02-17 | 13F | Select Equity Group, L.P. | 772.685 | 7.727 | ||||||
| 2026-04-06 | 13F | GAMMA Investing LLC | 10.874 | 23,01 | 145 | 63,64 | ||||
| 2026-02-12 | 13F | Bank Of Montreal /can/ | 18.144 | -30,39 | 181 | -22,65 | ||||
| 2025-11-14 | 13F | Wolverine Trading, Llc | 31.557 | 280 | ||||||
| 2025-11-14 | 13F | Wolverine Trading, Llc | Call | 81.100 | -6,35 | 719 | -21,33 | |||
| 2025-11-14 | 13F | Wolverine Trading, Llc | Put | 61.400 | 106,04 | 545 | 73,25 | |||
| 2026-02-17 | 13F | Sender Co & Partners, Inc. | Call | 17.300 | 173 | |||||
| 2026-02-13 | 13F | Mariner, LLC | 125.444 | -11,24 | 1.257 | -1,02 | ||||
| 2025-11-14 | 13F | Lazard Asset Management Llc | 0 | -100,00 | 0 | |||||
| 2026-02-12 | 13F | MetLife Investment Management, LLC | 2.690 | -1,82 | 27 | 8,33 | ||||
| 2026-02-17 | 13F | Occudo Quantitative Strategies Lp | 25.044 | -65,05 | 250 | -61,12 | ||||
| 2026-02-09 | 13F | CBIZ Investment Advisory Services, LLC | 137 | 1 | ||||||
| 2026-02-11 | 13F | Jpmorgan Chase & Co | Put | 100.000 | 264,96 | 1.000 | 306,50 | |||
| 2026-02-12 | 13F | Steward Partners Investment Advisory, Llc | 208 | 19,54 | 2 | 100,00 | ||||
| 2026-02-02 | 13F | Montag A & Associates Inc | 0 | -100,00 | 0 | |||||
| 2026-02-17 | 13F | Algert Global Llc | 865.293 | 13,47 | 9 | 33,33 | ||||
| 2026-02-13 | 13F | Boston Partners | 194.072 | 146,52 | 1.941 | 174,79 | ||||
| 2026-01-29 | 13F | Quent Capital, LLC | 3.284 | 236,13 | 33 | 300,00 | ||||
| 2025-11-14 | 13F | Capstone Investment Advisors, Llc | 190.171 | 1.708 | ||||||
| 2026-02-09 | 13F | MQS Management LLC | 0 | -100,00 | 0 | |||||
| 2026-04-08 | 13F | NorthCrest Asset Manangement, LLC | 11.637 | 150 | ||||||
| 2026-01-22 | 13F | Bear Mountain Capital, Inc. | 0 | -100,00 | 0 | |||||
| 2026-02-17 | 13F | Captrust Financial Advisors | 34.317 | -41,42 | 343 | -34,79 | ||||
| 2026-01-09 | 13F | Zrc Wealth Management, Llc | 136 | 1 | ||||||
| 2025-11-14 | 13F | Point72 Europe (London) LLP | 18.130 | 163 | ||||||
| 2026-01-21 | 13F | Yousif Capital Management, Llc | 13.176 | 2,35 | 149 | 28,70 | ||||
| 2026-02-13 | 13F | Treasurer of the State of North Carolina | 68.856 | -6,81 | 1 | |||||
| 2026-02-05 | 13F | Mission Wealth Management, Lp | 11.673 | 117 | ||||||
| 2026-02-17 | 13F | California State Teachers Retirement System | 158.411 | 4,23 | 1.584 | 16,13 | ||||
| 2026-02-13 | 13F | Healthcare Of Ontario Pension Plan Trust Fund | 244.400 | 2.444 | ||||||
| 2026-02-13 | 13F | Ingalls & Snyder Llc | Call | 12.000 | 0,00 | 0 | ||||
| 2026-02-13 | 13F | Ingalls & Snyder Llc | 259.862 | 71,26 | 3 | 100,00 | ||||
| 2026-02-11 | 13F | Franklin Resources Inc | 190.917 | -55,58 | 1.909 | -50,54 | ||||
| 2025-11-06 | 13F | CAPROCK Group, Inc. | 0 | -100,00 | 0 | -100,00 |
Other Listings
| DE:HTR | 11,53 € |