Grundlæggende statistik
| Institutionelle ejere | 69 total, 62 long only, 2 short only, 5 long/short - change of 2,90% MRQ |
| Gennemsnitlig porteføljeallokering | 0.0841 % - change of -14,21% MRQ |
| Institutionelle aktier (lange) | 3.786.724 (ex 13D/G) - change of 0,31MM shares 8,92% MRQ |
| Institutionel værdi (lang) | $ 23.833 USD ($1000) |
Institutionelt ejerskab og aktionærer
Horizon Technology Finance Corporation (US:HRZN) har 69 institutionelle ejere og aktionærer, der har indsendt 13D/G- eller 13F-formularer til Securities Exchange Commission (SEC). Disse institutioner har i alt 3,786,724 aktier. Største aktionærer omfatter Green Alpha Advisors, LLC, Two Sigma Investments, Lp, Eagle Point Credit Management LLC, Legal & General Group Plc, BlackRock, Inc., Marshall Wace, Llp, Virtus Investment Advisers, Inc., Jane Street Group, Llc, Morgan Stanley, and First Financial Bank - Trust Division .
Horizon Technology Finance Corporation (NasdaqGS:HRZN) institutionel ejerskabsstruktur viser aktuelle positioner i virksomheden efter institutioner og fonde, samt seneste ændringer i positionsstørrelse. Større aktionærer kan omfatte individuelle investorer, investeringsforeninger, hedgefonde eller institutioner. Skema 13D angiver, at investoren besidder (eller besidder) mere end 5 % af virksomheden og har til hensigt (eller har til hensigt at) aktivt at forfølge en ændring i forretningsstrategi. Skema 13G indikerer en passiv investering på over 5%.
The share price as of April 2, 2026 is 4,28 / share. Previously, on April 4, 2025, the share price was 8,50 / share. This represents a decline of 49,65% over that period.

Fondens stemningsscore
Fund Sentiment Score (fka Ownership Accumulation Score) finder de aktier, der bliver mest købt af fonde. Det er resultatet af en sofistikeret, multi-faktor kvantitativ model, der identificerer virksomheder med de højeste niveauer af institutionel akkumulering. Scoringsmodellen bruger en kombination af den samlede stigning i oplyste ejere, ændringerne i porteføljeallokeringer i disse ejere og andre målinger. Tallet går fra 0 til 100, hvor højere tal indikerer et højere niveau af akkumulering for sine jævnaldrende, og 50 er gennemsnittet.
Opdateringsfrekvens: Dagligt
Se Ownership Explorer, som giver en liste over højest rangerende virksomheder.
AI+ Ask Fintel’s AI assistant about Horizon Technology Finance Corporation.
Select a question to share a public post with an AI-crafted answer.
Thinking of good questions…
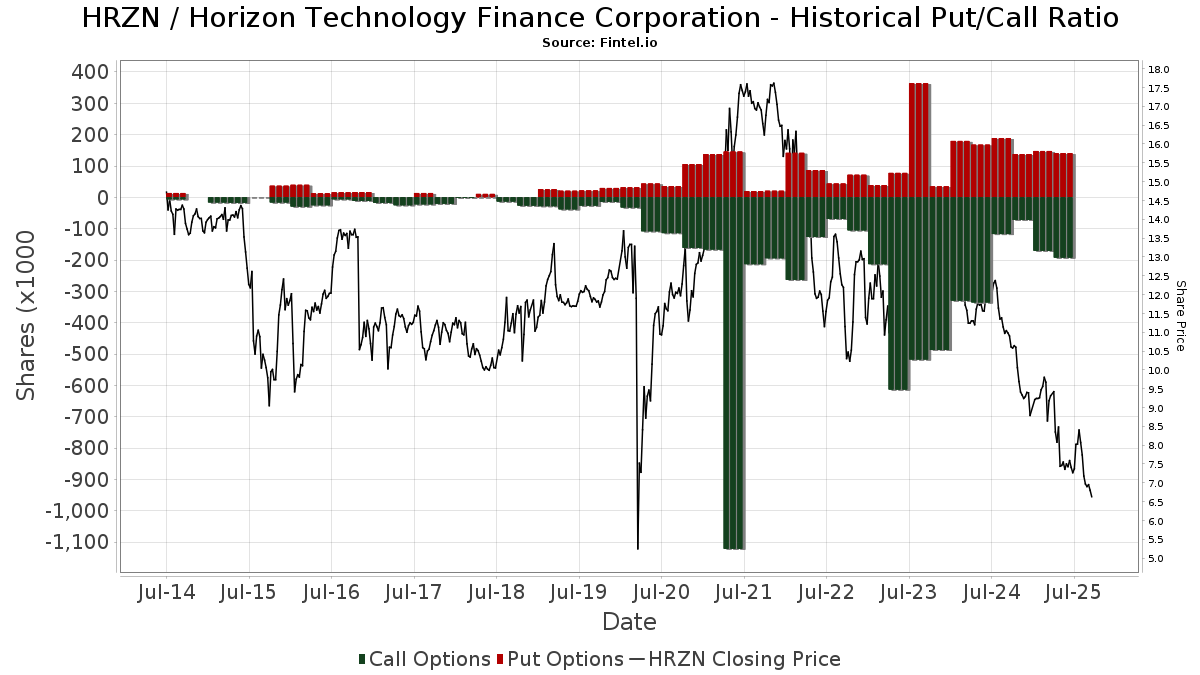
Institutionel Put/Call-forhold
Ud over at indberette standardaktie- og gældsudstedelser skal institutter med mere end 100 mill. aktiver under forvaltning også oplyse deres put- og call-optionsbeholdninger. Da salgsoptioner generelt indikerer negativ stemning, og købsoptioner indikerer positiv stemning, kan vi få en fornemmelse af den overordnede institutionelle stemning ved at plotte forholdet mellem put og kald. Diagrammet til højre viser det historiske put/call-forhold for dette instrument.
Brug af Put/Call Ratio som en indikator for investorernes stemning overvinder en af de vigtigste mangler ved at bruge totalt institutionelt ejerskab, som er, at en betydelig mængde af aktiver under forvaltning investeres passivt for at spore indekser. Passivt forvaltede fonde køber typisk ikke optioner, så indikatoren for put/call-forholdet følger mere nøje følelsen af aktivt forvaltede fonde.
13F og NPORT arkivering
Detaljer om 13F-arkivering er gratis. Detaljer om NP-ansøgninger kræver et premium-medlemskab. Grønne rækker angiver nye positioner. Røde rækker angiver lukkede positioner. Klik på linket ikon for at se den fulde transaktionshistorik.
Opgrader
for at låse premium-data op og eksportere til Excel ![]() .
.
| Fil dato | Kilde | Investor | Type | Gennemsnitlig pris (Øst) |
Aktier | Δ Aktier (%) |
Rapporteret Værdi ($1000) |
Δ Værdi (%) |
Port Alloc (%) |
|
|---|---|---|---|---|---|---|---|---|---|---|
| 2026-02-13 | 13F | Citigroup Inc | 11 | 0 | ||||||
| 2026-02-12 | 13F | Eagle Point Credit Management LLC | 369.796 | 2.385 | ||||||
| 2026-02-13 | 13F | Great West Life Assurance Co /can/ | 53.304 | -0,24 | 0 | |||||
| 2026-02-13 | 13F | Caitong International Asset Management Co., Ltd | 1 | -99,89 | 0 | -100,00 | ||||
| 2025-11-04 | 13F | Pineridge Advisors LLC | 79 | 0,00 | 0 | |||||
| 2026-02-23 | 13F | Virtu Financial LLC | 0 | -100,00 | 0 | |||||
| 2026-01-26 | 13F | Cwm, Llc | 25 | 0,00 | 0 | |||||
| 2026-02-17 | 13F | SageView Advisory Group, LLC | 300 | 2 | ||||||
| 2026-02-17 | 13F | Two Sigma Investments, Lp | 519.253 | 3.349 | ||||||
| 2026-02-17 | 13F | Regal Investment Advisors LLC | 49.059 | 316 | ||||||
| 2025-11-14 | 13F | Squarepoint Ops LLC | 0 | -100,00 | 0 | |||||
| 2026-02-12 | 13F | Hrt Financial Lp | 11.991 | 0 | ||||||
| 2026-02-17 | 13F | Captrust Financial Advisors | 50.035 | 323 | ||||||
| 2026-02-03 | 13F | International Assets Investment Management, Llc | 53.580 | -9,39 | 346 | |||||
| 2026-02-17 | 13F | Cetera Investment Advisers | 21.346 | -68,99 | 138 | -67,30 | ||||
| 2026-02-17 | 13F | Fmr Llc | 0 | -100,00 | 0 | |||||
| 2026-02-18 | 13F | Garton & Associates Financial Advisors LLC | 3.055 | 20 | ||||||
| 2026-02-11 | 13F | Winton Capital Group Ltd | 30.516 | 197 | ||||||
| 2026-02-17 | 13F | Citadel Advisors Llc | Put | 26.100 | 13,48 | 168 | 20,00 | |||
| 2026-02-17 | 13F | Citadel Advisors Llc | Call | 23.400 | 50,97 | 151 | 59,57 | |||
| 2026-02-12 | 13F | Principal Securities, Inc. | 0 | -100,00 | 0 | |||||
| 2026-02-12 | 13F | Financial Engines Advisors L.L.C. | 21.604 | 139 | ||||||
| 2026-02-11 | 13F | Group One Trading, L.p. | Put | 1.900 | -94,10 | 12 | -93,88 | |||
| 2026-02-11 | 13F | Group One Trading, L.p. | Call | 3.000 | -6,25 | 19 | 0,00 | |||
| 2026-02-12 | 13F | BlackRock, Inc. | 287.947 | -4,20 | 1.857 | 1,31 | ||||
| 2025-10-31 | 13F | Y-Intercept (Hong Kong) Ltd | 0 | -100,00 | 0 | |||||
| 2025-11-14 | 13F | Two Sigma Securities, Llc | 0 | -100,00 | 0 | |||||
| 2026-01-29 | 13F | IMC-Chicago, LLC | Put | 35.700 | 8,84 | 230 | 15,00 | |||
| 2025-11-04 | 13F | Flaharty Asset Management, LLC | 0 | -100,00 | 0 | |||||
| 2026-02-12 | 13F | Jane Street Group, Llc | Call | 0 | -100,00 | 0 | -100,00 | |||
| 2026-02-13 | 13F | Wells Fargo & Company/mn | 29.992 | -8,45 | 193 | -3,02 | ||||
| 2026-02-11 | 13F | Flagship Wealth Advisors, Llc | 0 | -100,00 | 0 | |||||
| 2026-02-17 | 13F | Advisor Group Holdings, Inc. | 33.258 | -20,80 | 215 | -25,69 | ||||
| 2026-01-07 | 13F | Aventura Private Wealth, LLC | 0 | -100,00 | 0 | |||||
| 2026-01-12 | 13F | Salem Investment Counselors Inc | 0 | -100,00 | 0 | |||||
| 2026-02-13 | 13F | Pathstone Holdings, LLC | 49.637 | 114,83 | 323 | 125,17 | ||||
| 2026-02-13 | 13F | Marshall Wace, Llp | 282.289 | 1.821 | ||||||
| 2026-02-17 | 13F | Quadrature Capital Ltd | 56.559 | 365 | ||||||
| 2026-02-17 | 13F | Magnetar Financial LLC | 0 | -100,00 | 0 | |||||
| 2026-02-17 | 13F | Schonfeld Strategic Advisors LLC | 29.028 | 187 | ||||||
| 2026-02-12 | 13F | Jane Street Group, Llc | Put | 10.400 | 67 | |||||
| 2026-02-17 | 13F | Susquehanna International Group, Llp | 13.058 | -23,88 | 84 | -19,23 | ||||
| 2026-02-09 | 13F | Legal & General Group Plc | 306.904 | 23,85 | 1.983 | 31,26 | ||||
| 2026-02-12 | 13F | Jane Street Group, Llc | 82.290 | 531 | ||||||
| 2026-02-17 | 13F | Susquehanna International Group, Llp | Put | 17.600 | 38,58 | 114 | 46,75 | |||
| 2026-02-17 | 13F | Millennium Management Llc | 11.551 | -93,59 | 75 | -93,27 | ||||
| 2026-01-21 | 13F | Flagship Harbor Advisors, Llc | 821 | 5 | ||||||
| 2026-01-21 | 13F | Sound Income Strategies, LLC | 50 | 0,00 | 0 | |||||
| 2026-01-22 | 13F | ETF Store, Inc. | 60.873 | 5,28 | 393 | 11,36 | ||||
| 2026-02-17 | 13F | Aquatic Capital Management LLC | 0 | -100,00 | 0 | |||||
| 2026-02-10 | 13F | Bnp Paribas Arbitrage, Sa | 0 | -100,00 | 0 | |||||
| 2026-01-29 | 13F | Comerica Bank | 2.653 | 146,56 | 17 | 183,33 | ||||
| 2026-02-17 | 13F | Jones Financial Companies Lllp | 0 | -100,00 | 0 | |||||
| 2026-01-14 | 13F | ORG Partners LLC | 2.120 | 0,00 | 14 | 8,33 | ||||
| 2026-02-10 | 13F | Envestnet Asset Management Inc | 17.567 | 1,64 | 113 | 7,62 | ||||
| 2026-02-11 | 13F | Group One Trading, L.p. | 0 | -100,00 | 0 | -100,00 | ||||
| 2025-11-04 | 13F | IMC-Chicago, LLC | 0 | -100,00 | 0 | -100,00 | ||||
| 2026-02-13 | 13F | Pin Oak Investment Advisors Inc | 800 | 0,00 | 0 | -100,00 | ||||
| 2026-01-22 | 13F | Jackson Thornton Asset Management, Llc | 34.164 | -1,20 | 226 | 7,11 | ||||
| 2026-02-05 | 13F | Allworth Financial LP | 10.205 | 0,00 | 66 | 4,84 | ||||
| 2026-02-11 | 13F | Simplex Trading, Llc | Put | 4.700 | -40,51 | 30 | ||||
| 2026-02-06 | 13F | Adell Harriman & Carpenter Inc | 12.000 | 0,00 | 77 | 5,48 | ||||
| 2026-02-12 | 13F | Connecticut Wealth Management, LLC | 0 | -100,00 | 0 | |||||
| 2026-02-17 | 13F | Tower Research Capital LLC (TRC) | 1.491 | -75,97 | 10 | -75,68 | ||||
| 2026-02-17 | 13F | Susquehanna International Group, Llp | Call | 0 | -100,00 | 0 | -100,00 | |||
| 2025-11-14 | 13F | Eqis Capital Management, Inc. | 0 | -100,00 | 0 | |||||
| 2026-01-26 | 13F | Nations Financial Group Inc, /ia/ /adv | 10.450 | 67 | ||||||
| 2026-04-01 | 13F | First Financial Bank - Trust Division | 65.573 | 0,00 | 276 | -34,60 | ||||
| 2026-02-17 | 13F | Bank Of America Corp /de/ | 63.972 | 5.335,17 | 413 | 5.785,71 | ||||
| 2026-02-10 | 13F | Quantbot Technologies LP | 61.614 | 513,81 | 397 | 550,82 | ||||
| 2026-01-29 | 13F | UBS Group AG | 39.980 | -62,62 | 258 | -60,58 | ||||
| 2026-01-07 | 13F | Green Alpha Advisors, LLC | 558.944 | 11,78 | 3.605 | 18,20 | ||||
| 2026-01-14 | 13F | Nova Wealth Management, Inc. | 3.722 | 0,00 | 24 | 9,09 | ||||
| 2026-02-17 | 13F | Signature Equity Partners, LLC | 113 | 1 | ||||||
| 2026-02-13 | 13F | Morgan Stanley | 76.865 | 4,97 | 496 | 10,99 | ||||
| 2026-02-17 | 13F | Brevan Howard Capital Management LP | 0 | -100,00 | 0 | |||||
| 2026-02-11 | 13F | LPL Financial LLC | 37.270 | -43,04 | 240 | -39,85 | ||||
| 2026-02-13 | 13F | MAI Capital Management | 736 | 44,03 | 5 | 33,33 | ||||
| 2026-02-12 | 13F | Triumph Capital Management | 300 | 2 | ||||||
| 2026-01-14 | 13F | Spire Wealth Management | 100 | 0,00 | 1 | |||||
| 2026-01-16 | 13F | Ronald Blue Trust, Inc. | 80 | 0,00 | 1 | |||||
| 2026-02-17 | 13F | Citadel Advisors Llc | 0 | -100,00 | 0 | |||||
| 2026-02-17 | 13F | Northern Trust Corp | 17.337 | -12,36 | 112 | -7,50 | ||||
| 2026-02-02 | 13F | Chung Wu Investment Group, LLC | 1.100 | 0,00 | 7 | 16,67 | ||||
| 2026-02-17 | 13F | Raymond James Financial Inc | 15.066 | 12,01 | 97 | 18,29 | ||||
| 2025-11-14 | 13F | Mercer Global Advisors Inc /adv | 0 | -100,00 | 0 | |||||
| 2025-11-12 | 13F | Cambridge Investment Research Advisors, Inc. | 0 | -100,00 | 0 | |||||
| 2026-02-17 | 13F | Royal Bank Of Canada | 20.290 | -73,97 | 131 | -72,42 | ||||
| 2026-02-11 | 13F | Simplex Trading, Llc | 2.260 | -26,55 | 15 | |||||
| 2025-11-12 | 13F | Creekmur Asset Management LLC | 0 | 0 | ||||||
| 2026-02-11 | 13F | Simplex Trading, Llc | Call | 9.100 | -10,78 | 59 | ||||
| 2026-02-13 | 13F/A | Virtus ETF Advisers LLC | 0 | -100,00 | 0 | |||||
| 2026-02-06 | 13F | EverSource Wealth Advisors, LLC | 0 | -100,00 | 0 | -100,00 | ||||
| 2025-11-14 | 13F | Wolverine Trading, Llc | Put | 10.200 | 61 | |||||
| 2026-01-28 | 13F | N.E.W. Advisory Services LLC | 4.000 | 100,00 | 26 | 108,33 | ||||
| 2026-02-17 | 13F | Aqr Capital Management Llc | 34.164 | -2,11 | 220 | 3,77 | ||||
| 2026-02-17 | 13F | Two Sigma Advisers, Lp | 63.197 | 107,88 | 408 | 120,00 | ||||
| 2026-04-02 | 13F | Aspect Partners, LLC | 167 | 5,70 | 1 | -100,00 | ||||
| 2026-02-02 | 13F | Danske Bank A/s | 4 | 33,33 | 0 | |||||
| 2026-02-17 | 13F | Oxford Asset Management Llp | 20.499 | -39,99 | 132 | -36,54 | ||||
| 2026-01-21 | 13F | Prime Capital Investment Advisors, LLC | 12.185 | 0,00 | 79 | 5,41 | ||||
| 2026-02-17 | 13F | Virtus Investment Advisers, Inc. | 167.524 | -20,71 | 1.081 | -16,15 |