Grundlæggende statistik
| Institutionelle ejere | 204 total, 204 long only, 0 short only, 0 long/short - change of 1,49% MRQ |
| Gennemsnitlig porteføljeallokering | 0.7246 % - change of -2,98% MRQ |
| Institutionelle aktier (lange) | 37.922.402 (ex 13D/G) - change of 3,15MM shares 9,06% MRQ |
| Institutionel værdi (lang) | $ 1.671.219 USD ($1000) |
Institutionelt ejerskab og aktionærer
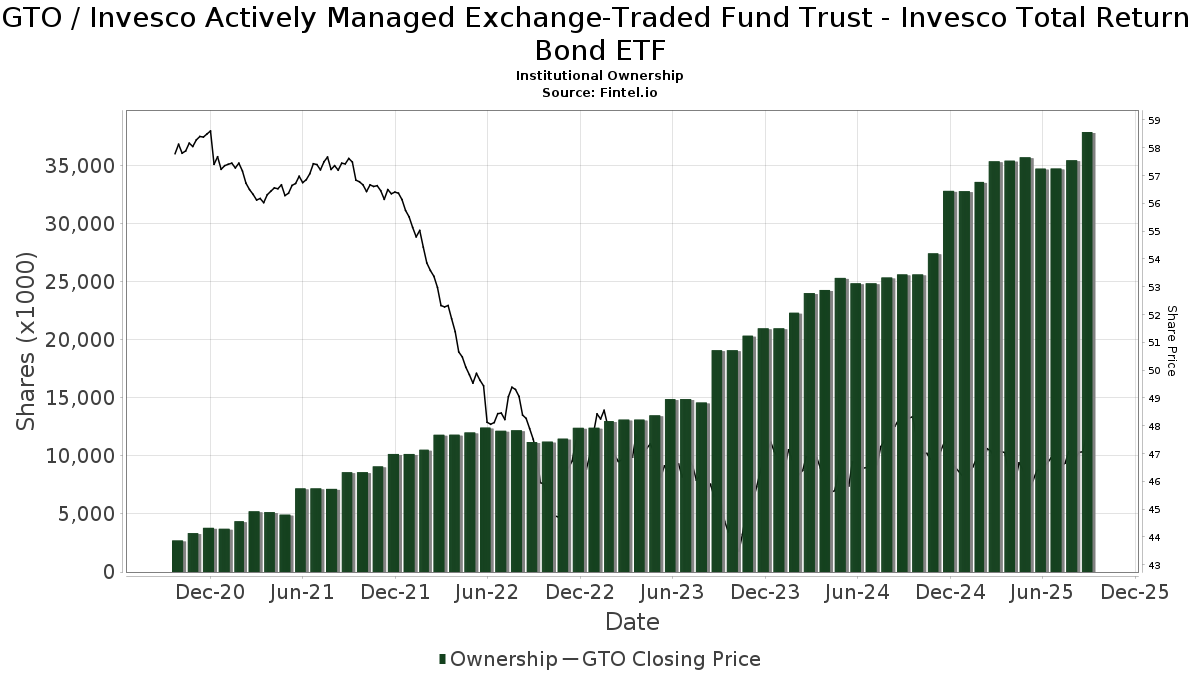
Invesco Actively Managed Exchange-Traded Fund Trust - Invesco Total Return Bond ETF (US:GTO) har 204 institutionelle ejere og aktionærer, der har indsendt 13D/G- eller 13F-formularer til Securities Exchange Commission (SEC). Disse institutioner har i alt 37,922,402 aktier. Største aktionærer omfatter LPL Financial LLC, Advisor Group Holdings, Inc., Envestnet Asset Management Inc, Invesco Ltd., Morgan Stanley, Cwm, Llc, Private Advisor Group, LLC, Bank of New York Mellon Corp, Bank Of America Corp /de/, and Brio Consultants, LLC .
Invesco Actively Managed Exchange-Traded Fund Trust - Invesco Total Return Bond ETF (ARCA:GTO) institutionel ejerskabsstruktur viser aktuelle positioner i virksomheden efter institutioner og fonde, samt seneste ændringer i positionsstørrelse. Større aktionærer kan omfatte individuelle investorer, investeringsforeninger, hedgefonde eller institutioner. Skema 13D angiver, at investoren besidder (eller besidder) mere end 5 % af virksomheden og har til hensigt (eller har til hensigt at) aktivt at forfølge en ændring i forretningsstrategi. Skema 13G indikerer en passiv investering på over 5%.
The share price as of September 12, 2025 is 47,78 / share. Previously, on September 13, 2024, the share price was 48,60 / share. This represents a decline of 1,69% over that period.
Fondens stemningsscore
Fund Sentiment Score (fka Ownership Accumulation Score) finder de aktier, der bliver mest købt af fonde. Det er resultatet af en sofistikeret, multi-faktor kvantitativ model, der identificerer virksomheder med de højeste niveauer af institutionel akkumulering. Scoringsmodellen bruger en kombination af den samlede stigning i oplyste ejere, ændringerne i porteføljeallokeringer i disse ejere og andre målinger. Tallet går fra 0 til 100, hvor højere tal indikerer et højere niveau af akkumulering for sine jævnaldrende, og 50 er gennemsnittet.
Opdateringsfrekvens: Dagligt
Se Ownership Explorer, som giver en liste over højest rangerende virksomheder.
Institutionel Put/Call-forhold
Ud over at indberette standardaktie- og gældsudstedelser skal institutter med mere end 100 mill. aktiver under forvaltning også oplyse deres put- og call-optionsbeholdninger. Da salgsoptioner generelt indikerer negativ stemning, og købsoptioner indikerer positiv stemning, kan vi få en fornemmelse af den overordnede institutionelle stemning ved at plotte forholdet mellem put og kald. Diagrammet til højre viser det historiske put/call-forhold for dette instrument.
Brug af Put/Call Ratio som en indikator for investorernes stemning overvinder en af de vigtigste mangler ved at bruge totalt institutionelt ejerskab, som er, at en betydelig mængde af aktiver under forvaltning investeres passivt for at spore indekser. Passivt forvaltede fonde køber typisk ikke optioner, så indikatoren for put/call-forholdet følger mere nøje følelsen af aktivt forvaltede fonde.
13F og NPORT arkivering
Detaljer om 13F-arkivering er gratis. Detaljer om NP-ansøgninger kræver et premium-medlemskab. Grønne rækker angiver nye positioner. Røde rækker angiver lukkede positioner. Klik på linket ikon for at se den fulde transaktionshistorik.
Opgrader
for at låse premium-data op og eksportere til Excel ![]() .
.
| Fil dato | Kilde | Investor | Type | Gennemsnitlig pris (Øst) |
Aktier | Δ Aktier (%) |
Rapporteret Værdi ($1000) |
Δ Værdi (%) |
Port Alloc (%) |
|
|---|---|---|---|---|---|---|---|---|---|---|
| 2025-08-14 | 13F | Avid Wealth Partners LLC | 80.192 | -27,02 | 3.760 | -27,08 | ||||
| 2025-08-13 | 13F | VestGen Advisors, LLC | 209.747 | 1,81 | 9.867 | 2,05 | ||||
| 2025-08-14 | 13F | IHT Wealth Management, LLC | 130.771 | 16,28 | 6.132 | 16,18 | ||||
| 2025-08-14 | 13F | Wiley Bros.-aintree Capital, Llc | 13.200 | -64,98 | 619 | -64,91 | ||||
| 2025-08-14 | 13F | Ausdal Financial Partners, Inc. | 4.554 | -45,81 | 214 | -45,94 | ||||
| 2025-08-14 | 13F | Arete Wealth Advisors, LLC | 31.052 | -7,73 | 1 | 0,00 | ||||
| 2025-08-14 | 13F | Treasure Coast Financial Planning | 34.095 | -1,98 | 1.599 | -2,08 | ||||
| 2025-08-11 | 13F | Principal Securities, Inc. | 13.635 | 12,98 | 639 | 14,11 | ||||
| 2025-07-02 | 13F | Howard Financial Services, Ltd. | 711.727 | -0,43 | 33.373 | -0,52 | ||||
| 2025-08-12 | 13F | Founders Financial Alliance, LLC | 14.711 | 0,00 | 690 | -0,14 | ||||
| 2025-08-14 | 13F | Prestige Wealth Management Group LLC | 559 | -65,26 | 26 | -65,33 | ||||
| 2025-08-14 | 13F | UBS Group AG | 17 | -88,19 | 1 | -100,00 | ||||
| 2025-07-10 | 13F | Stewardship Advisors, LLC | 245.800 | 0,27 | 11.526 | 0,18 | ||||
| 2025-07-10 | 13F | Exchange Traded Concepts, Llc | 18.585 | 871 | ||||||
| 2025-08-04 | 13F | Arkadios Wealth Advisors | 16.101 | 0,42 | 755 | 0,27 | ||||
| 2025-08-12 | 13F | Jpmorgan Chase & Co | 82.012 | -25,90 | 3.846 | -25,96 | ||||
| 2025-08-11 | 13F | Vista Cima Wealth Management LLC | 18.002 | 0,04 | 844 | 0,00 | ||||
| 2025-08-07 | 13F | CENTRAL TRUST Co | 0 | -100,00 | 0 | |||||
| 2025-07-09 | 13F | Dynamic Advisor Solutions LLC | 598.765 | 2,91 | 28.076 | 2,82 | ||||
| 2025-08-12 | 13F | Change Path, LLC | 7.549 | -16,26 | 354 | -16,55 | ||||
| 2025-07-11 | 13F | SILVER OAK SECURITIES, Inc | 20.527 | 0,00 | 963 | 0,21 | ||||
| 2025-05-12 | 13F | Sandy Spring Bank | 0 | -100,00 | 0 | |||||
| 2025-07-17 | 13F | Financial Designs Corp | 16.673 | -4,91 | 782 | -4,99 | ||||
| 2025-08-07 | 13F | Verus Capital Partners, Llc | 274.892 | 11,51 | 12.890 | 11,42 | ||||
| 2025-08-12 | 13F | BlackRock, Inc. | 0 | -100,00 | 0 | |||||
| 2025-08-11 | 13F | Strategic Wealth Partners, Ltd. | 42 | 2 | ||||||
| 2025-08-13 | 13F | Jones Financial Companies Lllp | 224.356 | 14,78 | 10.486 | 14,64 | ||||
| 2025-08-12 | 13F | Integrated Advisors Network LLC | 0 | -100,00 | 0 | |||||
| 2025-07-22 | 13F | Merit Financial Group, LLC | 26.014 | -40,36 | 1.220 | -40,45 | ||||
| 2025-07-25 | 13F | Total Clarity Wealth Management, Inc. | 110.188 | 49,38 | 5.167 | 50,96 | ||||
| 2025-08-13 | 13F | Baird Financial Group, Inc. | 643.497 | 7,40 | 30.174 | 7,30 | ||||
| 2025-04-02 | 13F | Marcum Wealth, LLC | 57.117 | 2,57 | 2.681 | 3,76 | ||||
| 2025-07-24 | 13F | IFP Advisors, Inc | 68.699 | 157,05 | 3.221 | 156,86 | ||||
| 2025-08-07 | 13F | Brio Consultants, LLC | 1.013.133 | 3,98 | 47.506 | 3,89 | ||||
| 2025-08-14 | 13F | Integrated Wealth Concepts LLC | 138.649 | -0,26 | 6.501 | -0,34 | ||||
| 2025-08-08 | 13F | Fortis Group Advisors, LLC | 5.906 | 275 | ||||||
| 2025-07-14 | 13F | Park Avenue Securities Llc | 41.025 | 14,57 | 2 | 0,00 | ||||
| 2025-08-15 | 13F | First Heartland Consultants, Inc. | 10.269 | -4,94 | 482 | -4,94 | ||||
| 2025-08-12 | 13F | Global Retirement Partners, LLC | 4.167 | 195 | ||||||
| 2025-08-14 | 13F | Money Concepts Capital Corp | 32.320 | -2,37 | 1.515 | -2,45 | ||||
| 2025-07-24 | 13F | Mainstay Capital Management Llc /adv | 15.340 | 103,99 | 719 | 104,26 | ||||
| 2025-08-11 | 13F | PAX Financial Group, LLC | 32.882 | 1,43 | 1.542 | 1,31 | ||||
| 2025-08-11 | 13F | Alteri Wealth LLC | 6.748 | 15,83 | 316 | 15,75 | ||||
| 2025-07-29 | 13F | Private Trust Co Na | 2.099 | 0,00 | 98 | 0,00 | ||||
| 2025-08-04 | 13F | Creative Financial Designs Inc /adv | 430 | 0,00 | 20 | 0,00 | ||||
| 2025-08-11 | 13F | Tidemark, LLC | 782.477 | 1,05 | 36.690 | 0,97 | ||||
| 2025-05-12 | 13F | Condor Capital Management | 0 | -100,00 | 0 | |||||
| 2025-08-06 | 13F | AE Wealth Management LLC | 452 | 201,33 | 21 | 200,00 | ||||
| 2025-08-15 | 13F | Captrust Financial Advisors | 85.430 | 150,88 | 4.006 | 150,63 | ||||
| 2025-08-19 | 13F | Advisory Services Network, LLC | 6.208 | 1,22 | 289 | 0,70 | ||||
| 2025-08-25 | 13F | BLVD Private Wealth, LLC | 16.985 | 796 | ||||||
| 2025-07-17 | 13F | KWB Wealth | 770.147 | -1,18 | 36.143 | -0,05 | ||||
| 2025-08-12 | 13F | SRS Capital Advisors, Inc. | 13 | 0,00 | 1 | |||||
| 2025-07-25 | 13F | Pathway Financial Advisors LLC | 13.209 | 0,00 | 619 | 0,00 | ||||
| 2025-07-22 | 13F | Simplicity Wealth,LLC | 78.672 | -52,77 | 3.689 | -52,81 | ||||
| 2025-07-29 | 13F | Empirical Asset Management, LLC | 7.408 | 20,85 | 347 | 20,91 | ||||
| 2025-05-07 | 13F | Foundations Investment Advisors, LLC | 0 | -100,00 | 0 | |||||
| 2025-04-23 | 13F | Mascagni Wealth Management, Inc. | 0 | -100,00 | 0 | -100,00 | ||||
| 2025-08-08 | 13F | Larson Financial Group LLC | 0 | -100,00 | 0 | |||||
| 2025-08-05 | 13F | Landmark Wealth Management, Inc. | 25.411 | -81,14 | 1.192 | -81,16 | ||||
| 2025-08-08 | 13F | Evolution Wealth Advisors, LLC | 14.695 | 0,20 | 689 | 0,15 | ||||
| 2025-08-07 | 13F | Vise Technologies, Inc. | 20.696 | 38,27 | 970 | 39,77 | ||||
| 2025-07-29 | NP | ACPSX - Invesco Core Plus Bond Fund Class A | 100.000 | 0,00 | 4.626 | -2,18 | ||||
| 2025-08-13 | 13F | Cerity Partners LLC | 58.790 | 2.737 | ||||||
| 2025-07-02 | 13F | HBW Advisory Services LLC | 0 | -100,00 | 0 | |||||
| 2025-07-14 | 13F | Mechanics Bank Trust Department | 69.541 | -8,30 | 3.261 | -8,38 | ||||
| 2025-08-12 | 13F | J.w. Cole Advisors, Inc. | 28.877 | 13,77 | 1.354 | 13,69 | ||||
| 2025-07-18 | 13F | Cooper Financial Group | 60.421 | -10,46 | 2.833 | -10,52 | ||||
| 2025-08-14 | 13F | Royal Bank Of Canada | 62.655 | -24,21 | 2.938 | -24,28 | ||||
| 2025-08-12 | 13F | Entropy Technologies, LP | 33.501 | 528 | ||||||
| 2025-07-28 | 13F | RFG Advisory, LLC | 24.636 | -17,91 | 1.155 | -17,97 | ||||
| 2025-08-14 | 13F | Integrity Wealth Advisors, Inc. | 23.039 | -24,57 | 1.080 | -24,63 | ||||
| 2025-07-16 | 13F | Perigon Wealth Management, LLC | 12.175 | 3,49 | 571 | 3,26 | ||||
| 2025-05-15 | 13F | Tower Research Capital LLC (TRC) | 0 | -100,00 | 0 | |||||
| 2025-07-21 | 13F | Ameriflex Group, Inc. | 645 | 46,26 | 30 | 50,00 | ||||
| 2025-08-14 | 13F | GWM Advisors LLC | 116.242 | -0,24 | 5.451 | -0,33 | ||||
| 2025-07-25 | 13F | Concurrent Investment Advisors, LLC | 53.933 | 29,13 | 2.529 | 28,98 | ||||
| 2025-08-13 | 13F | WCG Wealth Advisors LLC | 0 | -100,00 | 0 | |||||
| 2025-08-15 | 13F | Cooksen Wealth, LLC | 0 | -100,00 | 0 | |||||
| 2025-07-11 | 13F | Farther Finance Advisors, LLC | 5.760 | 13,45 | 270 | 13,45 | ||||
| 2025-07-10 | 13F | Kmg Fiduciary Partners, Llc | 310.921 | 3,24 | 14.579 | 3,15 | ||||
| 2025-08-15 | 13F | Koesten, Hirschmann & Crabtree, INC. | 5 | 400,00 | 0 | |||||
| 2025-08-08 | 13F | Avantax Advisory Services, Inc. | 96.902 | 6,46 | 4.544 | 6,37 | ||||
| 2025-07-14 | 13F | Rooted Wealth Advisors, Inc. | 264.347 | 6,34 | 12.316 | 4,97 | ||||
| 2025-08-06 | 13F | Axim Planning & Wealth | 8.709 | 408 | ||||||
| 2025-07-25 | 13F | Atria Wealth Solutions, Inc. | 0 | -100,00 | 0 | |||||
| 2025-04-22 | 13F | Castleview Partners, Llc | 0 | -100,00 | 0 | |||||
| 2025-08-06 | 13F | Destiny Capital Corp/CO | 56.566 | -1,19 | 2.652 | -1,27 | ||||
| 2025-08-05 | 13F | American Capital Advisory, LLC | 186.842 | 0,85 | 8.761 | 0,77 | ||||
| 2025-07-15 | 13F | Colonial River Wealth Management, LLC | 81.182 | 9,02 | 3.794 | 8,59 | ||||
| 2025-07-25 | 13F | Northwest Capital Management Inc | 913 | -34,69 | 43 | -35,38 | ||||
| 2025-08-07 | 13F | PFG Advisors | 170.237 | 5,61 | 7.982 | 5,53 | ||||
| 2025-08-14 | 13F | TCG Advisory Services, LLC | 36.452 | -13,91 | 1.709 | -13,99 | ||||
| 2025-07-31 | 13F | Opes Wealth Management LLC | 0 | -100,00 | 0 | |||||
| 2025-07-09 | 13F | Sandbox Financial Partners, LLC | 73.093 | 2,83 | 3.427 | 2,76 | ||||
| 2025-07-31 | 13F | Insight Wealth Partners, LLC | 102.875 | 1,56 | 4.824 | 1,47 | ||||
| 2025-08-27 | NP | LAWAX - LADENBURG AGGRESSIVE GROWTH FUND Class A Shares | 23.726 | 0,00 | 1.113 | -0,09 | ||||
| 2025-07-30 | 13F | Drive Wealth Management, Llc | 14.005 | 657 | ||||||
| 2025-08-04 | 13F | Pensionmark Financial Group, Llc | 218.389 | 10,60 | 10.240 | 10,51 | ||||
| 2025-07-11 | 13F | Pinnacle Bancorp, Inc. | 1.044 | -11,22 | 49 | -12,73 | ||||
| 2025-07-18 | 13F | Truist Financial Corp | 14.062 | -92,37 | 659 | -92,38 | ||||
| 2025-08-08 | 13F | Hartland & Co., LLC | 32.514 | 38,34 | 1.525 | 38,29 | ||||
| 2025-08-27 | NP | LGWAX - LADENBURG GROWTH FUND Class A Shares | 126.767 | -4,65 | 5.944 | -4,73 | ||||
| 2025-07-09 | 13F | Channel Wealth Llc | 142.771 | -1,40 | 6.695 | -1,49 | ||||
| 2025-08-06 | 13F | Commonwealth Equity Services, Llc | 57.354 | -8,03 | 3 | 0,00 | ||||
| 2025-07-10 | 13F | Focus Financial Network, Inc. | 299.941 | -19,85 | 14.064 | -19,92 | ||||
| 2025-08-14 | 13F | Citadel Advisors Llc | 44.317 | 605,35 | 2.078 | 606,80 | ||||
| 2025-08-13 | 13F | Lido Advisors, LLC | 42.117 | -8,49 | 1.975 | -8,57 | ||||
| 2025-08-11 | 13F | TD Waterhouse Canada Inc. | 543 | 0,00 | 25 | 0,00 | ||||
| 2025-08-14 | 13F | Hurley Capital, LLC | 0 | -100,00 | 0 | |||||
| 2025-08-12 | 13F | Steward Partners Investment Advisory, Llc | 168 | 0,00 | 8 | 0,00 | ||||
| 2025-08-08 | 13F | Petix & Botte Co | 351.101 | 17,24 | 16.463 | 17,14 | ||||
| 2025-08-14 | 13F | Wells Fargo & Company/mn | 353.964 | 3,28 | 16.597 | 3,19 | ||||
| 2025-08-14 | 13F | Jane Street Group, Llc | 28.506 | -75,83 | 1.337 | -75,87 | ||||
| 2025-08-06 | 13F | Wedbush Securities Inc | 5.491 | 7,35 | 0 | |||||
| 2025-04-21 | 13F | Trivant Custom Portfolio Group, LLC | 0 | -100,00 | 0 | |||||
| 2025-08-04 | 13F | Impact Partnership Wealth, LLC | 4.369 | -1,11 | 205 | -1,45 | ||||
| 2025-08-27 | 13F/A | Brinker Capital Investments, LLC | 32.034 | -3,59 | 1.502 | -3,66 | ||||
| 2025-08-11 | 13F | Private Advisor Group, LLC | 1.349.313 | 126,76 | 63.269 | 126,57 | ||||
| 2025-07-10 | 13F | Wealth Enhancement Advisory Services, Llc | 205.289 | -22,60 | 9.597 | -22,90 | ||||
| 2025-08-11 | 13F | Regal Investment Advisors LLC | 154.613 | 2,78 | 7.250 | 2,69 | ||||
| 2025-08-07 | 13F | Resources Investment Advisors, LLC. | 10.881 | 0,00 | 510 | 0,00 | ||||
| 2025-07-31 | 13F | Cambridge Investment Research Advisors, Inc. | 64.601 | 10,83 | 3 | 50,00 | ||||
| 2025-08-08 | 13F | Gts Securities Llc | 5.420 | 254 | ||||||
| 2025-08-06 | 13F | Atlas Legacy Advisors, LLC | 128.740 | 4,51 | 6.037 | 4,83 | ||||
| 2025-07-24 | 13F | MSH Capital Advisors LLC | 21.569 | 0,50 | 1.011 | 0,40 | ||||
| 2025-08-12 | 13F | Financial Advocates Investment Management | 12.986 | 15,43 | 609 | 15,37 | ||||
| 2025-08-04 | 13F | Spire Wealth Management | 491.422 | -12,48 | 22.901 | -13,09 | ||||
| 2025-08-18 | 13F | Geneos Wealth Management Inc. | 2.185 | -68,76 | 102 | -68,90 | ||||
| 2025-08-14 | 13F | CoreCap Advisors, LLC | 3.105 | 146 | ||||||
| 2025-07-29 | NP | ACCEX - Invesco Corporate Bond Fund Class C | 100.000 | 0,00 | 4.626 | -2,18 | ||||
| 2025-07-25 | 13F | Concord Wealth Partners | 1.203 | -6,96 | 56 | -6,67 | ||||
| 2025-08-14 | 13F | Mml Investors Services, Llc | 200.907 | 15,71 | 9 | 12,50 | ||||
| 2025-08-13 | 13F | Flow Traders U.s. Llc | 22.987 | 46,81 | 1 | |||||
| 2025-04-16 | 13F | Fortitude Family Office, LLC | 0 | -100,00 | 0 | |||||
| 2025-08-14 | 13F | Fmr Llc | 14 | 27,27 | 1 | |||||
| 2025-08-13 | 13F | Elios Financial Group Inc. | 23.213 | 15,94 | 1.088 | 15,87 | ||||
| 2025-08-19 | 13F | Newbridge Financial Services Group, Inc. | 501 | 0,00 | 23 | 0,00 | ||||
| 2025-04-30 | 13F | Sofos Investments, Inc. | 43 | -97,94 | 2 | -97,92 | ||||
| 2025-08-13 | 13F | Invesco Ltd. | 2.411.115 | 2,63 | 113.057 | 2,54 | ||||
| 2025-07-15 | 13F | Beacon Financial Planning, Inc | 198.553 | -6,18 | 9.310 | -6,25 | ||||
| 2025-08-14 | 13F | Aqr Capital Management Llc | 98.980 | 15,31 | 4.641 | 15,22 | ||||
| 2025-08-04 | 13F | Assetmark, Inc | 16.277 | 41,44 | 763 | 41,30 | ||||
| 2025-08-13 | 13F | GeoWealth Management, LLC | 28.676 | -11,75 | 1.345 | -11,81 | ||||
| 2025-08-13 | 13F | Renaissance Technologies Llc | 50.000 | 66,11 | 2.344 | 66,01 | ||||
| 2025-07-15 | 13F | Aspire Capital Advisors LLC | 10.843 | 144,32 | 508 | 144,23 | ||||
| 2025-08-27 | NP | LNOAX - LADENBURG INCOME & GROWTH FUND Class A Shares | 138.159 | 0,00 | 6.478 | -0,08 | ||||
| 2025-08-15 | 13F | Equitable Holdings, Inc. | 0 | -100,00 | 0 | |||||
| 2025-05-15 | 13F | EP Wealth Advisors, Inc. | 0 | -100,00 | 0 | -100,00 | ||||
| 2025-08-04 | 13F | Flagship Harbor Advisors, Llc | 37.049 | -9,14 | 1.737 | -9,20 | ||||
| 2025-07-15 | 13F | RTD Financial Advisors, Inc. | 843.410 | -1,02 | 39.548 | -1,11 | ||||
| 2025-07-30 | 13F | Retirement Planning Group | 33.023 | -4,58 | 1.548 | -4,68 | ||||
| 2025-07-14 | 13F | Sowell Financial Services LLC | 6.577 | 19,36 | 308 | 19,38 | ||||
| 2025-08-12 | 13F | Cook Wealth Management Group Llc | 0 | -100,00 | 0 | |||||
| 2025-08-05 | 13F | Scarborough Advisors, LLC | 63.313 | -0,34 | 2.969 | -0,44 | ||||
| 2025-07-24 | 13F | Williams & Novak, LLC | 4.513 | 212 | ||||||
| 2025-07-24 | 13F | Acima Private Wealth, Llc | 207.755 | -8,96 | 9.742 | -9,03 | ||||
| 2025-08-13 | 13F | JT Stratford LLC | 25.414 | 1,10 | 1.192 | 1,02 | ||||
| 2025-08-05 | 13F | Key FInancial Inc | 2.439 | -1,77 | 114 | -1,72 | ||||
| 2025-08-14 | 13F | NorthLanding Financial Partners, LLC | 5.167 | 1,02 | 242 | 0,83 | ||||
| 2025-07-24 | 13F | Gilliland Jeter Wealth Management LLC | 0 | -100,00 | 0 | |||||
| 2025-08-14 | 13F | Sequent Planning LLC | 24.284 | 8,99 | 1.139 | 8,90 | ||||
| 2025-07-09 | 13F | WealthCare Investment Partners, LLC | 5.524 | 1,14 | 258 | 3,20 | ||||
| 2025-08-12 | 13F | LPL Financial LLC | 4.043.609 | 26,49 | 189.605 | 26,38 | ||||
| 2025-08-05 | 13F | Bank of New York Mellon Corp | 1.135.448 | 2,44 | 53.241 | 2,36 | ||||
| 2025-08-13 | 13F | IAG Wealth Partners, LLC | 6.672 | -92,26 | 313 | -92,29 | ||||
| 2025-08-14 | 13F | Betterment LLC | 7.240 | -38,09 | 0 | |||||
| 2025-08-27 | NP | LNCAX - LADENBURG INCOME FUND Class A Shares | 28.559 | 0,00 | 1.339 | -0,07 | ||||
| 2025-08-12 | 13F | Richmond Investment Services, LLC | 236.542 | 752,19 | 11.091 | 751,84 | ||||
| 2025-07-17 | 13F | Wagner Wealth Management, Llc | 29 | 0,00 | 1 | 0,00 | ||||
| 2025-07-30 | 13F | Brookstone Capital Management | 518.467 | 3,70 | 24.311 | 3,61 | ||||
| 2025-08-14 | 13F | Raymond James Financial Inc | 481.003 | 16,10 | 22.554 | 16,00 | ||||
| 2025-08-04 | 13F | Barnes Dennig Private Wealth Management LLC | 3.034 | 142 | ||||||
| 2025-08-12 | 13F | Journey Strategic Wealth Llc | 317.586 | 4,93 | 14.892 | 4,84 | ||||
| 2025-07-28 | 13F | Kiker Wealth Management, LLC | 65 | -95,12 | 3 | -95,16 | ||||
| 2025-08-08 | 13F | Financial Gravity Companies, Inc. | 43 | 0,00 | 2 | 100,00 | ||||
| 2025-08-04 | 13F | Northwest Financial Advisors | 52.342 | -23,47 | 2.454 | -23,53 | ||||
| 2025-08-14 | 13F | Financial Engines Advisors L.L.C. | 7.016 | 0,42 | 329 | 0,30 | ||||
| 2025-08-13 | 13F | Daner Wealth Management, LLC | 108.661 | 54,42 | 5.107 | 55,84 | ||||
| 2025-08-14 | 13F | Mercer Global Advisors Inc /adv | 41.428 | -9,48 | 1.943 | -9,55 | ||||
| 2025-08-14 | 13F | Snowden Capital Advisors LLC | 200.969 | 1,53 | 9.423 | 1,44 | ||||
| 2025-08-07 | 13F | Allworth Financial LP | 2.545 | 0,00 | 119 | 1,71 | ||||
| 2025-05-15 | 13F/A | Orion Portfolio Solutions, LLC | 33.228 | 27,04 | 1.559 | 28,52 | ||||
| 2025-08-06 | 13F | Vestmark Advisory Solutions, Inc. | 103.340 | 4.846 | ||||||
| 2025-08-13 | 13F | Level Four Advisory Services, Llc | 4.476 | -14,51 | 210 | -14,69 | ||||
| 2025-07-30 | 13F | LGT Financial Advisors LLC | 823 | -27,62 | 39 | -28,30 | ||||
| 2025-08-14 | 13F | Mariner, LLC | 5.043 | 236 | ||||||
| 2025-08-13 | 13F | Transce3nd, LLC | 121 | 0,00 | 6 | 0,00 | ||||
| 2025-07-08 | 13F | Parallel Advisors, LLC | 18 | -98,47 | 1 | -100,00 | ||||
| 2025-07-21 | 13F | Ashton Thomas Securities, Llc | 102.590 | 55,54 | 4.810 | 55,41 | ||||
| 2025-08-12 | 13F | Gladstone Institutional Advisory LLC | 66.173 | 21,70 | 3.103 | 21,60 | ||||
| 2025-07-18 | 13F | Consolidated Portfolio Review Corp | 7.649 | 15,51 | 359 | 15,48 | ||||
| 2025-04-14 | 13F | LexAurum Advisors, LLC | 0 | -100,00 | 0 | -100,00 | ||||
| 2025-08-12 | 13F | Proequities, Inc. | 0 | 0 | ||||||
| 2025-07-25 | 13F | Envestnet Portfolio Solutions, Inc. | 205.582 | -0,26 | 9.640 | -0,35 | ||||
| 2025-07-28 | 13F | Harbour Investments, Inc. | 1.352 | 49,72 | 63 | 50,00 | ||||
| 2025-08-04 | 13F | IFG Advisory, LLC | 262.776 | -30,87 | 12.322 | -30,93 | ||||
| 2025-08-15 | 13F | Asset Allocation Strategies LLC | 127.926 | 24,88 | 5.998 | 24,78 | ||||
| 2025-07-09 | 13F | Fjell Capital, LLC | 101.702 | -1,51 | 4.769 | -1,61 | ||||
| 2025-08-14 | 13F | Comerica Bank | 16.449 | -0,69 | 771 | -0,77 | ||||
| 2025-07-25 | 13F | Cwm, Llc | 1.699.341 | 0,20 | 80 | 0,00 | ||||
| 2025-07-29 | 13F | Stratos Wealth Partners, LTD. | 9.236 | -11,75 | 433 | -11,81 | ||||
| 2025-08-15 | 13F | Morgan Stanley | 1.894.960 | -2,65 | 88.855 | -2,73 | ||||
| 2025-08-01 | 13F | Envestnet Asset Management Inc | 2.829.210 | -3,42 | 132.662 | -3,50 | ||||
| 2025-08-27 | 13F | Barnes Wealth Management Group, Inc | 10.867 | 0,80 | 510 | 0,79 | ||||
| 2025-07-22 | 13F | USAdvisors Wealth Management, LLC | 99.891 | 14,76 | 5 | 0,00 | ||||
| 2025-08-13 | 13F | Capital Analysts, Inc. | 224 | 0,45 | 0 | |||||
| 2025-07-28 | 13F | Frazier Financial Advisors, LLC | 37 | 2,78 | 2 | 0,00 | ||||
| 2025-08-08 | 13F | Good Life Advisors, LLC | 260.620 | 15,97 | 12.220 | 15,87 | ||||
| 2025-07-16 | 13F | BOS Asset Management, LLC | 124.986 | 0,54 | 5.861 | 0,45 | ||||
| 2025-07-28 | 13F | Axxcess Wealth Management, Llc | 79.007 | 324,40 | 3.705 | 324,28 | ||||
| 2025-08-14 | 13F | Stifel Financial Corp | 5.130 | -41,32 | 241 | -41,46 | ||||
| 2025-04-16 | 13F/A | Western Wealth Management, LLC | 0 | -100,00 | 0 | |||||
| 2025-09-04 | 13F/A | Advisor Group Holdings, Inc. | 2.988.723 | 1,44 | 140.143 | 1,35 | ||||
| 2025-08-14 | 13F | Bank Of America Corp /de/ | 1.070.063 | 45,71 | 50.175 | 45,59 | ||||
| 2025-04-15 | 13F | Fifth Third Bancorp | 0 | -100,00 | 0 | |||||
| 2025-08-18 | 13F | Goodman Advisory Group, LLC | 0 | -100,00 | 0 | |||||
| 2025-07-17 | 13F | Janney Montgomery Scott LLC | 21.206 | 38,50 | 1 | |||||
| 2025-08-13 | 13F | Kuhn & Co Investment Counsel | 15.663 | 0,00 | 734 | -0,14 | ||||
| 2025-08-15 | 13F | Kestra Advisory Services, LLC | 50.495 | -0,53 | 2.368 | -0,63 | ||||
| 2025-07-31 | 13F | Schneider Downs Wealth Management Advisors, LP | 9.385 | -50,90 | 440 | -50,89 | ||||
| 2025-07-30 | 13F | Cullen/frost Bankers, Inc. | 5.952 | 4,42 | 279 | 4,49 | ||||
| 2025-08-14 | 13F | Hilltop Holdings Inc. | 11.636 | 1,19 | 546 | 1,11 | ||||
| 2025-08-27 | NP | LOWAX - LADENBURG GROWTH & INCOME FUND Class A Shares | 250.202 | 0,00 | 11.732 | -0,09 | ||||
| 2025-07-23 | 13F | High Note Wealth, LLC | 0 | 0 | ||||||
| 2025-07-21 | 13F | Ameritas Advisory Services, LLC | 423 | 20 | ||||||
| 2025-07-30 | 13F | Bogart Wealth, LLC | 6.348 | -10,55 | 298 | -10,81 | ||||
| 2025-08-11 | 13F | HighTower Advisors, LLC | 23.016 | 9,08 | 1.079 | 8,99 | ||||
| 2025-08-13 | 13F | Solutions 4 Wealth, Ltd | 6.560 | 308 | ||||||
| 2025-08-13 | 13F | Northwestern Mutual Wealth Management Co | 125 | -88,68 | 6 | -90,20 | ||||
| 2025-08-14 | 13F | Susquehanna International Group, Llp | 163.910 | 220,63 | 7.686 | 220,34 | ||||
| 2025-08-08 | 13F | Cetera Investment Advisers | 414.325 | 4,21 | 19.428 | 4,12 | ||||
| 2025-05-12 | 13F | Independent Advisor Alliance | 0 | -100,00 | 0 |
Other Listings
| PE:GTO |