Grundlæggende statistik
| Institutionelle aktier (lange) | 16.849.941 - 49,58% (ex 13D/G) - change of -2,40MM shares -12,45% MRQ |
| Institutionel værdi (lang) | $ 240.523 USD ($1000) |
Institutionelt ejerskab og aktionærer
Greenlight Capital Re, Ltd. (US:GLRE) har 128 institutionelle ejere og aktionærer, der har indsendt 13D/G- eller 13F-formularer til Securities Exchange Commission (SEC). Disse institutioner har i alt 16,849,941 aktier. Største aktionærer omfatter BlackRock, Inc., Dimensional Fund Advisors Lp, Morgan Stanley, Private Management Group Inc, CWA Asset Management Group, LLC, Ameriprise Financial Inc, Vanguard Group Inc, State Street Corp, Geode Capital Management, Llc, and American Century Companies Inc .
Greenlight Capital Re, Ltd. (NasdaqGS:GLRE) institutionel ejerskabsstruktur viser aktuelle positioner i virksomheden efter institutioner og fonde, samt seneste ændringer i positionsstørrelse. Større aktionærer kan omfatte individuelle investorer, investeringsforeninger, hedgefonde eller institutioner. Skema 13D angiver, at investoren besidder (eller besidder) mere end 5 % af virksomheden og har til hensigt (eller har til hensigt at) aktivt at forfølge en ændring i forretningsstrategi. Skema 13G indikerer en passiv investering på over 5%.
The share price as of March 30, 2026 is 16,98 / share. Previously, on March 31, 2025, the share price was 13,55 / share. This represents an increase of 25,31% over that period.

Fondens stemningsscore
Fund Sentiment Score (fka Ownership Accumulation Score) finder de aktier, der bliver mest købt af fonde. Det er resultatet af en sofistikeret, multi-faktor kvantitativ model, der identificerer virksomheder med de højeste niveauer af institutionel akkumulering. Scoringsmodellen bruger en kombination af den samlede stigning i oplyste ejere, ændringerne i porteføljeallokeringer i disse ejere og andre målinger. Tallet går fra 0 til 100, hvor højere tal indikerer et højere niveau af akkumulering for sine jævnaldrende, og 50 er gennemsnittet.
Opdateringsfrekvens: Dagligt
Se Ownership Explorer, som giver en liste over højest rangerende virksomheder.
AI+ Ask Fintel’s AI assistant about Greenlight Capital Re, Ltd..
Select a question to share a public post with an AI-crafted answer.
Thinking of good questions…
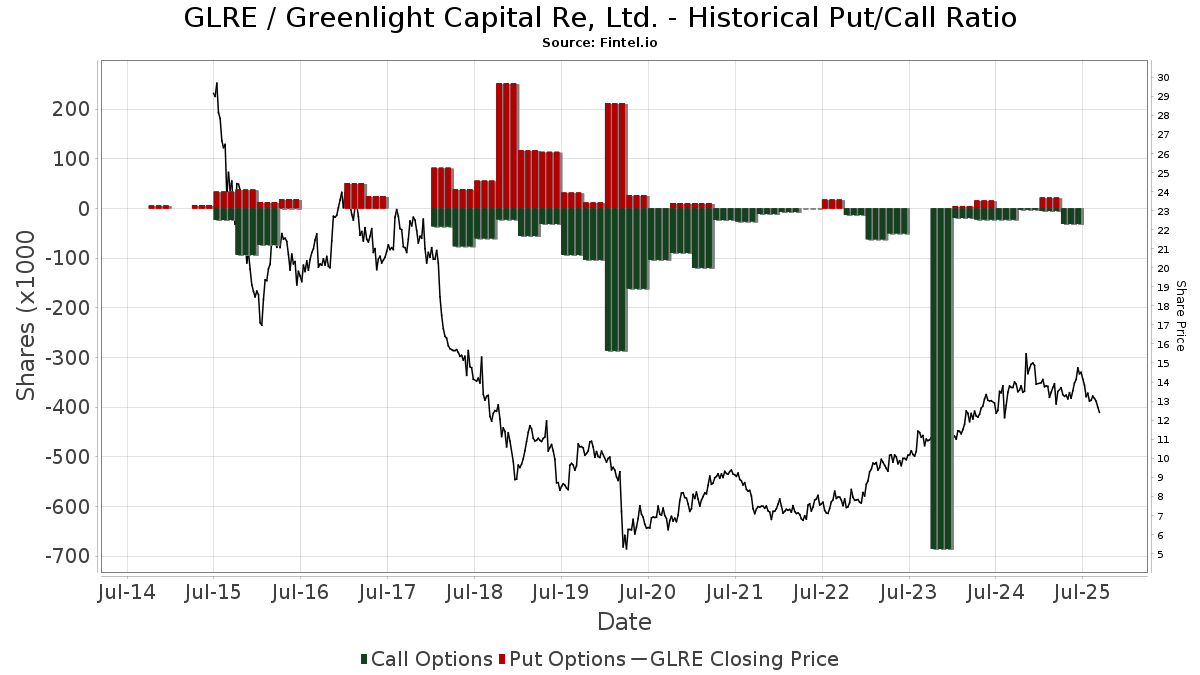
Institutionel Put/Call-forhold
Ud over at indberette standardaktie- og gældsudstedelser skal institutter med mere end 100 mill. aktiver under forvaltning også oplyse deres put- og call-optionsbeholdninger. Da salgsoptioner generelt indikerer negativ stemning, og købsoptioner indikerer positiv stemning, kan vi få en fornemmelse af den overordnede institutionelle stemning ved at plotte forholdet mellem put og kald. Diagrammet til højre viser det historiske put/call-forhold for dette instrument.
Brug af Put/Call Ratio som en indikator for investorernes stemning overvinder en af de vigtigste mangler ved at bruge totalt institutionelt ejerskab, som er, at en betydelig mængde af aktiver under forvaltning investeres passivt for at spore indekser. Passivt forvaltede fonde køber typisk ikke optioner, så indikatoren for put/call-forholdet følger mere nøje følelsen af aktivt forvaltede fonde.
13F og NPORT arkivering
Detaljer om 13F-arkivering er gratis. Detaljer om NP-ansøgninger kræver et premium-medlemskab. Grønne rækker angiver nye positioner. Røde rækker angiver lukkede positioner. Klik på linket ikon for at se den fulde transaktionshistorik.
Opgrader
for at låse premium-data op og eksportere til Excel ![]() .
.
| Fil dato | Kilde | Investor | Type | Gennemsnitlig pris (Øst) |
Aktier | Δ Aktier (%) |
Rapporteret Værdi ($1000) |
Δ Værdi (%) |
Port Alloc (%) |
|
|---|---|---|---|---|---|---|---|---|---|---|
| 2026-02-06 | 13F | IFP Advisors, Inc | 12 | -77,36 | 0 | |||||
| 2025-11-12 | 13F | First Trust Advisors Lp | 0 | -100,00 | 0 | |||||
| 2026-01-22 | 13F | Bfsg, Llc | 11.940 | 31,79 | 174 | 51,30 | ||||
| 2026-02-17 | 13F | Northern Trust Corp | 233.718 | -4,06 | 3.408 | 10,15 | ||||
| 2026-02-02 | 13F | Pinnacle Wealth Management Advisory Group, LLC | 170.050 | 2.479 | ||||||
| 2026-02-06 | 13F | Pnc Financial Services Group, Inc. | 45 | -83,52 | 1 | -100,00 | ||||
| 2026-01-20 | 13F | Signaturefd, Llc | 963 | 105,77 | 14 | 180,00 | ||||
| 2026-01-23 | 13F | Ritholtz Wealth Management | 28.272 | -2,41 | 412 | 12,26 | ||||
| 2026-01-08 | 13F | Versant Capital Management, Inc | 1.728 | 25 | ||||||
| 2026-02-17 | 13F | Price T Rowe Associates Inc /md/ | 54.875 | 42,28 | 1 | |||||
| 2026-02-11 | 13F | Simplex Trading, Llc | Put | 500 | 0,00 | 7 | ||||
| 2026-02-11 | 13F | Simplex Trading, Llc | 95 | -52,50 | 1 | |||||
| 2026-02-13 | 13F | Macquarie Group Ltd | 0 | -100,00 | 0 | |||||
| 2026-02-09 | 13F | Huntington National Bank | 0 | -100,00 | 0 | |||||
| 2026-02-12 | 13F | Steward Partners Investment Advisory, Llc | 900 | 0,00 | 13 | 18,18 | ||||
| 2026-02-13 | 13F | Quarry LP | 502 | -71,46 | 7 | -68,18 | ||||
| 2026-01-30 | 13F | Us Bancorp \de\ | 209 | 3 | ||||||
| 2026-02-05 | 13F | Allworth Financial LP | 179 | 138,67 | 3 | |||||
| 2026-02-03 | 13F | Coston, McIsaac & Partners | 49 | 0,00 | 0 | |||||
| 2026-02-17 | 13F | California State Teachers Retirement System | 1.610 | -19,62 | 23 | -8,00 | ||||
| 2026-02-13 | 13F | Nierenberg Investment Management Company, Inc. | 55.555 | 810 | ||||||
| 2026-02-17 | 13F | Elkhorn Partners Limited Partnership | 0 | -100,00 | 0 | |||||
| 2025-11-13 | 13F | Rathbone Brothers plc | 0 | -100,00 | 0 | -100,00 | ||||
| 2026-02-10 | 13F | Godfrey Financial Associates, Inc. | 8 | 0 | ||||||
| 2026-02-17 | 13F | Two Sigma Advisers, Lp | 80.900 | -5,82 | 1.180 | 8,17 | ||||
| 2026-01-20 | 13F | Harbor Capital Advisors, Inc. | 50 | -1,96 | 0 | |||||
| 2026-02-10 | 13F | Bnp Paribas Arbitrage, Sa | 29.873 | -1,77 | 436 | 12,69 | ||||
| 2026-02-17 | 13F | Royal Bank Of Canada | 30.855 | -2,44 | 450 | 12,22 | ||||
| 2026-02-12 | 13F | MetLife Investment Management, LLC | 12.987 | 5,63 | 189 | 21,15 | ||||
| 2026-02-10 | 13F | Caz Investments Lp | 5.000 | 0,00 | 73 | 14,29 | ||||
| 2026-02-13 | 13F | Boston Partners | 0 | -100,00 | 0 | |||||
| 2026-02-17 | 13F | Russell Investments Group, Ltd. | 7.300 | 72,25 | 106 | 100,00 | ||||
| 2026-02-11 | 13F | Private Management Group Inc | 1.502.235 | 25,63 | 21.903 | 44,22 | ||||
| 2026-02-06 | 13F | Bare Financial Services, Inc | 175 | 3 | ||||||
| 2025-11-14 | 13F | Susquehanna International Group, Llp | Call | 0 | -100,00 | 0 | -100,00 | |||
| 2026-01-05 | 13F | GAMMA Investing LLC | 259 | 52,35 | 4 | 50,00 | ||||
| 2026-02-13 | 13F | Jacobs Levy Equity Management, Inc | 0 | -100,00 | 0 | |||||
| 2026-02-17 | 13F | Millennium Management Llc | 199.314 | 546,54 | 2.906 | 642,97 | ||||
| 2025-11-14 | 13F | ExodusPoint Capital Management, LP | 0 | -100,00 | 0 | |||||
| 2026-02-11 | 13F | Ameritas Investment Partners, Inc. | 2.647 | 39 | ||||||
| 2026-02-17 | 13F | Quantinno Capital Management LP | 31.067 | 32,81 | 453 | 52,19 | ||||
| 2026-02-04 | 13F | Independent Advisor Alliance | 64.561 | 2,79 | 941 | 18,07 | ||||
| 2026-02-12 | 13F | BRYN MAWR TRUST Co | 87.000 | 0,00 | 1.268 | 14,86 | ||||
| 2026-02-12 | 13F | Nuveen, LLC | 56.367 | 0,00 | 822 | 14,83 | ||||
| 2026-01-29 | 13F | UMA Financial Services, Inc. | 91 | 1 | ||||||
| 2026-02-09 | 13F | Geode Capital Management, Llc | 601.272 | -0,49 | 8.768 | 14,24 | ||||
| 2025-11-13 | 13F | Healthcare Of Ontario Pension Plan Trust Fund | 0 | -100,00 | 0 | |||||
| 2026-02-06 | 13F | Mraz, Amerine & Associates, Inc. | 45.710 | -0,33 | 666 | 14,43 | ||||
| 2026-02-13 | 13F | Walleye Capital LLC | 18.846 | 275 | ||||||
| 2026-02-17 | 13F | Trexquant Investment LP | 104.212 | 70,17 | 1.519 | 95,50 | ||||
| 2026-02-12 | 13F | New York State Common Retirement Fund | 6.349 | 0,00 | 93 | 15,00 | ||||
| 2026-01-29 | 13F | Vanguard Group Inc | 629.722 | -57,16 | 9.181 | -50,81 | ||||
| 2026-01-26 | 13F | Cwm, Llc | 2.843 | -21,66 | 0 | |||||
| 2026-02-17 | 13F | Bridgeway Capital Management Inc | 210.684 | 8,25 | 3.072 | 24,28 | ||||
| 2026-01-30 | 13F | North Star Investment Management Corp. | 380 | 15,15 | 6 | 25,00 | ||||
| 2026-02-10 | 13F | Goldman Sachs Group Inc | 229.630 | 73,11 | 3.348 | 98,81 | ||||
| 2026-02-13 | 13F | MAI Capital Management | 19 | 0 | ||||||
| 2026-02-13 | 13F | Arrowstreet Capital, Limited Partnership | 77.699 | 1.133 | ||||||
| 2025-11-14 | 13F | Raymond James Financial Inc | 0 | -100,00 | 0 | -100,00 | ||||
| 2026-02-17 | 13F | Aqr Capital Management Llc | 45.484 | -22,64 | 663 | -11,13 | ||||
| 2026-02-13 | 13F | Smartleaf Asset Management LLC | 15 | 0,00 | 0 | |||||
| 2026-02-12 | 13F | Jane Street Group, Llc | 132.463 | 74,30 | 1.931 | 100,10 | ||||
| 2026-02-17 | 13F | Public Employees Retirement System Of Ohio | 0 | -100,00 | 0 | |||||
| 2025-10-30 | 13F | Bailard, Inc. | 0 | -100,00 | 0 | |||||
| 2026-02-17 | 13F | Summit Trail Advisors, Llc | 36.731 | 1,08 | 536 | 16,05 | ||||
| 2026-02-05 | 13F | Amalgamated Bank | 823 | -10,15 | 0 | |||||
| 2026-02-17 | 13F | Tower Research Capital LLC (TRC) | 3.799 | 13,07 | 55 | 30,95 | ||||
| 2026-02-17 | 13F | Engineers Gate Manager LP | 0 | -100,00 | 0 | |||||
| 2025-11-13 | 13F | WealthCollab, LLC | 0 | -100,00 | 0 | |||||
| 2026-02-11 | 13F | O'shaughnessy Asset Management, Llc | 34.357 | -14,10 | 501 | -1,38 | ||||
| 2026-02-23 | 13F | Leonteq Securities AG | 0 | -100,00 | 0 | |||||
| 2026-01-21 | 13F | Capital Advisors, Ltd. LLC | 176 | 18,12 | 0 | |||||
| 2026-02-05 | 13F | Pinnacle Associates Ltd | 170.100 | 2.480 | ||||||
| 2026-02-17 | 13F | Two Sigma Investments, Lp | 189.661 | 48,90 | 2.765 | 71,00 | ||||
| 2026-01-30 | 13F | Torren Management, LLC | 1.350 | 20 | ||||||
| 2025-11-13 | 13F | Parallel Advisors, LLC | 0 | -100,00 | 0 | |||||
| 2026-02-02 | 13F | Cornerstone Planning Group LLC | 415 | 6 | ||||||
| 2026-02-17 | 13F | Punch & Associates Investment Management, Inc. | 317.000 | -34,27 | 4.622 | -24,54 | ||||
| 2026-02-17 | 13F | MIRAE ASSET GLOBAL ETFS HOLDINGS Ltd. | 12.141 | -2,21 | 177 | 12,74 | ||||
| 2026-02-13 | 13F | JustInvest LLC | 13.976 | 22,11 | 204 | 40,00 | ||||
| 2026-01-16 | 13F | West Branch Capital LLC | 600 | 0,00 | 9 | 14,29 | ||||
| 2026-02-17 | 13F | State Of Wisconsin Investment Board | 31.981 | 6,67 | 466 | 22,63 | ||||
| 2026-02-13 | 13F | Stifel Financial Corp | 52.913 | 6,07 | 771 | 21,80 | ||||
| 2025-11-14 | 13F | Aquatic Capital Management LLC | 0 | -100,00 | 0 | |||||
| 2026-02-10 | 13F | Bank of New York Mellon Corp | 81.902 | 0,55 | 1.194 | 15,47 | ||||
| 2026-02-06 | 13F | EverSource Wealth Advisors, LLC | 1.586 | 57,19 | 23 | 91,67 | ||||
| 2026-02-17 | 13F | Susquehanna International Group, Llp | 18.603 | 271 | ||||||
| 2026-02-17 | 13F | Advisor Group Holdings, Inc. | 2.024 | -82,01 | 30 | -79,86 | ||||
| 2026-01-07 | 13F | Massmutual Trust Co Fsb/adv | 31 | -45,61 | 0 | |||||
| 2026-02-12 | 13F | BlackRock, Inc. | 2.333.724 | 8,24 | 34.026 | 24,26 | ||||
| 2026-02-17 | 13F | Creative Planning | 174.652 | 240,49 | 2.546 | 291,09 | ||||
| 2026-02-17 | 13F | Citadel Advisors Llc | Call | 23.800 | 347 | |||||
| 2026-02-17 | 13F | Citadel Advisors Llc | 150.048 | 2.188 | ||||||
| 2026-02-17 | 13F | Bank Of America Corp /de/ | 76.643 | 49,55 | 1.117 | 71,85 | ||||
| 2026-02-13 | 13F | Rhumbline Advisers | 35.973 | -17,05 | 524 | -4,73 | ||||
| 2026-02-13 | 13F | American Century Companies Inc | 484.881 | -5,59 | 7.070 | 8,39 | ||||
| 2026-02-06 | 13F | Covestor Ltd | 80 | -8,05 | 0 | |||||
| 2026-02-12 | 13F | Hrt Financial Lp | 118.654 | 459,13 | 2 | |||||
| 2026-02-09 | 13F | Legal & General Group Plc | 2.097 | -14,89 | 31 | -3,23 | ||||
| 2026-02-13 | 13F | Sterling Capital Management LLC | 1.509 | -17,36 | 22 | -4,35 | ||||
| 2026-02-17 | 13F | Fmr Llc | 6.388 | 60,42 | 93 | 86,00 | ||||
| 2026-01-14 | 13F | Wedge Capital Management L L P/nc | 71.757 | 0,42 | 1.046 | 15,33 | ||||
| 2026-02-13 | 13F | Charles Schwab Investment Management Inc | 75.407 | 0,07 | 1.099 | 14,96 | ||||
| 2026-01-23 | 13F | Avion Wealth | 82 | 0 | ||||||
| 2026-02-10 | 13F | Connor, Clark & Lunn Investment Management Ltd. | 0 | -100,00 | 0 | |||||
| 2026-02-17 | 13F | Optiver Holding B.V. | 254 | 0,00 | 4 | 0,00 | ||||
| 2026-01-12 | 13F | Lancaster Investment Management | 110.000 | 0,00 | 2 | 0,00 | ||||
| 2026-02-11 | 13F | Deutsche Bank Ag\ | 329.979 | 0,00 | 4.811 | 14,82 | ||||
| 2026-02-17 | 13F | Qube Research & Technologies Ltd | 21.520 | -52,73 | 314 | -45,85 | ||||
| 2026-02-13 | 13F | Martingale Asset Management L P | 36.812 | -51,62 | 537 | -44,51 | ||||
| 2026-02-19 | 13F | Invesco Ltd. | 28.511 | -20,84 | 416 | -9,19 | ||||
| 2026-02-12 | 13F | Dimensional Fund Advisors Lp | 1.901.654 | -7,37 | 27.726 | 6,34 | ||||
| 2026-02-13 | 13F | Wittenberg Investment Management, Inc. | 38.000 | 0,00 | 554 | 14,94 | ||||
| 2026-02-11 | 13F | Empowered Funds, LLC | 162.184 | 10,99 | 2.365 | 27,44 | ||||
| 2026-01-15 | 13F | Nisa Investment Advisors, Llc | 2 | 0 | ||||||
| 2026-02-11 | 13F | Janney Montgomery Scott LLC | 15.612 | 0 | ||||||
| 2026-02-13 | 13F | SRS Capital Advisors, Inc. | 0 | -100,00 | 0 | |||||
| 2026-02-06 | 13F | Gsa Capital Partners Llp | 32.087 | 0 | ||||||
| 2025-11-10 | 13F | Empirical Financial Services, LLC d.b.a. Empirical Wealth Management | 0 | -100,00 | 0 | |||||
| 2026-01-08 | 13F | True Wealth Design, LLC | 0 | -100,00 | 0 | |||||
| 2026-01-23 | 13F | Farther Finance Advisors, LLC | 401 | 223,39 | 6 | 400,00 | ||||
| 2026-01-22 | 13F | Financial Consulate, Inc | 9.736 | 0,00 | 142 | 14,63 | ||||
| 2026-02-10 | 13F | Rothschild Investment Llc | 100 | 566,67 | 1 | |||||
| 2026-02-13 | 13F | Barclays Plc | 43.458 | 20,46 | 634 | 28,66 | ||||
| 2026-02-17 | 13F | Alliancebernstein L.p. | 28.549 | 0,00 | 416 | 14,92 | ||||
| 2026-02-12 | 13F | Orchard Capital Managment, LLC | 138.927 | -43,26 | 2.026 | -34,87 | ||||
| 2026-02-13 | 13F | Public Employees Retirement Association Of Colorado | 10.431 | 0,00 | 0 | |||||
| 2026-02-11 | 13F | Metis Global Partners, LLC | 27.050 | 0,00 | 394 | 14,87 | ||||
| 2026-02-13 | 13F | Wells Fargo & Company/mn | 340.375 | 4,11 | 4.963 | 19,51 | ||||
| 2026-02-10 | 13F | Intech Investment Management Llc | 10.329 | 0,68 | 151 | 15,38 | ||||
| 2026-02-12 | 13F | Quadrant Capital Group Llc | 3.218 | 7.213,64 | 47 | |||||
| 2026-02-17 | 13F | Corsair Capital Management, L.p. | 35.591 | -0,03 | 519 | 14,60 | ||||
| 2026-02-13 | 13F | State Street Corp | 613.701 | 0,02 | 8.948 | 14,82 | ||||
| 2026-02-13 | 13F | Ubs Asset Management Americas Inc | 290 | 4 | ||||||
| 2026-02-17 | 13F | D. E. Shaw & Co., Inc. | 150.500 | -25,37 | 2.194 | -14,33 | ||||
| 2026-01-23 | 13F | Private Wealth Management Group, LLC | 79 | 0,00 | 1 | 0,00 | ||||
| 2026-01-14 | 13F | Spire Wealth Management | 620 | -77,29 | 9 | -73,53 | ||||
| 2026-02-13 | 13F | Police & Firemen's Retirement System of New Jersey | 7.964 | 0,00 | 116 | 14,85 | ||||
| 2025-11-05 | 13F | SBI Securities Co., Ltd. | 0 | -100,00 | 0 | |||||
| 2026-01-29 | 13F | UBS Group AG | 44.602 | -4,18 | 650 | 9,98 | ||||
| 2026-01-23 | 13F | State of Alaska, Department of Revenue | 1.471 | 0,00 | 0 | |||||
| 2026-02-17 | 13F | Oxford Asset Management Llp | 12.112 | 177 | ||||||
| 2025-11-14 | 13F | Cubist Systematic Strategies, LLC | 17.786 | -29,46 | 226 | -37,85 | ||||
| 2026-02-05 | 13F | R.P. Boggs & Co. | 0 | -100,00 | 0 | |||||
| 2026-02-13 | 13F | Morgan Stanley | 1.683.418 | 0,96 | 24.544 | 15,90 | ||||
| 2026-02-13 | 13F | Squarepoint Ops LLC | 24.110 | 86,28 | 352 | 114,02 | ||||
| 2026-01-07 | 13F | CWA Asset Management Group, LLC | 977.105 | 6,86 | 14.246 | 22,68 | ||||
| 2026-02-17 | 13F | Ameriprise Financial Inc | 650.276 | -0,39 | 9.481 | 14,37 | ||||
| 2025-11-17 | 13F | PDT Partners, LLC | 0 | -100,00 | 0 | -100,00 | ||||
| 2025-11-14 | 13F | Point72 (DIFC) Ltd | 1.197 | 343,33 | 15 | 400,00 | ||||
| 2026-02-11 | 13F | Jpmorgan Chase & Co | 32.971 | -21,20 | 481 | -9,60 | ||||
| 2025-10-30 | 13F | Ridgewood Investments LLC | 0 | -100,00 | 0 | |||||
| 2026-02-11 | 13F | Hughes Financial Services, LLC | 1 | 0 | ||||||
| 2026-02-17 | 13F | Jump Financial, LLC | 24.913 | 363 | ||||||
| 2026-02-13 | 13F | Citigroup Inc | 1.945 | -53,54 | 28 | -47,17 | ||||
| 2025-11-14 | 13F | Point72 Asia (Singapore) Pte. Ltd. | 1.317 | 17 |
Other Listings
| DE:G8L | 14,70 € |