Grundlæggende statistik
| Institutionelle ejere | 281 total, 280 long only, 0 short only, 1 long/short - change of 11,07% MRQ |
| Gennemsnitlig porteføljeallokering | 0.0982 % - change of 25,96% MRQ |
| Institutionelle aktier (lange) | 3.436.283 (ex 13D/G) - change of 0,35MM shares 11,31% MRQ |
| Institutionel værdi (lang) | $ 679.316 USD ($1000) |
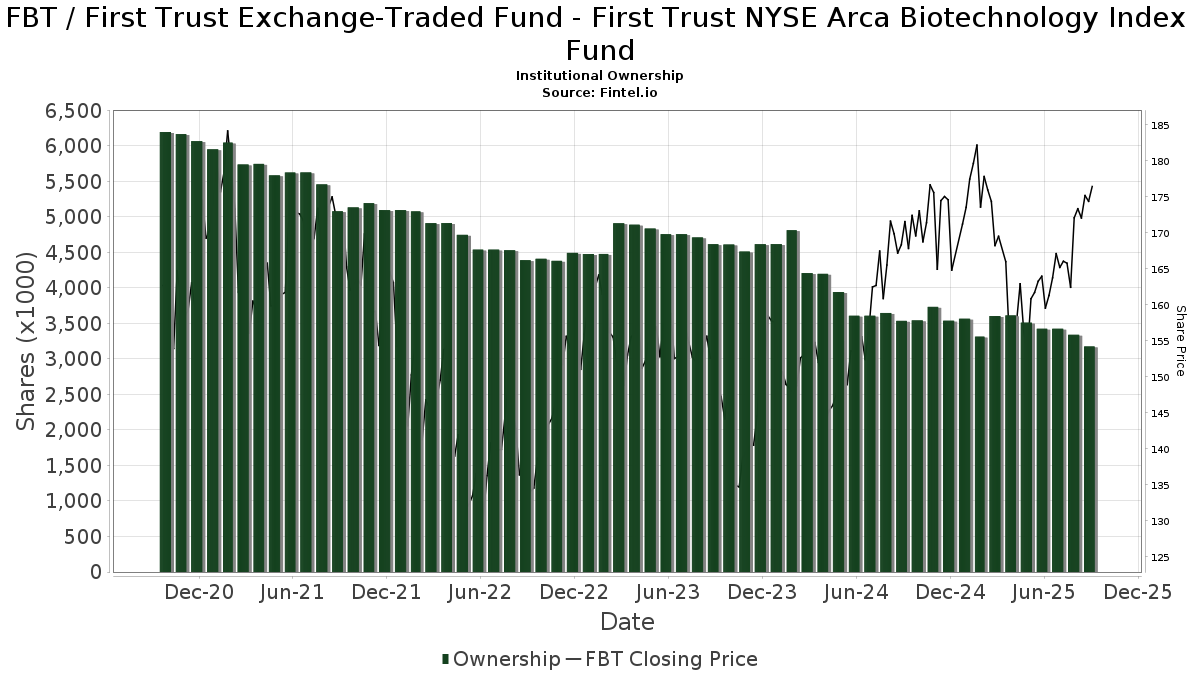
Institutionelt ejerskab og aktionærer
First Trust Exchange-Traded Fund - First Trust NYSE Arca Biotechnology Index Fund (US:FBT) har 281 institutionelle ejere og aktionærer, der har indsendt 13D/G- eller 13F-formularer til Securities Exchange Commission (SEC). Disse institutioner har i alt 3,436,283 aktier. Største aktionærer omfatter Morgan Stanley, LPL Financial LLC, Bank Of America Corp /de/, Wells Fargo & Company/mn, UBS Group AG, Royal Bank Of Canada, Raymond James Financial Inc, Berger Financial Group, Inc, Envestnet Asset Management Inc, and 360 Financial, Inc. .
First Trust Exchange-Traded Fund - First Trust NYSE Arca Biotechnology Index Fund (ARCA:FBT) institutionel ejerskabsstruktur viser aktuelle positioner i virksomheden efter institutioner og fonde, samt seneste ændringer i positionsstørrelse. Større aktionærer kan omfatte individuelle investorer, investeringsforeninger, hedgefonde eller institutioner. Skema 13D angiver, at investoren besidder (eller besidder) mere end 5 % af virksomheden og har til hensigt (eller har til hensigt at) aktivt at forfølge en ændring i forretningsstrategi. Skema 13G indikerer en passiv investering på over 5%.
The share price as of March 30, 2026 is 193,00 / share. Previously, on March 31, 2025, the share price was 170,12 / share. This represents an increase of 13,45% over that period.
Fondens stemningsscore
Fund Sentiment Score (fka Ownership Accumulation Score) finder de aktier, der bliver mest købt af fonde. Det er resultatet af en sofistikeret, multi-faktor kvantitativ model, der identificerer virksomheder med de højeste niveauer af institutionel akkumulering. Scoringsmodellen bruger en kombination af den samlede stigning i oplyste ejere, ændringerne i porteføljeallokeringer i disse ejere og andre målinger. Tallet går fra 0 til 100, hvor højere tal indikerer et højere niveau af akkumulering for sine jævnaldrende, og 50 er gennemsnittet.
Opdateringsfrekvens: Dagligt
Se Ownership Explorer, som giver en liste over højest rangerende virksomheder.
AI+ Ask Fintel’s AI assistant about First Trust Exchange-Traded Fund - First Trust NYSE Arca Biotechnology Index Fund.
Select a question to share a public post with an AI-crafted answer.
Thinking of good questions…
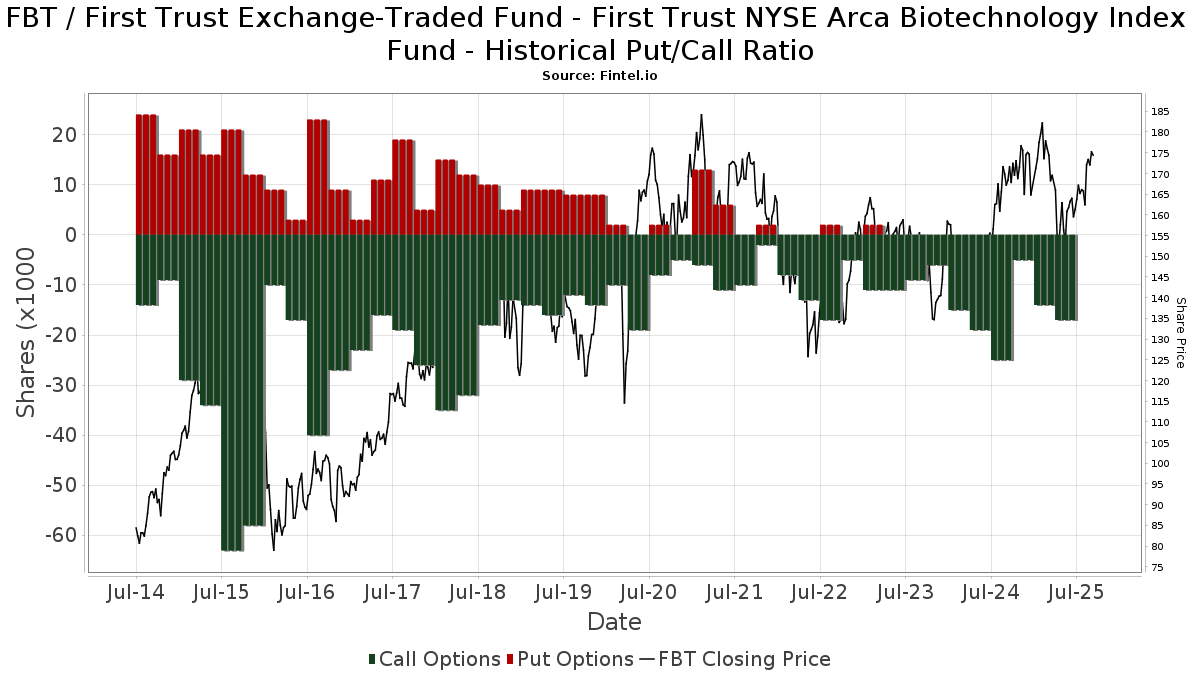
Institutionel Put/Call-forhold
Ud over at indberette standardaktie- og gældsudstedelser skal institutter med mere end 100 mill. aktiver under forvaltning også oplyse deres put- og call-optionsbeholdninger. Da salgsoptioner generelt indikerer negativ stemning, og købsoptioner indikerer positiv stemning, kan vi få en fornemmelse af den overordnede institutionelle stemning ved at plotte forholdet mellem put og kald. Diagrammet til højre viser det historiske put/call-forhold for dette instrument.
Brug af Put/Call Ratio som en indikator for investorernes stemning overvinder en af de vigtigste mangler ved at bruge totalt institutionelt ejerskab, som er, at en betydelig mængde af aktiver under forvaltning investeres passivt for at spore indekser. Passivt forvaltede fonde køber typisk ikke optioner, så indikatoren for put/call-forholdet følger mere nøje følelsen af aktivt forvaltede fonde.
13D/G-arkivering
Vi præsenterer 13D/G ansøgninger separat fra 13F ansøgninger på grund af den forskellige behandling af SEC. 13D/G-ansøgninger kan indgives af grupper af investorer (med én ledende), hvorimod 13F-ansøgninger ikke kan. Dette resulterer i situationer, hvor en investor kan indsende en 13D/G, der rapporterer én værdi for de samlede aktier (der repræsenterer alle de aktier, der ejes af investorgruppen), men derefter indsender en 13F, der rapporterer en anden værdi for de samlede aktier (der udelukkende repræsenterer deres egne) ejendomsret). Det betyder, at aktieejerskab af 13D/G-arkiver og 13F-arkiveringer ofte ikke er direkte sammenlignelige, så vi præsenterer dem separat.
Bemærk: Fra den 16. maj 2021 viser vi ikke længere ejere, der ikke har indsendt en 13D/G inden for det seneste år. Tidligere viste vi den fulde historie af 13D/G-arkiver. Generelt skal enheder, der er forpligtet til at indgive 13D/G-ansøgninger, indgive mindst årligt, før de indsender en afsluttende ansøgning. Dog forlader fonde nogle gange positioner uden at indsende en afsluttende ansøgning (dvs. de afvikler), så visning af den fulde historie resulterede nogle gange i forvirring om det nuværende ejerskab. For at undgå forvirring viser vi nu kun 'aktuelle' ejere - det vil sige - ejere, der har anmeldt inden for det seneste år.
Upgrade to unlock premium data.
| Fil dato | Form | Investor | Forrige Aktier |
Seneste Aktier |
Δ Aktier (Procent) |
Ejendomsret (Procent) |
Δ Ejerskab (Procent) |
|
|---|---|---|---|---|---|---|---|---|
| 2026-02-06 | FIRST TRUST PORTFOLIOS LP | 24,336 | 3,651,216 | 14,903.35 | 32.31 | 17,850.00 |
13F og NPORT arkivering
Detaljer om 13F-arkivering er gratis. Detaljer om NP-ansøgninger kræver et premium-medlemskab. Grønne rækker angiver nye positioner. Røde rækker angiver lukkede positioner. Klik på linket ikon for at se den fulde transaktionshistorik.
Opgrader
for at låse premium-data op og eksportere til Excel ![]() .
.
| Fil dato | Kilde | Investor | Type | Gennemsnitlig pris (Øst) |
Aktier | Δ Aktier (%) |
Rapporteret Værdi ($1000) |
Δ Værdi (%) |
Port Alloc (%) |
|
|---|---|---|---|---|---|---|---|---|---|---|
| 2026-02-13 | 13F | Maia Wealth LLC | 3.028 | -5,82 | 621 | -1,74 | ||||
| 2026-01-13 | 13F | Signature Securities Group Corporation | 3.648 | 0,00 | 753 | 15,14 | ||||
| 2026-02-17 | 13F | Fmr Llc | 1.132 | -0,96 | 234 | 14,22 | ||||
| 2026-01-21 | 13F | Flagship Harbor Advisors, Llc | 216 | 45 | ||||||
| 2026-01-26 | 13F | AE Wealth Management LLC | 11.218 | 4,34 | 2.317 | 20,19 | ||||
| 2026-02-17 | 13F/A | Kovack Advisors, Inc. | 1.612 | 6,19 | 333 | 22,06 | ||||
| 2026-02-17 | 13F | Bedell Frazier Investment Counseling, LLC | 3.497 | 9,28 | 722 | 26,00 | ||||
| 2026-02-03 | 13F | International Assets Investment Management, Llc | 5.058 | 1.045 | ||||||
| 2026-02-12 | 13F | Rossby Financial, LCC | 169 | 0,00 | 35 | 9,68 | ||||
| 2026-02-14 | 13F | Rockefeller Capital Management L.P. | 4.219 | 6,19 | 871 | 22,33 | ||||
| 2026-02-10 | 13F | Clear Harbor Asset Management, LLC | 8.447 | 1,93 | 1.744 | 17,44 | ||||
| 2026-02-17 | 13F | Susquehanna International Group, Llp | 16.009 | -59,26 | 3.306 | -53,07 | ||||
| 2026-02-11 | 13F | LPL Financial LLC | 260.833 | 30,00 | 53.867 | 49,74 | ||||
| 2026-02-13 | 13F | Brown Advisory Inc | 10.389 | -0,95 | 2.146 | 14,10 | ||||
| 2026-01-30 | 13F | Dale Q Rice Investment Management Ltd | 3.170 | -16,29 | 655 | -7,50 | ||||
| 2026-01-27 | 13F | Elevated Capital Advisors, LLC | 3 | 1 | ||||||
| 2026-02-13 | 13F | Barclays Plc | 0 | -100,00 | 0 | |||||
| 2026-02-17 | 13F | Susquehanna International Group, Llp | Put | 1.300 | 268 | |||||
| 2026-03-04 | 13F/A | Savant Capital, LLC | 0 | -100,00 | 0 | |||||
| 2026-02-17 | 13F | Susquehanna International Group, Llp | Call | 2.200 | -88,30 | 454 | -86,53 | |||
| 2026-01-30 | 13F | Sigma Planning Corp | 0 | -100,00 | 0 | |||||
| 2026-02-10 | 13F | Novak & Powell Financial Services, Inc. | 1.512 | 0,00 | 312 | 15,13 | ||||
| 2026-02-13 | 13F | Kestra Advisory Services, LLC | 0 | -100,00 | 0 | |||||
| 2026-01-29 | 13F | Kestra Private Wealth Services, Llc | 8.919 | 0,60 | 1.842 | 15,86 | ||||
| 2026-02-17 | 13F | Advisor Group Holdings, Inc. | 52.887 | -4,66 | 10.925 | 11,94 | ||||
| 2026-01-28 | 13F | APS Management Group, Inc. | 2.843 | -15,84 | 588 | -3,14 | ||||
| 2026-02-13 | 13F | Baird Financial Group, Inc. | 21.081 | 148,98 | 4.354 | 186,76 | ||||
| 2026-02-17 | 13F | Private Advisor Group, LLC | 3.306 | 1,41 | 683 | 16,78 | ||||
| 2026-03-04 | 13F | AG Campbell Advisory, LLC | 150 | 31 | ||||||
| 2026-01-30 | 13F | Strategic Blueprint, LLC | 0 | -100,00 | 0 | |||||
| 2026-02-11 | 13F | O'shaughnessy Asset Management, Llc | 25 | 0,00 | 5 | 25,00 | ||||
| 2026-01-28 | 13F | Barrett & Company, Inc. | 905 | 0,00 | 187 | 14,81 | ||||
| 2026-02-17 | 13F | Cetera Investment Advisers | 62.870 | 19,06 | 12.984 | 37,15 | ||||
| 2026-02-13 | 13F | Flow Traders U.s. Llc | 2.467 | -20,50 | 1 | |||||
| 2026-02-11 | 13F | J.w. Cole Advisors, Inc. | 1.074 | -5,04 | 222 | 9,41 | ||||
| 2026-01-23 | 13F | Farther Finance Advisors, LLC | 5.611 | -4,30 | 1.159 | 10,18 | ||||
| 2026-02-09 | 13F | Prospera Financial Services Inc | 8.742 | -6,09 | 1.806 | 8,14 | ||||
| 2026-02-10 | 13F | Goldman Sachs Group Inc | 1.609 | -56,99 | 332 | -50,45 | ||||
| 2026-01-15 | 13F | Dominguez Wealth Management Solutions, Inc. | 1.074 | -8,44 | 222 | 5,24 | ||||
| 2026-02-13 | 13F | Level Four Advisory Services, Llc | 3.528 | 8,52 | 729 | 25,09 | ||||
| 2026-01-16 | 13F | Formidable Asset Management, LLC | 1.212 | 217 | ||||||
| 2026-01-29 | 13F | High Point Wealth Management, LLC | 128 | 26 | ||||||
| 2026-01-20 | 13F | American National Bank | 0 | -100,00 | 0 | |||||
| 2026-02-17 | 13F | Royal Bank Of Canada | 154.869 | 1,42 | 31.984 | 16,82 | ||||
| 2026-02-10 | 13F | Hazlett, Burt & Watson, Inc. | 201 | 0,00 | 0 | |||||
| 2026-01-26 | 13F | Cwm, Llc | 5.096 | -0,93 | 1 | |||||
| 2026-02-26 | 13F | TD Capital Management LLC | 1.065 | 0,00 | 220 | 15,26 | ||||
| 2026-02-13 | 13F | Cozad Asset Management Inc | 1.340 | 0,00 | 277 | 15,00 | ||||
| 2026-01-23 | 13F | Financial Enhancement Group LLC | 5.789 | -0,53 | 1.269 | 16,21 | ||||
| 2026-02-02 | 13F | CX Institutional | 964 | -13,54 | 0 | |||||
| 2026-01-22 | 13F | Apollon Wealth Management, LLC | 4.278 | 14,85 | 884 | 32,38 | ||||
| 2026-01-28 | 13F | WMG Financial Advisors, LLC | 0 | -100,00 | 0 | |||||
| 2026-02-18 | 13F | NFP Retirement, Inc. | 6.725 | 0,00 | 1.389 | 15,19 | ||||
| 2026-02-14 | 13F | Torrey Growth & Income Advisors | 2.250 | -30,77 | 465 | -20,27 | ||||
| 2026-02-12 | 13F | Moneta Group Investment Advisors Llc | 1.209 | 0,00 | 250 | 15,28 | ||||
| 2026-02-18 | 13F | GWM Advisors LLC | 5.895 | -1,80 | 1.217 | 13,10 | ||||
| 2026-01-14 | 13F | Quad-Cities Investment Group, LLC | 8.445 | 0,86 | 1.744 | 16,19 | ||||
| 2026-02-13 | 13F | MAI Capital Management | 8.038 | 1,17 | 1.660 | 16,50 | ||||
| 2026-02-17 | 13F | Advisory Services Network, LLC | 0 | -100,00 | 0 | |||||
| 2026-03-19 | 13F | Painted Porch Advisors LLC | 0 | -100,00 | 0 | |||||
| 2025-10-31 | 13F | Sovran Advisors, LLC | 0 | -100,00 | 0 | |||||
| 2026-02-13 | 13F | Mariner, LLC | 1.510 | 8,09 | 312 | 24,40 | ||||
| 2026-01-23 | 13F | Clear Creek Financial Management, LLC | 1.958 | -4,35 | 404 | 10,38 | ||||
| 2026-02-13 | 13F | Smartleaf Asset Management LLC | 215 | 95,45 | 45 | 136,84 | ||||
| 2026-02-06 | 13F | GPS Wealth Strategies Group, LLC | 34 | -99,00 | 7 | -98,85 | ||||
| 2026-02-02 | 13F | Oppenheimer & Co Inc | 0 | -100,00 | 0 | -100,00 | ||||
| 2026-01-14 | 13F | CPR Investments Inc. | 0 | -100,00 | 0 | |||||
| 2026-02-04 | 13F | Dynamic Wealth Strategies, LLC | 515 | 10,75 | 106 | 27,71 | ||||
| 2026-02-06 | 13F | Cullen/frost Bankers, Inc. | 78 | 56,00 | 16 | 100,00 | ||||
| 2026-02-05 | 13F | Center for Financial Planning, Inc. | 175 | 0,00 | 36 | 16,13 | ||||
| 2026-01-13 | 13F | Stablepoint Partners, LLC | 4.980 | 2,22 | 1.028 | 17,75 | ||||
| 2026-02-13 | 13F | Ubs Asset Management Americas Inc | 50 | 10 | ||||||
| 2026-02-17 | 13F | Pinnacle Financial Partners, Inc. | 2.096 | 433 | ||||||
| 2026-02-05 | 13F | Allworth Financial LP | 0 | -100,00 | 0 | |||||
| 2026-01-09 | 13F | Dynamic Advisor Solutions LLC | 1.195 | 0,00 | 247 | 14,95 | ||||
| 2025-11-14 | 13F | Guardian Wealth Advisors, Llc / Nc | 0 | -100,00 | 0 | |||||
| 2026-01-12 | 13F | Daymark Wealth Partners, Llc | 5.872 | -0,12 | 1.213 | 14,99 | ||||
| 2026-02-11 | 13F | Gateway Wealth Partners, LLC | 7.159 | 10,70 | 1.479 | 27,52 | ||||
| 2026-02-13 | 13F/A | 360 Financial, Inc. | 72.085 | 14.887 | ||||||
| 2026-02-17 | 13F | Two Sigma Investments, Lp | 42.700 | 277,88 | 8.818 | 335,46 | ||||
| 2026-01-06 | 13F | Davis Investment Partners, LLC | 4.700 | 0,00 | 976 | 12,06 | ||||
| 2026-02-04 | 13F | Mascoma Wealth Management LLC | 98 | 0,00 | 20 | 17,65 | ||||
| 2026-01-21 | 13F | Hartford Financial Management Inc. | 29.155 | -1,10 | 6.021 | 13,93 | ||||
| 2026-02-17 | 13F | Jones Financial Companies Lllp | 9.015 | 4,24 | 1.862 | 22,68 | ||||
| 2026-02-11 | 13F | Cedar Mountain Advisors, LLC | 90 | 0,00 | 19 | 12,50 | ||||
| 2026-02-05 | 13F | Stephens Inc /ar/ | 1.494 | 0,00 | 309 | 15,36 | ||||
| 2026-01-06 | 13F | RDA Financial Network | 1.217 | -1,22 | 251 | 14,09 | ||||
| 2026-01-14 | 13F | Barnes Dennig Private Wealth Management LLC | 50 | 0,00 | 10 | 25,00 | ||||
| 2026-01-29 | 13F | RMG Wealth Management LLC | 0 | -100,00 | 0 | |||||
| 2026-02-06 | 13F | HighTower Advisors, LLC | 19.709 | 4,68 | 4.070 | 20,56 | ||||
| 2026-02-11 | 13F | Ameritas Investment Partners, Inc. | 125 | 26 | ||||||
| 2026-01-26 | 13F | Sather Financial Group Inc | 1.000 | 207 | ||||||
| 2026-01-15 | 13F | Nilsine Partners, LLC | 5.240 | 1.082 | ||||||
| 2026-02-10 | 13F/A | Northwestern Mutual Wealth Management Co | 13.568 | 5,08 | 2.802 | 21,04 | ||||
| 2026-02-10 | 13F | IFG Advisory, LLC | 3.192 | 659 | ||||||
| 2026-02-13 | 13F | Stifel Financial Corp | 60.446 | 16,38 | 12.484 | 34,05 | ||||
| 2026-02-13 | 13F | Pine Valley Investments Ltd Liability Co | 3.243 | -4,25 | 670 | 10,21 | ||||
| 2026-02-17 | 13F | Bank Of America Corp /de/ | 190.106 | 0,48 | 39.261 | 15,74 | ||||
| 2026-02-17 | 13F | Ameriprise Financial Inc | 45.546 | -0,26 | 9.412 | 14,95 | ||||
| 2026-01-29 | 13F | UBS Group AG | 187.088 | 16,72 | 38.637 | 34,45 | ||||
| 2026-02-11 | 13F | Jpmorgan Chase & Co | 13.718 | 4,29 | 2.833 | 20,14 | ||||
| 2026-02-10 | 13F | CIBC World Markets Inc. | 3.129 | 10,37 | 646 | 27,17 | ||||
| 2026-02-12 | 13F | Brinker Capital Investments, LLC | 6.016 | 11,84 | 1.243 | 28,84 | ||||
| 2026-02-17 | 13F | LaSalle St. Investment Advisors, LLC | 1.130 | 0 | ||||||
| 2026-02-03 | 13F | Kingstone Capital Partners Texas, LLC | 1.552 | 0,00 | 321 | 15,47 | ||||
| 2026-02-13 | 13F | SRS Capital Advisors, Inc. | 1.591 | 329 | ||||||
| 2026-02-17 | 13F | Tower Research Capital LLC (TRC) | 0 | -100,00 | 0 | |||||
| 2026-01-07 | 13F | Harbor Investment Advisory, Llc | 615 | 0,00 | 127 | 15,45 | ||||
| 2026-02-17 | 13F | Wiley Bros.-aintree Capital, Llc | 6.430 | -2,69 | 1.320 | 11,49 | ||||
| 2026-01-05 | 13F | Park Avenue Securities Llc | 4.179 | -2,61 | 1 | |||||
| 2026-02-17 | 13F | Creative Planning | 3.755 | -15,35 | 775 | -2,52 | ||||
| 2026-02-03 | 13F | RFG Advisory, LLC | 982 | 203 | ||||||
| 2025-10-07 | 13F | Salem Investment Counselors Inc | 0 | -100,00 | 0 | |||||
| 2026-02-04 | 13F | Pensionmark Financial Group, Llc | 7.917 | -1,93 | 1.546 | 6,77 | ||||
| 2026-02-04 | 13F | Summit Wealth Group Llc / Co | 2.015 | 416 | ||||||
| 2026-02-03 | 13F | RWM Asset Management, LLC | 1.938 | 0,00 | 426 | 22,48 | ||||
| 2026-01-08 | 13F | Maridea Wealth Management LLC | 1.107 | -1,42 | 229 | 7,55 | ||||
| 2026-02-10 | 13F | Envestnet Asset Management Inc | 114.657 | -5,18 | 23.679 | 9,22 | ||||
| 2026-01-26 | 13F | Merit Financial Group, LLC | 3.879 | 801 | ||||||
| 2026-02-05 | 13F | Bessemer Group Inc | 600 | 0,00 | 0 | |||||
| 2026-01-30 | 13F | Archer Investment Corp | 10 | 0,00 | 2 | 100,00 | ||||
| 2026-01-21 | 13F | Capital Investment Advisory Services, LLC | 302 | 66,85 | 62 | 93,75 | ||||
| 2026-01-27 | 13F | Fortis Capital Advisors, LLC | 1.388 | 287 | ||||||
| 2026-01-29 | 13F | Comerica Bank | 1.435 | -0,90 | 296 | 14,29 | ||||
| 2026-02-12 | 13F | Bank Of Montreal /can/ | 397 | -70,85 | 83 | -65,98 | ||||
| 2026-01-06 | 13F | WealthCare Investment Partners, LLC | 1.476 | 0,00 | 307 | 12,09 | ||||
| 2026-01-15 | 13F | Trust Co | 14 | 3 | ||||||
| 2026-02-12 | 13F | BlackRock, Inc. | 2.774 | 0,00 | 573 | 15,09 | ||||
| 2026-01-22 | 13F | Mechanics Financial Corp | 122 | 0,00 | 25 | 19,05 | ||||
| 2026-02-18 | 13F | Beacon Pointe Advisors, LLC | 7.563 | -0,18 | 1.562 | 14,95 | ||||
| 2026-02-11 | 13F | Hilton Head Capital Partners, LLC | 104 | 21 | ||||||
| 2026-01-14 | 13F | EdgeRock Capital LLC | 1.778 | 57,62 | 367 | 81,68 | ||||
| 2026-02-20 | 13F | Sunbelt Securities, Inc. | 81 | 0,00 | 17 | 14,29 | ||||
| 2026-02-06 | 13F | Global Retirement Partners, LLC | 0 | -100,00 | 0 | |||||
| 2026-02-13 | 13F | Wells Fargo & Company/mn | 188.584 | 2,72 | 38.947 | 18,32 | ||||
| 2026-02-17 | 13F | MGB Wealth Management, LLC | 1.479 | 0,00 | 305 | 15,09 | ||||
| 2026-02-05 | 13F | Sequent Planning LLC | 1.100 | 227 | ||||||
| 2026-01-28 | 13F | Financial Perspectives, Inc | 148 | 0,00 | 31 | 15,38 | ||||
| 2026-02-05 | 13F | Western Wealth Management, LLC | 4.739 | 304,70 | 979 | 367,94 | ||||
| 2026-02-13 | 13F | Avenir Tech Ltd | 1 | 0,00 | 0 | |||||
| 2026-02-17 | 13F | Captrust Financial Advisors | 3.703 | -1,52 | 765 | 13,35 | ||||
| 2026-02-05 | 13F | Tucker Asset Management Llc | 417 | 51,64 | 86 | 75,51 | ||||
| 2026-02-02 | 13F | Robertson Stephens Wealth Management, LLC | 4.118 | 2,87 | 850 | 18,55 | ||||
| 2026-01-16 | 13F | First Community Trust Na | 26 | 5 | ||||||
| 2026-02-12 | 13F | Adviser Investments LLC | 4.263 | 0,00 | 880 | 15,18 | ||||
| 2026-01-20 | 13F | Thurston, Springer, Miller, Herd & Titak, Inc. | 83 | 260,87 | 17 | 325,00 | ||||
| 2026-02-13 | 13F | Jacobi Capital Management LLC | 1.399 | 289 | ||||||
| 2026-01-30 | 13F | North Star Investment Management Corp. | 75 | 0,00 | 15 | 15,38 | ||||
| 2026-02-05 | 13F | Cambridge Investment Research Advisors, Inc. | 38.161 | 3,20 | 8 | 16,67 | ||||
| 2026-02-17 | 13F | National Asset Management, Inc. | 12.756 | 18,89 | 2.634 | 36,97 | ||||
| 2026-02-05 | 13F | Plante Moran Financial Advisors, LLC | 37 | 0,00 | 8 | 16,67 | ||||
| 2026-02-13 | 13F | Commerce Bank | 1.000 | 207 | ||||||
| 2026-01-07 | 13F | Puff Wealth Management, Llc | 1.134 | 0,00 | 236 | 15,76 | ||||
| 2026-02-11 | 13F | Capital Analysts, Inc. | 101 | -38,04 | 0 | |||||
| 2026-01-21 | 13F | Stonebridge Financial Group, LLC | 71.346 | 14.734 | ||||||
| 2026-02-11 | 13F | Parallel Advisors, LLC | 13 | 0,00 | 3 | 0,00 | ||||
| 2026-02-12 | 13F | Oder Investment Management, LLC | 3.164 | 0,00 | 653 | 15,17 | ||||
| 2026-02-03 | 13F | Fsb Premier Wealth Management, Inc. | 1.067 | -6,16 | 220 | 8,37 | ||||
| 2026-02-05 | 13F | Atria Investments Llc | 5.767 | -0,93 | 1.191 | 14,09 | ||||
| 2026-03-25 | 13F/A | Lifetime Wealth Management P.C. | 1.026 | 212 | ||||||
| 2025-10-23 | 13F | Spire Wealth Management | 0 | -100,00 | 0 | |||||
| 2026-02-10 | 13F | Ritter Daniher Financial Advisory LLC / DE | 135 | 28 | ||||||
| 2026-01-05 | 13F | GAMMA Investing LLC | 460 | -18,73 | 95 | -6,93 | ||||
| 2026-01-23 | 13F | DHJJ Financial Advisors, Ltd. | 295 | -1,34 | 61 | 13,21 | ||||
| 2026-02-02 | 13F | New England Capital Financial Advisors LLC | 97 | 0,00 | 20 | 11,76 | ||||
| 2026-02-05 | 13F | Pacific Sun Financial Corp | 7.483 | -5,58 | 1.545 | 8,80 | ||||
| 2026-01-26 | 13F | Wealth Effects Llc | 2.585 | -3,72 | 534 | 10,81 | ||||
| 2026-02-10 | 13F | REAP Financial Group, LLC | 977 | -12,22 | 202 | 1,01 | ||||
| 2026-02-06 | 13F | McKinley Carter Wealth Services, Inc. | 6.312 | -3,15 | 1.304 | 11,56 | ||||
| 2026-01-26 | 13F | Private Trust Co Na | 301 | 290,91 | 62 | 376,92 | ||||
| 2026-02-11 | 13F | Fortune Financial Group, Inc. | 1.303 | 0 | ||||||
| 2025-10-15 | 13F | Atwood & Palmer Inc | 0 | -100,00 | 0 | |||||
| 2026-02-03 | 13F | Navellier & Associates Inc | 8.402 | -27,93 | 1.735 | -16,99 | ||||
| 2026-01-20 | 13F | RPG Investment Advisory, LLC | 23.647 | -0,00 | 4.884 | 15,19 | ||||
| 2026-02-12 | 13F | Principal Securities, Inc. | 0 | -100,00 | 0 | |||||
| 2026-02-17 | 13F | Main Street Financial Solutions, LLC | 1.184 | -0,59 | 245 | 14,55 | ||||
| 2026-02-17 | 13F | Coppell Advisory Solutions LLC | 2.731 | -2,08 | 572 | 16,02 | ||||
| 2026-02-13 | 13F | Integrated Wealth Concepts LLC | 1.169 | -95,96 | 241 | -95,36 | ||||
| 2026-02-06 | 13F | Pnc Financial Services Group, Inc. | 894 | 0,00 | 185 | 15,00 | ||||
| 2026-01-29 | 13F | Resonant Capital Advisors, LLC | 975 | 201 | ||||||
| 2026-02-13 | 13F | Mml Investors Services, Llc | 3.226 | 27,21 | 666 | 46,70 | ||||
| 2026-02-17 | 13F | Ameriflex Group, Inc. | 206 | -45,79 | 43 | -38,24 | ||||
| 2026-02-02 | 13F | Truist Financial Corp | 55.228 | 21,83 | 11.406 | 40,33 | ||||
| 2026-02-13 | 13F | Citigroup Inc | 13.840 | 7,80 | 2.858 | 24,21 | ||||
| 2025-11-12 | 13F | Headlands Technologies LLC | 0 | -100,00 | 0 | |||||
| 2026-02-11 | 13F | Cerity Partners LLC | 4.249 | -9,65 | 878 | 4,03 | ||||
| 2026-02-09 | 13F | Hartland & Co., LLC | 1.179 | 0,00 | 243 | 15,17 | ||||
| 2026-02-13 | 13F | Pacific Center for Financial Services | 52 | 0,00 | 9 | 0,00 | ||||
| 2026-02-02 | 13F | Benjamin Edwards Inc | 30.480 | -3,58 | 6.302 | 11,05 | ||||
| 2025-11-14 | 13F | Two Sigma Securities, Llc | 0 | -100,00 | 0 | |||||
| 2026-02-11 | 13F | Franklin Resources Inc | 89 | 0,00 | 18 | 20,00 | ||||
| 2026-01-12 | 13F | Arlington Financial Advisors, LLC | 27.620 | 0,29 | 5.704 | 15,54 | ||||
| 2026-01-29 | 13F | Quest 10 Wealth Builders, Inc. | 16 | 0,00 | 3 | 50,00 | ||||
| 2026-01-05 | 13F | GoalVest Advisory LLC | 4.663 | 0,00 | 963 | 15,19 | ||||
| 2026-01-13 | 13F | CoreCap Advisors, LLC | 136 | -28,80 | 28 | -17,65 | ||||
| 2026-02-10 | 13F | Tidemark, LLC | 85 | 0,00 | 18 | 13,33 | ||||
| 2025-11-14 | 13F | Equitable Holdings, Inc. | 0 | -100,00 | 0 | |||||
| 2026-02-06 | 13F | IFP Advisors, Inc | 12.199 | 14,81 | 2.519 | 32,30 | ||||
| 2026-01-28 | 13F | Geneos Wealth Management Inc. | 530 | 0,00 | 109 | 14,74 | ||||
| 2026-01-07 | 13F | Holistic Financial Partners | 18.707 | 1,67 | 3.863 | 17,13 | ||||
| 2026-01-27 | 13F | Berger Financial Group, Inc | 114.950 | -0,47 | 23.739 | 14,64 | ||||
| 2026-02-13 | 13F | Twin City Private Wealth, Llc | 0 | -100,00 | 0 | |||||
| 2026-02-13 | 13F | Resources Investment Advisors, LLC. | 1.672 | 345 | ||||||
| 2026-02-17 | 13F | North Capital, Inc. | 0 | -100,00 | 0 | |||||
| 2026-02-10 | 13F | Texas Yale Capital Corp. | 9.300 | 0,00 | 1.921 | 15,18 | ||||
| 2026-02-17 | 13F | Modern Wealth Management, LLC | 41.578 | 1,21 | 8.587 | 16,58 | ||||
| 2025-11-07 | 13F | Beacon Capital Management, LLC | 0 | -100,00 | 0 | |||||
| 2026-02-04 | 13F | Ameritas Advisory Services, LLC | 29.901 | 12.410,88 | 6.175 | 14.602,38 | ||||
| 2026-02-11 | 13F | Janney Montgomery Scott LLC | 70.054 | 139,09 | 14 | 180,00 | ||||
| 2026-01-09 | 13F | First Heartland Consultants, Inc. | 3.240 | 5,37 | 669 | 21,42 | ||||
| 2026-02-03 | 13F | Koshinski Asset Management, Inc. | 2.239 | -13,82 | 462 | -0,65 | ||||
| 2026-01-23 | 13F | Webster Bank, N. A. | 238 | 0,00 | 49 | 16,67 | ||||
| 2026-02-06 | 13F | Addison Advisors LLC | 41 | 0,00 | 8 | 14,29 | ||||
| 2026-02-09 | 13F | Harbour Investments, Inc. | 6.364 | 11,55 | 1.314 | 28,57 | ||||
| 2026-02-12 | 13F | Jane Street Group, Llc | 6.347 | -48,29 | 1.311 | -40,45 | ||||
| 2026-02-03 | 13F | NewEdge Wealth, LLC | 8.458 | -1,32 | 1.747 | 3,93 | ||||
| 2026-02-17 | 13F | Signature Equity Partners, LLC | 128 | 26 | ||||||
| 2026-02-17 | 13F | Russell Investments Group, Ltd. | 160 | 0,00 | 33 | 17,86 | ||||
| 2025-10-20 | 13F | Yarbrough Capital, LLC | 0 | -100,00 | 0 | |||||
| 2026-02-05 | 13F | Pinnacle Associates Ltd | 4.425 | -4,32 | 914 | 10,13 | ||||
| 2026-01-28 | 13F | Hoey Investments, Inc | 15 | 0,00 | 3 | 50,00 | ||||
| 2026-01-26 | 13F | Mirae Asset Global Investments Co., Ltd. | 14.000 | 2.891 | ||||||
| 2026-02-13 | 13F | Pinnacle Wealth Planning Services, Inc. | 77 | 16 | ||||||
| 2026-02-17 | 13F | IHT Wealth Management, LLC | 1.273 | -3,78 | 263 | 10,55 | ||||
| 2026-01-28 | 13F | Davis Capital Management | 22 | 0,00 | 5 | 33,33 | ||||
| 2026-02-19 | 13F | CI Private Wealth, LLC | 23.962 | 593,55 | 707 | 14,22 | ||||
| 2026-02-13 | 13F | Glen Eagle Advisors, LLC | 30 | 0,00 | 6 | 20,00 | ||||
| 2025-11-14 | 13F | Brass Tax Wealth Management, Inc | 1.712 | 0,00 | 307 | 10,87 | ||||
| 2026-02-04 | 13F | Tsfg, Llc | 441 | 0,00 | 0 | |||||
| 2026-01-20 | 13F | Independence Bank of Kentucky | 200 | 0,00 | 41 | 17,14 | ||||
| 2026-01-23 | 13F/A | HF Advisory Group, LLC | 1.437 | 4,51 | 297 | 20,33 | ||||
| 2026-01-27 | 13F | Morey & Quinn Wealth Partners, LLC | 3.391 | 2,20 | 700 | 17,85 | ||||
| 2025-11-07 | 13F | Synovus Financial Corp | 2.096 | -1,78 | 376 | 9,01 | ||||
| 2026-01-26 | 13F | Whittier Trust Co Of Nevada Inc | 85 | 0,00 | 18 | 12,50 | ||||
| 2026-02-06 | 13F | Covestor Ltd | 13 | 0,00 | 0 | |||||
| 2026-02-11 | 13F | MCF Advisors LLC | 120 | 0,00 | 25 | 14,29 | ||||
| 2026-02-13 | 13F | Wbi Investments, Inc. | 5.856 | 29,36 | 1.209 | 49,08 | ||||
| 2026-02-09 | 13F | Keating Financial Advisory Services, Inc. | 2.715 | 561 | ||||||
| 2026-02-13 | 13F | First Trust Advisors Lp | 7.064 | -15,08 | 1.459 | -2,08 | ||||
| 2026-01-08 | 13F | Wealth Enhancement Advisory Services, Llc | 10.490 | -2,60 | 2.250 | 11,67 | ||||
| 2026-02-03 | 13F | Apeiron RIA LLC | 2.091 | -1,32 | 448 | 15,17 | ||||
| 2026-02-06 | 13F | Envestnet Portfolio Solutions, Inc. | 1.170 | 242 | ||||||
| 2026-02-17 | 13F | Ancora Advisors, LLC | 9.141 | 0,00 | 1.888 | 15,20 | ||||
| 2026-02-17 | 13F | Qube Research & Technologies Ltd | 96 | -37,25 | 20 | -29,63 | ||||
| 2026-01-30 | 13F | Wagner Wealth Management, Llc | 177 | 0,00 | 37 | 16,13 | ||||
| 2026-02-12 | 13F | Titleist Asset Management, Llc | 1.657 | 342 | ||||||
| 2026-01-26 | 13F | Harbor Asset Planning, Inc. | 77 | 0,00 | 16 | 15,38 | ||||
| 2026-02-17 | 13F | Pinnacle Family Advisors, LLC | 4.028 | -1,66 | 832 | 13,22 | ||||
| 2026-01-27 | 13F | TD Waterhouse Canada Inc. | 28.849 | -3,05 | 5.933 | 7,79 | ||||
| 2026-01-21 | 13F | BIP Wealth, LLC | 2.612 | 539 | ||||||
| 2026-01-20 | 13F | Stratos Wealth Advisors, LLC | 1.329 | 275 | ||||||
| 2026-01-27 | 13F | PFG Advisors | 0 | -100,00 | 0 | -100,00 | ||||
| 2026-02-13 | 13F | Perryman Financial Advisory Inc /ad | 1.756 | 363 | ||||||
| 2026-01-29 | 13F | Concurrent Investment Advisors, LLC | 2.238 | 40,40 | 462 | 62,11 | ||||
| 2026-01-20 | 13F | Tritonpoint Wealth, Llc | 2.280 | 0,00 | 471 | 15,20 | ||||
| 2026-02-13 | 13F | C M Bidwell & Associates Ltd | 75 | 0,00 | 15 | 15,38 | ||||
| 2026-02-13 | 13F | Aptus Capital Advisors, LLC | 347 | 17.250,00 | 72 | |||||
| 2026-01-27 | 13F | Belpointe Asset Management LLC | 2.590 | 115,47 | 535 | 148,37 | ||||
| 2026-02-03 | 13F | Sequoia Financial Advisors, LLC | 1.625 | 0,00 | 336 | 15,12 | ||||
| 2026-02-12 | 13F | Wealthspire Advisors, LLC | 0 | -100,00 | 0 | |||||
| 2026-01-21 | 13F | Sowell Financial Services LLC | 2.081 | 24,31 | 430 | 43,00 | ||||
| 2026-01-28 | 13F | Gentry Private Wealth, Llc | 4.663 | 0,00 | 963 | 15,19 | ||||
| 2026-01-29 | 13F | Dunhill Financial, LLC | 9 | 0,00 | 2 | 0,00 | ||||
| 2026-02-02 | 13F | PKS Advisory Services, LLC | 2.148 | 22,39 | 444 | 41,08 | ||||
| 2026-02-04 | 13F | Independent Advisor Alliance | 0 | -100,00 | 0 | |||||
| 2026-02-06 | 13F | Lloyd Advisory Services, LLC. | 2 | 0 | ||||||
| 2026-02-12 | 13F | Summit Financial, LLC | 2.491 | -5,43 | 514 | 8,90 | ||||
| 2026-02-13 | 13F | Luminist Capital LLC | 1 | 0,00 | 0 | |||||
| 2026-01-20 | 13F | Cornell Pochily Investment Advisors, Inc. | 1.064 | 220 | ||||||
| 2026-02-17 | 13F | Raymond James Financial Inc | 145.659 | 5,90 | 30.081 | 21,98 | ||||
| 2026-02-12 | 13F | Great Valley Advisor Group, Inc. | 1.932 | -49,40 | 399 | -41,67 | ||||
| 2026-01-29 | 13F | Nbc Securities, Inc. | 930 | 1,86 | 192 | 17,79 | ||||
| 2026-02-03 | 13F | American Financial Advisors, LLC | 1.951 | 0,00 | 403 | 15,19 | ||||
| 2025-11-24 | 13F | CIBC Private Wealth Group, LLC | 0 | -100,00 | 0 | -100,00 | ||||
| 2026-02-10 | 13F | Shepherd Financial Partners LLC | 1.532 | 0,00 | 316 | 15,33 | ||||
| 2025-11-04 | 13F | Atlantic Union Bankshares Corp | 0 | -100,00 | 0 | |||||
| 2026-01-26 | 13F | Strid Group, LLC | 1.000 | 207 | ||||||
| 2026-02-18 | 13F | Pacific Excel Wealth Advisors, Inc. | 3.135 | 647 | ||||||
| 2026-02-17 | 13F | Citadel Advisors Llc | 0 | -100,00 | 0 | |||||
| 2026-02-10 | 13F | Bank of New York Mellon Corp | 7.688 | 2,14 | 1.588 | 17,64 | ||||
| 2026-02-17 | 13F | Warren Averett Asset Management, LLC | 2.530 | 523 | ||||||
| 2026-02-10 | 13F | Twin Peaks Wealth Advisors, LLC | 1.930 | -6,04 | 409 | 11,14 | ||||
| 2026-02-04 | 13F | Meridian Wealth Management, LLC | 3.498 | -1,52 | 722 | 13,52 | ||||
| 2026-02-17 | 13F | Citadel Advisors Llc | Call | 1.000 | -33,33 | 207 | -23,13 | |||
| 2026-01-30 | 13F | Us Bancorp \de\ | 41 | 105,00 | 8 | 166,67 | ||||
| 2026-02-06 | 13F | Forefront Wealth Partners, LLC | 6.112 | 19,26 | 1.262 | 37,47 | ||||
| 2026-01-20 | 13F | Signaturefd, Llc | 235 | 30,56 | 49 | 50,00 | ||||
| 2025-11-12 | 13F | Transce3nd, LLC | 0 | -100,00 | 0 | |||||
| 2026-01-26 | 13F | Iams Wealth Management, Llc | 4.647 | -18,87 | 960 | -6,53 | ||||
| 2026-02-12 | 13F | Commonwealth Equity Services, Llc | 22.417 | -21,23 | 4.629 | 92.480,00 | ||||
| 2026-02-05 | 13F | 1st Source Bank | 3.747 | -0,27 | 774 | 14,86 | ||||
| 2026-02-06 | 13F | Quantum Private Wealth, LLC | 3.572 | -0,72 | 738 | 14,26 | ||||
| 2026-02-12 | 13F | Wedbush Securities Inc | 1.086 | 0 | ||||||
| 2026-02-12 | 13F | Founders Financial Alliance, LLC | 0 | -100,00 | 0 | |||||
| 2026-02-10 | 13F | Founders Financial Securities Llc | 1.184 | 245 | ||||||
| 2026-01-23 | 13F | HBW Advisory Services LLC | 2.512 | 519 | ||||||
| 2026-01-20 | 13F | Global Trust Asset Management, LLC | 80 | 0,00 | 17 | 14,29 | ||||
| 2026-02-10 | 13F | SFI Advisors, LLC | 23.006 | -0,75 | 4.751 | 14,34 | ||||
| 2026-02-06 | 13F | Creative Financial Designs Inc /adv | 334 | 0,60 | 69 | 16,95 | ||||
| 2026-02-02 | 13F | Mutual Advisors, LLC | 5.479 | -0,02 | 1.132 | 9,06 | ||||
| 2026-02-11 | 13F | Simplex Trading, Llc | 78 | 16 | ||||||
| 2025-11-03 | 13F | Private Wealth Asset Management, LLC | 0 | -100,00 | 0 | |||||
| 2026-01-20 | 13F | Stratos Wealth Partners, LTD. | 1.390 | 0,00 | 287 | 15,26 | ||||
| 2026-02-13 | 13F | Morgan Stanley | 401.201 | 18,19 | 82.856 | 36,14 | ||||
| 2026-01-29 | 13F | D.a. Davidson & Co. | 49.772 | 26,61 | 10.279 | 45,85 | ||||
| 2026-02-03 | 13F | Emerald Investment Partners, Llc | 4.817 | 0,65 | 995 | 15,85 | ||||
| 2026-02-10 | 13F | Measured Wealth Private Client Group, LLC | 189 | -44,41 | 39 | -35,00 | ||||
| 2026-01-28 | 13F | Diversified Enterprises, LLC | 2.417 | 0,00 | 499 | 15,24 | ||||
| 2026-01-07 | 13F | Lake Street Financial Llc | 3.662 | 0,19 | 756 | 15,42 | ||||
| 2026-01-23 | 13F | Assetmark, Inc | 46.560 | 14,84 | 9.616 | 32,29 | ||||
| 2025-11-14 | 13F | Moors & Cabot, Inc. | 0 | -100,00 | 0 | -100,00 | ||||
| 2026-02-17 | 13F | Prosperity Consulting Group, LLC | 2.854 | 589 | ||||||
| 2026-02-05 | 13F | Park Square Financial Group, LLC | 288 | 372,13 | 48 | 370,00 | ||||
| 2026-01-21 | 13F | Sound Income Strategies, LLC | 2.594 | 259.300,00 | 548 | |||||
| 2026-02-13 | 13F | Toroso Investments, LLC | 1.000 | 207 | ||||||
| 2026-02-17 | 13F | Snowden Capital Advisors LLC | 6.661 | -6,71 | 1.376 | 7,42 | ||||
| 2026-01-27 | 13F | Juncture Wealth Strategies, Llc | 10.627 | -1,57 | 2.195 | 13,39 | ||||
| 2026-02-17 | 13F | Blair William & Co/il | 318 | -20,10 | 66 | -8,45 | ||||
| 2026-02-09 | 13F | Eukles Asset Management | 186 | -12,26 | 38 | 0,00 | ||||
| 2026-02-12 | 13F | Steward Partners Investment Advisory, Llc | 2.466 | 0,65 | 509 | 15,95 |