Grundlæggende statistik
| Institutionelle aktier (lange) | 48.282.401 - 59,63% (ex 13D/G) - change of -14,18MM shares -22,44% MRQ |
| Institutionel værdi (lang) | $ 468.995 USD ($1000) |
Institutionelt ejerskab og aktionærer
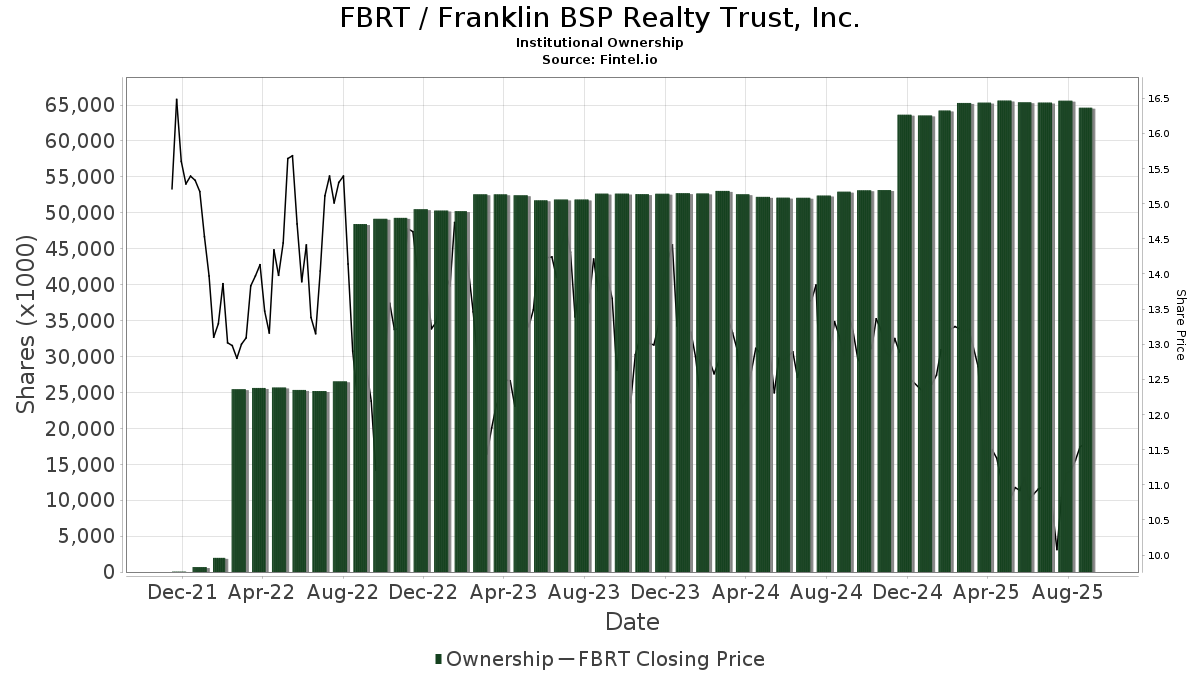
Franklin BSP Realty Trust, Inc. (US:FBRT) har 209 institutionelle ejere og aktionærer, der har indsendt 13D/G- eller 13F-formularer til Securities Exchange Commission (SEC). Disse institutioner har i alt 48,282,401 aktier. Største aktionærer omfatter BlackRock, Inc., Vanguard Group Inc, State Street Corp, Geode Capital Management, Llc, Invesco Ltd., Franklin Resources Inc, Charles Schwab Investment Management Inc, MIRAE ASSET GLOBAL ETFS HOLDINGS Ltd., UBS Group AG, and Gratia Capital, Llc .
Franklin BSP Realty Trust, Inc. (NYSE:FBRT) institutionel ejerskabsstruktur viser aktuelle positioner i virksomheden efter institutioner og fonde, samt seneste ændringer i positionsstørrelse. Større aktionærer kan omfatte individuelle investorer, investeringsforeninger, hedgefonde eller institutioner. Skema 13D angiver, at investoren besidder (eller besidder) mere end 5 % af virksomheden og har til hensigt (eller har til hensigt at) aktivt at forfølge en ændring i forretningsstrategi. Skema 13G indikerer en passiv investering på over 5%.
The share price as of March 27, 2026 is 8,35 / share. Previously, on March 31, 2025, the share price was 12,74 / share. This represents a decline of 34,46% over that period.
Fondens stemningsscore
Fund Sentiment Score (fka Ownership Accumulation Score) finder de aktier, der bliver mest købt af fonde. Det er resultatet af en sofistikeret, multi-faktor kvantitativ model, der identificerer virksomheder med de højeste niveauer af institutionel akkumulering. Scoringsmodellen bruger en kombination af den samlede stigning i oplyste ejere, ændringerne i porteføljeallokeringer i disse ejere og andre målinger. Tallet går fra 0 til 100, hvor højere tal indikerer et højere niveau af akkumulering for sine jævnaldrende, og 50 er gennemsnittet.
Opdateringsfrekvens: Dagligt
Se Ownership Explorer, som giver en liste over højest rangerende virksomheder.
AI+ Ask Fintel’s AI assistant about Franklin BSP Realty Trust, Inc..
Select a question to share a public post with an AI-crafted answer.
Thinking of good questions…
Institutionel Put/Call-forhold
Ud over at indberette standardaktie- og gældsudstedelser skal institutter med mere end 100 mill. aktiver under forvaltning også oplyse deres put- og call-optionsbeholdninger. Da salgsoptioner generelt indikerer negativ stemning, og købsoptioner indikerer positiv stemning, kan vi få en fornemmelse af den overordnede institutionelle stemning ved at plotte forholdet mellem put og kald. Diagrammet til højre viser det historiske put/call-forhold for dette instrument.
Brug af Put/Call Ratio som en indikator for investorernes stemning overvinder en af de vigtigste mangler ved at bruge totalt institutionelt ejerskab, som er, at en betydelig mængde af aktiver under forvaltning investeres passivt for at spore indekser. Passivt forvaltede fonde køber typisk ikke optioner, så indikatoren for put/call-forholdet følger mere nøje følelsen af aktivt forvaltede fonde.

13D/G-arkivering
Vi præsenterer 13D/G ansøgninger separat fra 13F ansøgninger på grund af den forskellige behandling af SEC. 13D/G-ansøgninger kan indgives af grupper af investorer (med én ledende), hvorimod 13F-ansøgninger ikke kan. Dette resulterer i situationer, hvor en investor kan indsende en 13D/G, der rapporterer én værdi for de samlede aktier (der repræsenterer alle de aktier, der ejes af investorgruppen), men derefter indsender en 13F, der rapporterer en anden værdi for de samlede aktier (der udelukkende repræsenterer deres egne) ejendomsret). Det betyder, at aktieejerskab af 13D/G-arkiver og 13F-arkiveringer ofte ikke er direkte sammenlignelige, så vi præsenterer dem separat.
Bemærk: Fra den 16. maj 2021 viser vi ikke længere ejere, der ikke har indsendt en 13D/G inden for det seneste år. Tidligere viste vi den fulde historie af 13D/G-arkiver. Generelt skal enheder, der er forpligtet til at indgive 13D/G-ansøgninger, indgive mindst årligt, før de indsender en afsluttende ansøgning. Dog forlader fonde nogle gange positioner uden at indsende en afsluttende ansøgning (dvs. de afvikler), så visning af den fulde historie resulterede nogle gange i forvirring om det nuværende ejerskab. For at undgå forvirring viser vi nu kun 'aktuelle' ejere - det vil sige - ejere, der har anmeldt inden for det seneste år.
Upgrade to unlock premium data.
| Fil dato | Form | Investor | Forrige Aktier |
Seneste Aktier |
Δ Aktier (Procent) |
Ejendomsret (Procent) |
Δ Ejerskab (Procent) |
|
|---|---|---|---|---|---|---|---|---|
| 2026-03-26 | VANGUARD GROUP INC | 8,925,303 | 0 | -100.00 | 0.00 | -100.00 | ||
| 2025-07-17 | BlackRock, Inc. | 14,062,648 | 13,092,272 | -6.90 | 15.90 | -7.02 |
13F og NPORT arkivering
Detaljer om 13F-arkivering er gratis. Detaljer om NP-ansøgninger kræver et premium-medlemskab. Grønne rækker angiver nye positioner. Røde rækker angiver lukkede positioner. Klik på linket ikon for at se den fulde transaktionshistorik.
Opgrader
for at låse premium-data op og eksportere til Excel ![]() .
.
| Fil dato | Kilde | Investor | Type | Gennemsnitlig pris (Øst) |
Aktier | Δ Aktier (%) |
Rapporteret Værdi ($1000) |
Δ Værdi (%) |
Port Alloc (%) |
|
|---|---|---|---|---|---|---|---|---|---|---|
| 2026-01-08 | 13F | True Wealth Design, LLC | 7 | 133,33 | 0 | |||||
| 2026-02-09 | 13F | Huntington National Bank | 2.164 | 0,00 | 22 | -8,70 | ||||
| 2026-02-05 | 13F | Thrivent Financial For Lutherans | 74.479 | 25,48 | 1 | |||||
| 2026-02-13 | 13F | BNP Paribas Asset Management Holding S.A. | 797 | 50,95 | 0 | |||||
| 2026-02-13 | 13F | Wells Fargo & Company/mn | 93.453 | 41,11 | 937 | 30,32 | ||||
| 2025-11-06 | 13F | Savvy Advisors, Inc. | 0 | -100,00 | 0 | |||||
| 2026-01-23 | 13F | Diversify Advisory Services, LLC | 25.639 | 0,00 | 264 | 1,54 | ||||
| 2026-01-23 | 13F | State of Alaska, Department of Revenue | 41.218 | -0,44 | 0 | |||||
| 2026-02-17 | 13F | Maryland State Retirement & Pension System | 11.979 | 0,00 | 120 | -7,69 | ||||
| 2026-02-17 | 13F | Graham Capital Management, L.P. | 0 | -100,00 | 0 | |||||
| 2026-02-17 | 13F | Ameriprise Financial Inc | 157.944 | 0,97 | 1.593 | -6,41 | ||||
| 2025-11-13 | 13F | Bank Of Montreal /can/ | 0 | -100,00 | 0 | |||||
| 2026-01-26 | 13F | Cwm, Llc | 23.935 | 272,82 | 0 | |||||
| 2026-02-06 | 13F | Prevail Innovative Wealth Advisors, Llc | 0 | -100,00 | 0 | |||||
| 2026-02-17 | 13F | Private Advisor Group, LLC | 21.443 | 3,84 | 215 | -4,02 | ||||
| 2026-02-09 | 13F | Endowment Wealth Management, Inc. | 18.140 | 3,33 | 182 | -4,74 | ||||
| 2026-02-09 | 13F | MTM Investment Management, LLC | 0 | -100,00 | 0 | |||||
| 2025-11-06 | 13F | Costello Asset Management, INC | 0 | -100,00 | 0 | |||||
| 2026-02-06 | 13F | IFP Advisors, Inc | 243 | -30,97 | 2 | -33,33 | ||||
| 2026-01-09 | 13F | SG Americas Securities, LLC | 37.289 | 34,71 | 0 | |||||
| 2026-02-17 | 13F | Balyasny Asset Management Llc | 13.093 | -89,68 | 131 | -90,49 | ||||
| 2025-11-12 | 13F | CIBC Bancorp USA Inc. | 10.329 | 112 | ||||||
| 2025-11-14 | 13F | Skopos Labs, Inc. | 0 | -100,00 | 0 | |||||
| 2026-02-12 | 13F | Quadrant Capital Group Llc | 0 | -100,00 | 0 | |||||
| 2026-02-13 | 13F | Prudential Financial Inc | 493.336 | 52,17 | 4.948 | 40,57 | ||||
| 2026-02-17 | 13F | Kemnay Advisory Services Inc. | 4.433 | 44 | ||||||
| 2026-02-13 | 13F | Rhumbline Advisers | 227.522 | -6,13 | 2.282 | -13,30 | ||||
| 2025-11-12 | 13F | POM Investment Strategies, LLC | 0 | -100,00 | 0 | |||||
| 2026-02-17 | 13F | Amundi | 10.083 | -27,06 | 101 | -32,21 | ||||
| 2026-02-05 | 13F | Allworth Financial LP | 65.395 | 72,66 | 656 | 59,37 | ||||
| 2026-02-11 | 13F | Jpmorgan Chase & Co | 65.468 | -23,56 | 657 | -29,46 | ||||
| 2026-02-06 | 13F | EverSource Wealth Advisors, LLC | 74 | 221,74 | 1 | |||||
| 2026-02-17 | 13F | Dark Forest Capital Management Lp | 0 | -100,00 | 0 | |||||
| 2026-02-11 | 13F | Deutsche Bank Ag\ | 71.460 | 6,96 | 717 | -1,24 | ||||
| 2026-02-17 | 13F | Two Sigma Investments, Lp | 777.483 | 145,10 | 7.798 | 126,42 | ||||
| 2026-02-13 | 13F | SRS Capital Advisors, Inc. | 89.264 | -2,93 | 895 | -10,32 | ||||
| 2026-01-30 | 13F | New York State Teachers Retirement System | 49.217 | -5,10 | 0 | |||||
| 2026-02-13 | 13F | Stifel Financial Corp | 0 | -100,00 | 0 | |||||
| 2026-02-05 | 13F | Amalgamated Bank | 23.964 | -1,46 | 0 | |||||
| 2026-01-07 | 13F | Massmutual Trust Co Fsb/adv | 0 | -100,00 | 0 | |||||
| 2026-02-13 | 13F | Public Employees Retirement Association Of Colorado | 11.811 | 0,00 | 0 | |||||
| 2026-02-02 | 13F | Strs Ohio | 14.900 | 0,00 | 149 | -7,45 | ||||
| 2026-02-11 | 13F | Illinois Municipal Retirement Fund | 43.281 | 4,16 | 434 | -3,77 | ||||
| 2026-02-18 | 13F | State of Tennessee, Treasury Department | 30.846 | -11,22 | 316 | -16,18 | ||||
| 2026-02-18 | 13F | Mackenzie Financial Corp | 0 | -100,00 | 0 | |||||
| 2026-01-15 | 13F | Brookstone Capital Management | 15.196 | 12,43 | 152 | 4,11 | ||||
| 2025-10-21 | 13F | American National Bank | 0 | -100,00 | 0 | -100,00 | ||||
| 2026-02-12 | 13F | Triumph Capital Management | 14.100 | -9,03 | 141 | -16,07 | ||||
| 2026-02-10 | 13F | Commonwealth Of Pennsylvania Public School Empls Retrmt Sys | 20.203 | -3,58 | 203 | -11,01 | ||||
| 2026-02-12 | 13F | Swiss National Bank | 162.333 | 2,33 | 1.628 | -5,46 | ||||
| 2026-02-17 | 13F | Abel Hall, LLC | 24.962 | 22,95 | 250 | 13,64 | ||||
| 2026-02-13 | 13F | Ubs Asset Management Americas Inc | 1.477 | -99,02 | 15 | -99,15 | ||||
| 2026-02-11 | 13F | Group One Trading, L.p. | 0 | -100,00 | 0 | |||||
| 2026-02-13 | 13F | Public Sector Pension Investment Board | 0 | -100,00 | 0 | |||||
| 2026-02-05 | 13F | Bessemer Group Inc | 2.787 | 618,30 | 0 | |||||
| 2026-01-28 | 13F | Universal- Beteiligungs- und Servicegesellschaft mbH | 20.846 | 28,55 | 209 | 18,75 | ||||
| 2026-02-12 | 13F | Brinker Capital Investments, LLC | 25.440 | 8,89 | 255 | 0,79 | ||||
| 2026-01-20 | 13F | GraniteShares Advisors LLC | 0 | -100,00 | 0 | |||||
| 2026-01-14 | 13F | Exchange Traded Concepts, Llc | 67.193 | -2,87 | 674 | -10,39 | ||||
| 2026-02-17 | 13F | California State Teachers Retirement System | 85.504 | -0,08 | 858 | -7,75 | ||||
| 2026-01-21 | 13F | Sound Income Strategies, LLC | 0 | -100,00 | 0 | |||||
| 2025-10-31 | 13F | Mutual Of America Capital Management Llc | 0 | -100,00 | 0 | |||||
| 2026-02-11 | 13F | Ameritas Investment Partners, Inc. | 6.841 | 69 | ||||||
| 2025-11-14 | 13F | Sofos Investments, Inc. | 0 | -100,00 | 0 | |||||
| 2026-02-09 | 13F | Legal & General Group Plc | 208.697 | -4,44 | 2.093 | -11,73 | ||||
| 2026-02-12 | 13F | Penserra Capital Management LLC | 114.208 | 16,83 | 1 | 0,00 | ||||
| 2026-02-11 | 13F | Parallel Advisors, LLC | 92 | 84,00 | 1 | |||||
| 2026-02-06 | 13F | HighTower Advisors, LLC | 18.167 | -6,02 | 182 | -12,92 | ||||
| 2026-02-13 | 13F | Gen-Wealth Partners Inc | 4.443 | -18,37 | 45 | -25,42 | ||||
| 2026-02-12 | 13F | Jane Street Group, Llc | 93.636 | -31,87 | 939 | -37,06 | ||||
| 2026-01-29 | 13F | Comerica Bank | 17.721 | -23,72 | 178 | -29,76 | ||||
| 2026-02-13 | 13F | Retirement Financial Solutions, Llc | 0 | -100,00 | 0 | |||||
| 2026-02-09 | 13F | Hantz Financial Services, Inc. | 944 | 421,55 | 0 | |||||
| 2026-02-12 | 13F | Concorde Asset Management, LLC | 16.400 | -2,38 | 164 | -10,38 | ||||
| 2026-02-13 | 13F | Y-Intercept (Hong Kong) Ltd | 12.027 | 121 | ||||||
| 2026-02-18 | 13F | Garton & Associates Financial Advisors LLC | 329 | 3 | ||||||
| 2026-02-13 | 13F | Citigroup Inc | 53.035 | -26,96 | 532 | -32,61 | ||||
| 2025-11-12 | 13F | Transce3nd, LLC | 0 | -100,00 | 0 | -100,00 | ||||
| 2026-02-17 | 13F | Cresset Asset Management, LLC | 20.131 | 0,00 | 209 | -7,11 | ||||
| 2026-02-17 | 13F | Prelude Capital Management, Llc | 40.135 | 403 | ||||||
| 2025-11-04 | 13F | AXS Investments LLC | 0 | -100,00 | 0 | |||||
| 2026-02-13 | 13F/A | Texas Permanent School Fund | 0 | -100,00 | 0 | |||||
| 2026-02-12 | 13F | Wealthspire Advisors, LLC | 0 | -100,00 | 0 | |||||
| 2026-02-06 | 13F | Lsv Asset Management | 0 | -100,00 | 0 | |||||
| 2026-02-03 | 13F | Bokf, Na | 4.508 | 0,00 | 45 | -6,25 | ||||
| 2026-02-05 | 13F | High Note Wealth, LLC | 260 | 3 | ||||||
| 2026-02-03 | 13F | Kingstone Capital Partners Texas, LLC | 29.866 | 300 | ||||||
| 2026-02-06 | 13F | Condor Capital Management | 344.859 | -27,08 | 3.459 | -32,66 | ||||
| 2026-02-17 | 13F | SageView Advisory Group, LLC | 3.026 | 30 | ||||||
| 2026-02-12 | 13F | Cibc World Markets Corp | 0 | -100,00 | 0 | |||||
| 2026-02-10 | 13F | Intech Investment Management Llc | 72.541 | 130,28 | 728 | 112,57 | ||||
| 2026-02-13 | 13F | Barclays Plc | 135.101 | 10,20 | 1.355 | 1,80 | ||||
| 2026-02-19 | 13F | Invesco Ltd. | 1.829.401 | 72,17 | 18.349 | 59,01 | ||||
| 2026-02-12 | 13F | BlackRock, Inc. | 13.095.460 | 0,94 | 131.347 | -6,78 | ||||
| 2026-02-10 | 13F | Rothschild Investment Llc | 499 | -20,29 | 5 | -16,67 | ||||
| 2026-01-05 | 13F | Miller Global Investments, LLC | 39.260 | 394 | ||||||
| 2026-02-13 | 13F | Quarry LP | 96 | -82,89 | 1 | -100,00 | ||||
| 2026-02-17 | 13F | Gotham Asset Management, LLC | 0 | -100,00 | 0 | |||||
| 2026-02-05 | 13F | Disciplined Investments, LLC | 12.000 | 120 | ||||||
| 2026-02-13 | 13F | Centaurus Financial, Inc. | 16.829 | -3,93 | 0 | |||||
| 2026-02-12 | 13F | MetLife Investment Management, LLC | 46.767 | -4,05 | 469 | -11,34 | ||||
| 2025-10-22 | 13F | Commonwealth Equity Services, Llc | 0 | -100,00 | 0 | |||||
| 2026-02-13 | 13F | Landscape Capital Management, L.l.c. | 11.625 | 117 | ||||||
| 2026-02-17 | 13F | Caption Management, LLC | Call | 0 | -100,00 | 0 | ||||
| 2026-01-07 | 13F | Magnus Financial Group LLC | 38.416 | 0,00 | 385 | -7,67 | ||||
| 2026-02-06 | 13F | Pnc Financial Services Group, Inc. | 9.574 | 16,64 | 96 | 7,87 | ||||
| 2026-01-13 | 13F | Mather Group, Llc. | 0 | -100,00 | 0 | |||||
| 2026-02-06 | 13F | ProShare Advisors LLC | 15.916 | 3,13 | 160 | -4,79 | ||||
| 2026-02-12 | 13F | EntryPoint Capital, LLC | 44.645 | 0,00 | 448 | -7,64 | ||||
| 2026-01-08 | 13F | Versant Capital Management, Inc | 453 | 5 | ||||||
| 2026-02-17 | 13F | Coppell Advisory Solutions LLC | 11.722 | 0,00 | 122 | -6,87 | ||||
| 2026-02-17 | 13F | Tower Research Capital LLC (TRC) | 4.842 | 79,87 | 49 | 65,52 | ||||
| 2026-02-12 | 13F | State Board Of Administration Of Florida Retirement System | 23.743 | 0,00 | 238 | -7,39 | ||||
| 2026-01-21 | 13F | Newbridge Financial Services Group, Inc. | 26.447 | 0,28 | 265 | -7,34 | ||||
| 2026-01-08 | 13F | Wealth Enhancement Advisory Services, Llc | 16.361 | 32,23 | 163 | 22,73 | ||||
| 2026-02-06 | 13F | Rps Advisory Solutions Llc | 23.594 | -85,06 | 237 | -86,23 | ||||
| 2026-02-13 | 13F | Pinnacle Wealth Planning Services, Inc. | 3.067 | 31 | ||||||
| 2026-02-13 | 13F | Arkadios Wealth Advisors | 24.262 | 16,00 | 243 | 7,05 | ||||
| 2026-01-27 | 13F | Zurcher Kantonalbank (Zurich Cantonalbank) | 32.459 | 0,00 | 326 | -7,67 | ||||
| 2026-02-17 | 13F | Citadel Advisors Llc | 240.964 | -25,08 | 2.417 | -30,83 | ||||
| 2026-01-13 | 13F | CoreCap Advisors, LLC | 279 | -14,94 | 3 | -33,33 | ||||
| 2026-02-17 | 13F | Susquehanna International Group, Llp | 33.592 | 337 | ||||||
| 2026-02-17 | 13F | Fairscale Capital, LLC | 3.111 | 0,00 | 32 | -5,88 | ||||
| 2026-02-17 | 13F | Citadel Advisors Llc | Call | 51.400 | -50,48 | 516 | -54,30 | |||
| 2026-02-17 | 13F | Russell Investments Group, Ltd. | 8.301 | 9,17 | 83 | 1,22 | ||||
| 2026-02-11 | 13F | Franklin Resources Inc | 1.500.163 | 0,00 | 15.047 | -7,64 | ||||
| 2026-02-12 | 13F | Ankerstar Wealth, LLC | 14 | 0 | ||||||
| 2026-02-10 | 13F | Quantbot Technologies LP | 20.847 | 209 | ||||||
| 2026-02-10 | 13F | Acadian Asset Management Llc | 0 | -100,00 | 0 | |||||
| 2025-11-07 | 13F | Beacon Capital Management, LLC | 0 | -100,00 | 0 | |||||
| 2025-11-14 | 13F | Beck Capital Management, Llc | 0 | -100,00 | 0 | |||||
| 2026-02-13 | 13F | Verition Fund Management LLC | 0 | -100,00 | 0 | |||||
| 2026-02-02 | 13F | Fifth Third Bancorp | 97 | 27,63 | 1 | |||||
| 2026-02-17 | 13F | Susquehanna International Group, Llp | Put | 0 | -100,00 | 0 | ||||
| 2026-01-23 | 13F | Tyche Wealth Partners LLC | 0 | -100,00 | 0 | |||||
| 2026-01-29 | 13F | Klingman & Associates, LLC | 41.336 | -2,66 | 415 | -10,20 | ||||
| 2026-02-06 | 13F | Covestor Ltd | 72 | 22,03 | 0 | |||||
| 2026-02-17 | 13F | Advisor Group Holdings, Inc. | 44.870 | -14,38 | 450 | -23,47 | ||||
| 2026-01-30 | 13F | Jennison Associates Llc | 100.931 | 1.012 | ||||||
| 2026-02-09 | 13F | Global Assets Advisory, LLC | 0 | -100,00 | 0 | |||||
| 2026-01-28 | 13F | Arizona State Retirement System | 22.876 | -5,97 | 229 | -13,26 | ||||
| 2026-02-12 | 13F | Voya Investment Management Llc | 129.296 | 1,78 | 1.297 | -6,02 | ||||
| 2025-11-10 | 13F | Advisors Preferred, LLC | 0 | -100,00 | 0 | |||||
| 2026-02-17 | 13F | Polymer Capital Management (US) LLC | 37.051 | 372 | ||||||
| 2026-01-14 | 13F | Spire Wealth Management | 2.240 | 0,00 | 22 | -8,33 | ||||
| 2026-02-12 | 13F | Front Row Advisors LLC | 657 | 0,00 | 7 | -14,29 | ||||
| 2025-11-13 | 13F | Arrowstreet Capital, Limited Partnership | 0 | -100,00 | 0 | |||||
| 2026-02-12 | 13F | Steward Partners Investment Advisory, Llc | 5.810 | 0,00 | 58 | -7,94 | ||||
| 2026-02-12 | 13F | Great Lakes Advisors, Llc | 94.333 | -31,50 | 946 | -36,72 | ||||
| 2026-02-13 | 13F | Sei Investments Co | 20.591 | -5,55 | 206 | -12,71 | ||||
| 2026-01-22 | 13F | Brookwood Investment Group LLC | 26.747 | 12,63 | 268 | 4,28 | ||||
| 2026-02-13 | 13F | Police & Firemen's Retirement System of New Jersey | 22.616 | 0,00 | 227 | -7,76 | ||||
| 2026-02-13 | 13F | Kestra Advisory Services, LLC | 0 | -100,00 | 0 | |||||
| 2026-02-17 | 13F | Raymond James Financial Inc | 60.294 | -33,55 | 605 | -38,68 | ||||
| 2025-10-30 | 13F | Waldron Private Wealth LLC | 0 | -100,00 | 0 | -100,00 | ||||
| 2025-11-14 | 13F | Jane Street Group, Llc | Call | 0 | -100,00 | 0 | -100,00 | |||
| 2026-02-09 | 13F | Geode Capital Management, Llc | 2.000.190 | -0,08 | 20.065 | -7,72 | ||||
| 2026-02-13 | 13F | Dynamic Technology Lab Private Ltd | 0 | -100,00 | 0 | |||||
| 2026-02-09 | 13F | Quest Partners LLC | 22.306 | -76,96 | 224 | -78,78 | ||||
| 2026-02-17 | 13F | Optiver Holding B.V. | 286 | -15,88 | 3 | -33,33 | ||||
| 2026-02-09 | 13F | Hartland & Co., LLC | 0 | -100,00 | 0 | |||||
| 2026-02-13 | 13F | Manufacturers Life Insurance Company, The | 0 | -100,00 | 0 | |||||
| 2026-02-11 | 13F | Los Angeles Capital Management Llc | 422 | 4 | ||||||
| 2026-02-02 | 13F | Principal Financial Group Inc | 388.938 | -2,09 | 3.901 | -9,57 | ||||
| 2026-02-13 | 13F | Parkside Financial Bank & Trust | 19 | -88,05 | 0 | -100,00 | ||||
| 2026-02-12 | 13F | Eagle Point Credit Management LLC | 835.586 | 8.381 | ||||||
| 2026-02-17 | 13F | Gratia Capital, Llc | 862.922 | 7,79 | 8.655 | -0,45 | ||||
| 2026-02-17 | 13F | Royal Bank Of Canada | 49.907 | 7,76 | 501 | -0,40 | ||||
| 2026-02-11 | 13F | Simplex Trading, Llc | 0 | -100,00 | 0 | |||||
| 2026-02-13 | 13F | Glen Eagle Advisors, LLC | 328 | 3 | ||||||
| 2026-02-17 | 13F | Qube Research & Technologies Ltd | 42.112 | 422 | ||||||
| 2026-02-02 | 13F | Danske Bank A/s | 4.100 | 0,00 | 41 | -6,82 | ||||
| 2026-02-11 | 13F | Hodges Capital Management Inc. | 0 | -100,00 | 0 | -100,00 | ||||
| 2025-11-04 | 13F | State of Wyoming | 0 | -100,00 | 0 | |||||
| 2026-02-13 | 13F | Umb Bank N A/mo | 695 | 117,87 | 7 | 100,00 | ||||
| 2026-02-17 | 13F | Susquehanna International Group, Llp | Call | 0 | -100,00 | 0 | ||||
| 2026-01-15 | 13F | Nisa Investment Advisors, Llc | 8.982 | -18,48 | 94 | -24,19 | ||||
| 2026-01-21 | 13F | Yousif Capital Management, Llc | 21.747 | -13,95 | 222 | -18,98 | ||||
| 2025-11-07 | 13F | Marble Harbor Investment Counsel, LLC | 0 | -100,00 | 0 | |||||
| 2026-01-28 | 13F | Salomon & Ludwin, LLC | 1.096 | 160,33 | 11 | 11,11 | ||||
| 2026-02-13 | 13F | Aigen Investment Management, Lp | 40.715 | 408 | ||||||
| 2026-01-29 | 13F | Vanguard Group Inc | 8.663.783 | -1,50 | 86.898 | -9,03 | ||||
| 2025-11-13 | 13F | Cliffwater LLC | 0 | -100,00 | 0 | |||||
| 2026-01-23 | 13F | Assetmark, Inc | 4.028 | 40 | ||||||
| 2026-02-18 | 13F | Vident Advisory, LLC | 0 | -100,00 | 0 | |||||
| 2026-02-13 | 13F | Van Eck Associates Corp | 798.484 | 13,26 | 8 | 14,29 | ||||
| 2026-03-16 | 13F/A | Rockefeller Capital Management L.P. | 48.054 | 48.934,69 | 482 | 48.000,00 | ||||
| 2026-02-04 | 13F | Oregon Public Employees Retirement Fund | 18.646 | 0,54 | 187 | -6,97 | ||||
| 2026-02-06 | 13F | Global Retirement Partners, LLC | 1.349 | -16,16 | 14 | -23,53 | ||||
| 2026-02-13 | 13F | State Street Corp | 3.274.528 | -1,69 | 33.985 | -8,96 | ||||
| 2026-02-17 | 13F | Cetera Investment Advisers | 128.490 | 0,31 | 1.289 | -7,40 | ||||
| 2026-01-16 | 13F | Legacy Capital Wealth Partners, LLC | 19.968 | 500 | ||||||
| 2026-02-17 | 13F | Millennium Management Llc | 0 | -100,00 | 0 | |||||
| 2026-02-17 | 13F | Jones Financial Companies Lllp | 0 | -100,00 | 0 | |||||
| 2025-11-06 | 13F | Naviter Wealth, LLC | 0 | -100,00 | 0 | |||||
| 2026-02-06 | 13F | Larson Financial Group LLC | 149 | -41,57 | 1 | -50,00 | ||||
| 2026-01-20 | 13F | Harbor Capital Advisors, Inc. | 341 | -1,73 | 0 | |||||
| 2026-02-02 | 13F | Mutual Advisors, LLC | 17.229 | 1,98 | 173 | -5,49 | ||||
| 2026-02-10 | 13F | Bank of New York Mellon Corp | 606.641 | -1,48 | 6.085 | -9,00 | ||||
| 2026-02-11 | 13F | Vestcor Inc | 26.949 | 0,00 | 0 | |||||
| 2026-02-17 | 13F | Public Employees Retirement System Of Ohio | 1.953 | -0,86 | 20 | -9,52 | ||||
| 2026-02-17 | 13F | Alliancebernstein L.p. | 111.008 | 30,43 | 1.113 | 20,45 | ||||
| 2026-02-17 | 13F | Tudor Investment Corp Et Al | 13.492 | 135 | ||||||
| 2026-01-16 | 13F | Louisiana State Employees Retirement System | 37.400 | -1,06 | 375 | -8,54 | ||||
| 2026-01-28 | 13F | Teacher Retirement System Of Texas | 0 | -100,00 | 0 | |||||
| 2026-02-12 | 13F | Renaissance Technologies Llc | 181.019 | -46,00 | 1.816 | -50,14 | ||||
| 2026-02-05 | 13F | AlphaCore Capital LLC | 17.983 | -19,08 | 187 | -25,30 | ||||
| 2026-02-13 | 13F | Centiva Capital, LP | 0 | -100,00 | 0 | -100,00 | ||||
| 2026-02-06 | 13F | Ignite Planners, LLC | 13.535 | -2,87 | 139 | -8,61 | ||||
| 2026-01-15 | 13F | Sollinda Capital Management LLC | 12.487 | 0,00 | 125 | -7,41 | ||||
| 2026-01-08 | 13F | Financial Management Network Inc | 112.031 | -1,02 | 1.133 | -7,36 | ||||
| 2026-01-29 | 13F | Pictet Asset Management Holding SA | 11.607 | 0,00 | 116 | -7,94 | ||||
| 2026-02-13 | 13F | Luminist Capital LLC | 234 | 0,00 | 2 | 0,00 | ||||
| 2026-02-10 | 13F | Connor, Clark & Lunn Investment Management Ltd. | 0 | -100,00 | 0 | |||||
| 2026-01-23 | 13F | Strong Tower Advisory Services | 75.547 | -94,76 | 758 | -95,17 | ||||
| 2026-02-13 | 13F | Victory Capital Management Inc | 88.649 | 0,10 | 889 | -7,49 | ||||
| 2026-02-18 | 13F | GWM Advisors LLC | 1.064 | 0,00 | 11 | -9,09 | ||||
| 2025-11-14 | 13F | State Of Wisconsin Investment Board | 0 | -100,00 | 0 | |||||
| 2026-02-11 | 13F | Gilpin Wealth Management, Llc | 15 | 0 | ||||||
| 2026-01-27 | 13F | Belpointe Asset Management LLC | 12.100 | -45,25 | 121 | -49,58 | ||||
| 2026-02-03 | 13F | Farmers & Merchants Investments Inc | 55 | 0,00 | 1 | |||||
| 2026-01-30 | 13F | Arlington Trust Co LLC | 4.000 | 40 | ||||||
| 2025-11-12 | 13F | Bare Financial Services, Inc | 0 | -100,00 | 0 | |||||
| 2026-02-11 | 13F | LPL Financial LLC | 54.860 | -28,09 | 550 | -33,57 | ||||
| 2025-11-13 | 13F | Founders Capital Management | 0 | -100,00 | 0 | |||||
| 2025-11-14 | 13F | ExodusPoint Capital Management, LP | 28.197 | -76,85 | 306 | 30.500,00 | ||||
| 2026-02-17 | 13F | Q Global Advisors, LLC | 301.355 | 3 | ||||||
| 2026-02-17 | 13F | LaSalle St. Investment Advisors, LLC | 0 | -100,00 | 0 | |||||
| 2026-02-17 | 13F | Two Sigma Advisers, Lp | 118.600 | 566,29 | 1.190 | 516,06 | ||||
| 2026-01-26 | 13F | PFG Investments, LLC | 14.315 | 0,87 | 144 | -7,14 | ||||
| 2026-02-10 | 13F | Goldman Sachs Group Inc | 262.297 | 26,87 | 2.631 | 17,15 | ||||
| 2026-02-17 | 13F | Fmr Llc | 16.580 | 499,20 | 166 | 453,33 | ||||
| 2026-01-28 | 13F | Geneos Wealth Management Inc. | 16.171 | -16,86 | 162 | -23,22 | ||||
| 2026-02-09 | 13F | Jefferies Financial Group Inc. | 73.638 | 0,00 | 739 | -7,63 | ||||
| 2026-02-13 | 13F | Neuberger Berman Group LLC | 0 | -100,00 | 0 | |||||
| 2026-02-12 | 13F | CIBC Private Wealth Group, LLC | 1.620 | 1,25 | 16 | -5,88 | ||||
| 2026-02-17 | 13F | Quantinno Capital Management LP | 16.418 | -24,95 | 165 | -30,80 | ||||
| 2026-02-17 | 13F | Janus Henderson Group Plc | 36.116 | 0,00 | 362 | -7,65 | ||||
| 2026-02-12 | 13F | Orchard Capital Managment, LLC | 161.719 | 1,97 | 1.622 | -5,81 | ||||
| 2026-01-07 | 13F | Central Pacific Bank - Trust Division | 10.000 | 33,33 | 100 | 23,46 | ||||
| 2026-02-04 | 13F | Bailard, Inc. | 0 | -100,00 | 0 | |||||
| 2026-02-17 | 13F | Advisory Services Network, LLC | 0 | -100,00 | 0 | |||||
| 2026-02-12 | 13F | New York State Common Retirement Fund | 24.665 | 0,00 | 247 | -7,49 | ||||
| 2025-10-03 | 13F | Shorepoint Capital Partners LLC | 46.400 | -9,73 | 504 | -23,09 | ||||
| 2026-02-13 | 13F | Arete Wealth Advisors, LLC | 51.630 | -8,54 | 1 | |||||
| 2026-02-10 | 13F | Bnp Paribas Arbitrage, Sa | 19.141 | -5,16 | 192 | -12,79 | ||||
| 2026-02-13 | 13F | Smartleaf Asset Management LLC | 22 | -56,00 | 0 | |||||
| 2026-02-05 | 13F | Gabelli Funds Llc | 492.500 | 5,35 | 4.940 | -2,72 | ||||
| 2026-01-05 | 13F | GAMMA Investing LLC | 649 | -22,65 | 7 | -33,33 | ||||
| 2026-02-13 | 13F | Sterling Capital Management LLC | 4.743 | -16,05 | 48 | -22,95 | ||||
| 2026-02-13 | 13F | Charles Schwab Investment Management Inc | 1.256.179 | 4,97 | 12.599 | -3,05 | ||||
| 2026-02-17 | 13F | MIRAE ASSET GLOBAL ETFS HOLDINGS Ltd. | 1.121.904 | 7,65 | 11.253 | -0,58 | ||||
| 2026-02-13 | 13F | MAI Capital Management | 69 | 1 | ||||||
| 2026-01-29 | 13F | UBS Group AG | 874.525 | 0,17 | 8.771 | -7,49 | ||||
| 2026-02-17 | 13F | Price T Rowe Associates Inc /md/ | 67.809 | 9,69 | 1 | |||||
| 2026-02-05 | 13F | Cambridge Investment Research Advisors, Inc. | 25.601 | -0,14 | 0 | |||||
| 2026-02-17 | 13F | Creative Planning | 28.236 | -13,30 | 283 | -19,83 | ||||
| 2026-01-29 | 13F | Dunhill Financial, LLC | 2 | 0 | ||||||
| 2026-02-13 | 13F | Mariner, LLC | 502.832 | 0,39 | 5.212 | -4,19 | ||||
| 2026-02-17 | 13F | Guggenheim Capital Llc | 25.938 | 260 | ||||||
| 2026-01-28 | 13F | WPG Advisers, LLC | 137 | 8,73 | 1 | 0,00 | ||||
| 2025-11-13 | 13F | M Holdings Securities, Inc. | 0 | -100,00 | 0 | |||||
| 2026-02-13 | 13F | Safeguard Investment Advisory Group, LLC | 12.665 | 0,00 | 127 | -7,30 | ||||
| 2026-01-28 | 13F | Klp Kapitalforvaltning As | 17.642 | 16,51 | 182 | 7,69 | ||||
| 2026-02-13 | 13F | Morgan Stanley | 601.418 | 7,05 | 6.032 | -1,13 | ||||
| 2026-02-10 | 13F | Moors & Cabot, Inc. | 0 | -100,00 | 0 | |||||
| 2026-02-17 | 13F | Aqr Capital Management Llc | 100.981 | 20,08 | 1.013 | 10,84 | ||||
| 2025-10-10 | 13F | Kathleen S. Wright Associates Inc. | 3.425 | 0,00 | 37 | 2,78 | ||||
| 2026-01-21 | 13F | Raleigh Capital Management Inc. | 11.345 | 0,00 | 114 | -8,13 | ||||
| 2026-01-23 | 13F | Farther Finance Advisors, LLC | 71.675 | 65.059,09 | 719 | 71.700,00 | ||||
| 2026-01-26 | 13F | AE Wealth Management LLC | 10.952 | 110 | ||||||
| 2026-01-20 | 13F | Signaturefd, Llc | 49 | -93,97 | 0 | -100,00 | ||||
| 2026-02-05 | 13F | Gamco Investors, Inc. Et Al | 114.962 | -26,16 | 1.153 | -31,78 | ||||
| 2026-02-17 | 13F | Bank Of America Corp /de/ | 83.035 | -30,88 | 833 | -36,20 | ||||
| 2026-02-17 | 13F | XTX Topco Ltd | 127.042 | 276,62 | 1.274 | 248,09 | ||||
| 2026-02-17 | 13F | Northern Trust Corp | 800.141 | -9,07 | 8.025 | -16,01 | ||||
| 2026-01-29 | 13F | Teachers Retirement System Of The State Of Kentucky | 20.670 | -12,12 | 0 | |||||
| 2026-02-12 | 13F | Nuveen, LLC | 176.139 | 0,00 | 1.767 | -7,64 |
Other Listings
| DE:6VH | 7,35 € |