Grundlæggende statistik
| Institutionelle aktier (lange) | 41.505.576 - 11,92% (ex 13D/G) - change of 2,75MM shares 7,11% MRQ |
| Institutionel værdi (lang) | $ 155.933 USD ($1000) |
Institutionelt ejerskab og aktionærer
Eve Holding, Inc. (US:EVEX) har 151 institutionelle ejere og aktionærer, der har indsendt 13D/G- eller 13F-formularer til Securities Exchange Commission (SEC). Disse institutioner har i alt 41,505,576 aktier. Største aktionærer omfatter BlackRock, Inc., Vanguard Group Inc, BW Gestao de Investimentos Ltda., SPX Equities Gestao de Recursos Ltda, United Airlines Holdings, Inc., Cooper Creek Partners Management Llc, Geode Capital Management, Llc, Masters Capital Management Llc, State Street Corp, and Kapitalo Investimentos Ltda .
Eve Holding, Inc. (NYSE:EVEX) institutionel ejerskabsstruktur viser aktuelle positioner i virksomheden efter institutioner og fonde, samt seneste ændringer i positionsstørrelse. Større aktionærer kan omfatte individuelle investorer, investeringsforeninger, hedgefonde eller institutioner. Skema 13D angiver, at investoren besidder (eller besidder) mere end 5 % af virksomheden og har til hensigt (eller har til hensigt at) aktivt at forfølge en ændring i forretningsstrategi. Skema 13G indikerer en passiv investering på over 5%.
The share price as of March 16, 2026 is 2,79 / share. Previously, on March 17, 2025, the share price was 3,15 / share. This represents a decline of 11,43% over that period.

Fondens stemningsscore
Fund Sentiment Score (fka Ownership Accumulation Score) finder de aktier, der bliver mest købt af fonde. Det er resultatet af en sofistikeret, multi-faktor kvantitativ model, der identificerer virksomheder med de højeste niveauer af institutionel akkumulering. Scoringsmodellen bruger en kombination af den samlede stigning i oplyste ejere, ændringerne i porteføljeallokeringer i disse ejere og andre målinger. Tallet går fra 0 til 100, hvor højere tal indikerer et højere niveau af akkumulering for sine jævnaldrende, og 50 er gennemsnittet.
Opdateringsfrekvens: Dagligt
Se Ownership Explorer, som giver en liste over højest rangerende virksomheder.
AI+ Ask Fintel’s AI assistant about Eve Holding, Inc..
Select a question to share a public post with an AI-crafted answer.
Thinking of good questions…
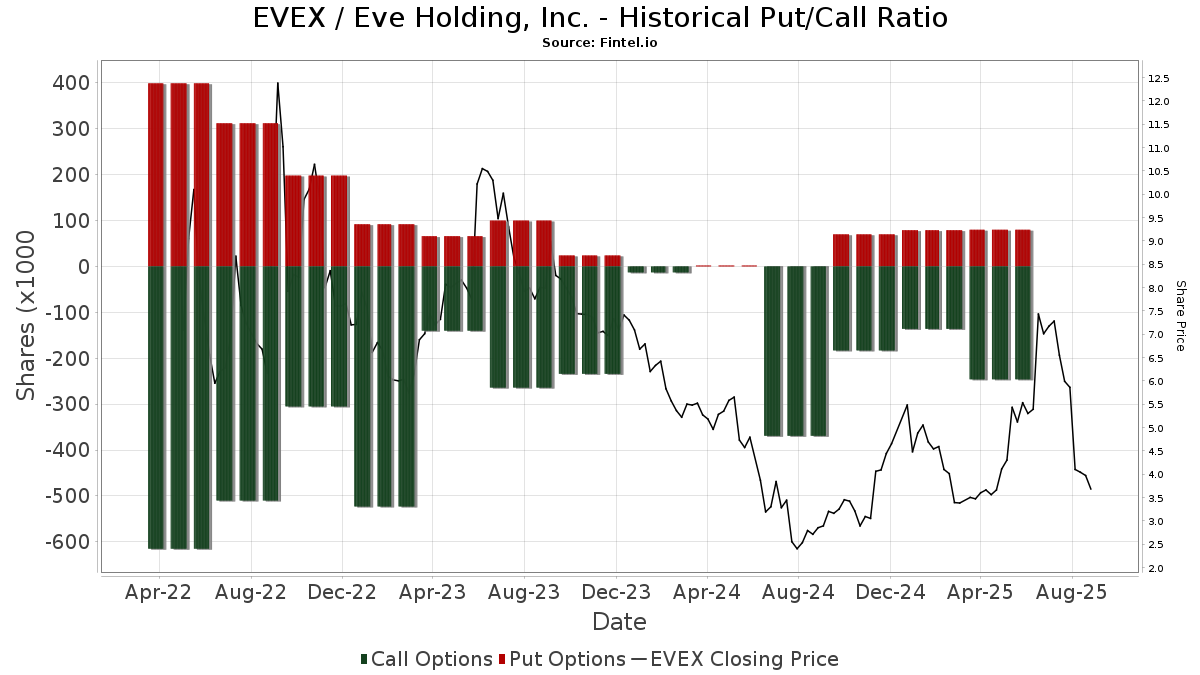
Institutionel Put/Call-forhold
Ud over at indberette standardaktie- og gældsudstedelser skal institutter med mere end 100 mill. aktiver under forvaltning også oplyse deres put- og call-optionsbeholdninger. Da salgsoptioner generelt indikerer negativ stemning, og købsoptioner indikerer positiv stemning, kan vi få en fornemmelse af den overordnede institutionelle stemning ved at plotte forholdet mellem put og kald. Diagrammet til højre viser det historiske put/call-forhold for dette instrument.
Brug af Put/Call Ratio som en indikator for investorernes stemning overvinder en af de vigtigste mangler ved at bruge totalt institutionelt ejerskab, som er, at en betydelig mængde af aktiver under forvaltning investeres passivt for at spore indekser. Passivt forvaltede fonde køber typisk ikke optioner, så indikatoren for put/call-forholdet følger mere nøje følelsen af aktivt forvaltede fonde.
13D/G-arkivering
Vi præsenterer 13D/G ansøgninger separat fra 13F ansøgninger på grund af den forskellige behandling af SEC. 13D/G-ansøgninger kan indgives af grupper af investorer (med én ledende), hvorimod 13F-ansøgninger ikke kan. Dette resulterer i situationer, hvor en investor kan indsende en 13D/G, der rapporterer én værdi for de samlede aktier (der repræsenterer alle de aktier, der ejes af investorgruppen), men derefter indsender en 13F, der rapporterer en anden værdi for de samlede aktier (der udelukkende repræsenterer deres egne) ejendomsret). Det betyder, at aktieejerskab af 13D/G-arkiver og 13F-arkiveringer ofte ikke er direkte sammenlignelige, så vi præsenterer dem separat.
Bemærk: Fra den 16. maj 2021 viser vi ikke længere ejere, der ikke har indsendt en 13D/G inden for det seneste år. Tidligere viste vi den fulde historie af 13D/G-arkiver. Generelt skal enheder, der er forpligtet til at indgive 13D/G-ansøgninger, indgive mindst årligt, før de indsender en afsluttende ansøgning. Dog forlader fonde nogle gange positioner uden at indsende en afsluttende ansøgning (dvs. de afvikler), så visning af den fulde historie resulterede nogle gange i forvirring om det nuværende ejerskab. For at undgå forvirring viser vi nu kun 'aktuelle' ejere - det vil sige - ejere, der har anmeldt inden for det seneste år.
Upgrade to unlock premium data.
| Fil dato | Form | Investor | Forrige Aktier |
Seneste Aktier |
Δ Aktier (Procent) |
Ejendomsret (Procent) |
Δ Ejerskab (Procent) |
|
|---|---|---|---|---|---|---|---|---|
| 2025-10-01 | Embraer Aircraft Holding, Inc. | 246,399,589 | 250,523,300 | 1.67 | 71.90 | -12.21 |
13F og NPORT arkivering
Detaljer om 13F-arkivering er gratis. Detaljer om NP-ansøgninger kræver et premium-medlemskab. Grønne rækker angiver nye positioner. Røde rækker angiver lukkede positioner. Klik på linket ikon for at se den fulde transaktionshistorik.
Opgrader
for at låse premium-data op og eksportere til Excel ![]() .
.
| Fil dato | Kilde | Investor | Type | Gennemsnitlig pris (Øst) |
Aktier | Δ Aktier (%) |
Rapporteret Værdi ($1000) |
Δ Værdi (%) |
Port Alloc (%) |
|
|---|---|---|---|---|---|---|---|---|---|---|
| 2026-02-12 | 13F | State Board Of Administration Of Florida Retirement System | 20.950 | 0,00 | 84 | 5,06 | ||||
| 2026-02-13 | 13F | Toroso Investments, LLC | 13.172 | 53 | ||||||
| 2026-02-17 | 13F | Alliancebernstein L.p. | 75.480 | 61,35 | 301 | 69,10 | ||||
| 2026-02-17 | 13F | Boothbay Fund Management, Llc | 15.610 | 62 | ||||||
| 2026-02-13 | 13F | Verition Fund Management LLC | 13.617 | 54 | ||||||
| 2026-02-10 | 13F | Bank of New York Mellon Corp | 214.024 | 69,13 | 854 | 76,97 | ||||
| 2026-02-05 | 13F | Amalgamated Bank | 3.012 | 70,85 | 0 | |||||
| 2025-11-12 | 13F | Aster Capital Management (DIFC) Ltd | 0 | -100,00 | 0 | |||||
| 2026-01-16 | 13F | FNY Investment Advisers, LLC | Put | 0 | -100,00 | 0 | ||||
| 2026-02-17 | 13F | Millennium Management Llc | 307.529 | -44,51 | 1.227 | -41,88 | ||||
| 2026-02-13 | 13F | HITE Hedge Asset Management LLC | 619.277 | 2.471 | ||||||
| 2026-02-13 | 13F | Morgan Stanley | 548.498 | 46,61 | 2.189 | 53,54 | ||||
| 2025-09-29 | NP | KCXIX - Knights of Columbus U.S. All Cap Index Fund I Shares | 199 | 8,15 | 1 | |||||
| 2026-02-13 | 13F | Mariner, LLC | 12.209 | 49 | ||||||
| 2025-09-29 | NP | SUNAMERICA SERIES TRUST - SA Small Cap Index Portfolio Class 1 | 5.831 | -2,05 | 38 | 76,19 | ||||
| 2026-02-12 | 13F | Voya Investment Management Llc | 16.288 | 65 | ||||||
| 2026-02-17 | 13F | Jones Financial Companies Lllp | 137 | 0,00 | 1 | |||||
| 2026-02-04 | 13F | Pier 88 Investment Partners Llc | 118.080 | 7,00 | 471 | 12,14 | ||||
| 2026-02-19 | 13F | Invesco Ltd. | 20.038 | 46,96 | 80 | 54,90 | ||||
| 2026-02-13 | 13F | Thomist Capital Management, LP | 80.880 | 66,43 | 322 | 70,37 | ||||
| 2026-01-29 | 13F | UBS Group AG | 799.049 | 56,91 | 3.188 | 64,33 | ||||
| 2026-02-12 | 13F | Renaissance Technologies Llc | 0 | -100,00 | 0 | |||||
| 2026-02-17 | 13F | Susquehanna Fundamental Investments, Llc | 17.024 | 68 | ||||||
| 2026-02-13 | 13F | SRS Capital Advisors, Inc. | 8 | -98,29 | 0 | -100,00 | ||||
| 2026-02-13 | 13F | Squarepoint Ops LLC | 199.594 | 796 | ||||||
| 2026-01-09 | 13F | SG Americas Securities, LLC | 11.161 | 0 | ||||||
| 2026-01-28 | 13F | Klp Kapitalforvaltning As | 17.400 | 48,72 | 69 | 56,82 | ||||
| 2026-02-17 | 13F | Price T Rowe Associates Inc /md/ | 50.158 | 90,04 | 0 | |||||
| 2026-02-17 | 13F | Janus Henderson Group Plc | 59.457 | 0,00 | 237 | 4,42 | ||||
| 2026-02-13 | 13F | State Street Corp | 1.583.992 | 19,10 | 6.320 | 24,73 | ||||
| 2026-02-17 | 13F | Blair William & Co/il | 47.017 | 0,00 | 188 | 4,47 | ||||
| 2026-01-29 | 13F | Vanguard Group Inc | 5.556.270 | 6,30 | 22.170 | 11,33 | ||||
| 2025-09-17 | NP | NATIONWIDE MUTUAL FUNDS - Nationwide Fundamental All Cap Equity Portfolio Class R6 | 2.348 | -48,38 | 15 | -6,25 | ||||
| 2026-02-17 | 13F | Tudor Investment Corp Et Al | 48.159 | 192 | ||||||
| 2026-02-09 | 13F | Hartland & Co., LLC | 0 | -100,00 | 0 | |||||
| 2026-02-12 | 13F | MetLife Investment Management, LLC | 54.841 | 78,38 | 219 | 86,32 | ||||
| 2026-02-17 | 13F | XTX Topco Ltd | 0 | -100,00 | 0 | |||||
| 2025-11-14 | 13F | Raymond James Financial Inc | 0 | -100,00 | 0 | |||||
| 2026-02-17 | 13F | Russell Investments Group, Ltd. | 12.031 | 60,97 | 48 | 71,43 | ||||
| 2026-02-17 | 13F | National Asset Management, Inc. | 10.822 | 0,00 | 43 | 4,88 | ||||
| 2026-02-17 | 13F | PharVision Advisers, LLC | 47.794 | 191 | ||||||
| 2026-02-10 | 13F | Envestnet Asset Management Inc | 15.069 | -35,45 | 60 | -31,82 | ||||
| 2026-02-17 | 13F | State Of Wisconsin Investment Board | 64.704 | 87,08 | 258 | 96,95 | ||||
| 2026-03-04 | 13F | SHP Wealth Management | 175 | 1 | ||||||
| 2026-02-17 | 13F | Schonfeld Strategic Advisors LLC | 54.259 | 390,68 | 216 | 414,29 | ||||
| 2025-09-26 | NP | UAPIX - Ultrasmall-cap Profund Investor Class | 565 | 5,61 | 4 | 200,00 | ||||
| 2026-02-11 | 13F | Los Angeles Capital Management Llc | 24.635 | 108 | ||||||
| 2026-02-17 | 13F | Canada Pension Plan Investment Board | 162.800 | 650 | ||||||
| 2026-02-17 | 13F | Ilex Capital Partners (UK) LLP | 0 | -100,00 | 0 | |||||
| 2026-01-28 | 13F | Arizona State Retirement System | 19.207 | -6,01 | 77 | -1,30 | ||||
| 2026-02-13 | 13F | Charles Schwab Investment Management Inc | 810.667 | 23,69 | 3.235 | 29,52 | ||||
| 2025-10-02 | 13F | TT International Asset Management LTD | 0 | -100,00 | 0 | -100,00 | ||||
| 2026-02-12 | 13F | Nuveen, LLC | 135.282 | 58,39 | 540 | 65,85 | ||||
| 2026-02-17 | 13F | Citadel Advisors Llc | Put | 38.800 | -21,93 | 155 | -18,52 | |||
| 2026-02-17 | 13F | Citadel Advisors Llc | Call | 366.800 | 2.329,14 | 1.464 | 2.466,67 | |||
| 2025-11-14 | 13F | Point72 Asia (Singapore) Pte. Ltd. | 55.618 | 212 | ||||||
| 2026-01-23 | 13F | Private Wealth Management Group, LLC | 322 | 0,00 | 1 | 0,00 | ||||
| 2026-02-17 | 13F | Aureus Asset Management, LLC | 120.500 | 517,95 | 481 | 548,65 | ||||
| 2026-02-23 | 13F | Virtu Financial LLC | 23.938 | -9,82 | 0 | |||||
| 2025-09-24 | NP | SWTSX - Schwab Total Stock Market Index Fund This fund is a listed as child fund of Charles Schwab Investment Management Inc and if that institution has disclosed ownership in this security, then these positions will not be double counted when calculating total shares and total value | 39.143 | 0,00 | 254 | 82,73 | ||||
| 2025-09-25 | NP | ISCB - iShares Morningstar Small-Cap ETF | 2.252 | 64,62 | 15 | 100,00 | ||||
| 2026-02-12 | 13F | New York State Common Retirement Fund | 9.453 | 0,00 | 38 | 2,78 | ||||
| 2026-02-17 | 13F | Heights Capital Management, Inc | 0 | -100,00 | 0 | |||||
| 2026-02-05 | 13F | Allworth Financial LP | 144 | 45,45 | 1 | |||||
| 2025-09-26 | NP | ISCG - iShares Morningstar Small-Cap Growth ETF | 13.689 | 89 | ||||||
| 2026-02-17 | 13F | Abel Hall, LLC | 13.441 | 54 | ||||||
| 2026-01-26 | 13F | Cwm, Llc | 5.913 | 52,83 | 0 | |||||
| 2026-02-10 | 13F | Intech Investment Management Llc | 16.267 | -40,54 | 65 | -38,46 | ||||
| 2025-11-14 | 13F | Wolverine Trading, Llc | 14.933 | 58 | ||||||
| 2026-02-06 | 13F | HighTower Advisors, LLC | 10.009 | 0,04 | 40 | 2,63 | ||||
| 2026-02-17 | 13F | Balyasny Asset Management Llc | 186.549 | 744 | ||||||
| 2025-11-14 | 13F | Wolverine Trading, Llc | Put | 13.200 | 51 | |||||
| 2026-02-17 | 13F | Bank Of America Corp /de/ | 88.824 | 105,02 | 354 | 114,55 | ||||
| 2026-02-17 | 13F | MIRAE ASSET GLOBAL ETFS HOLDINGS Ltd. | 44.517 | 87,19 | 178 | 96,67 | ||||
| 2026-02-17 | 13F | Creative Planning | 17.036 | -21,34 | 68 | -18,29 | ||||
| 2026-01-27 | 13F | Zurcher Kantonalbank (Zurich Cantonalbank) | 23.435 | 94 | ||||||
| 2026-01-28 | 13F | Kapitalo Investimentos Ltda | 1.100.000 | 0,00 | 4.389 | 4,72 | ||||
| 2025-09-29 | NP | RSSL - Global X Russell 2000 ETF | 25.992 | -19,59 | 169 | 46,09 | ||||
| 2026-02-11 | 13F | Franklin Resources Inc | 18.604 | 0,38 | 74 | 5,71 | ||||
| 2026-02-11 | 13F | Group One Trading, L.p. | 7.869 | 31 | ||||||
| 2026-02-13 | 13F | SPX Equities Gestao de Recursos Ltda | 2.845.692 | 383,15 | 11.354 | 405,97 | ||||
| 2026-02-17 | 13F | California State Teachers Retirement System | 85.192 | 2,56 | 340 | 7,28 | ||||
| 2026-02-17 | 13F | Numerai GP LLC | 89.168 | 28,73 | 356 | 34,98 | ||||
| 2026-02-17 | 13F | Susquehanna International Group, Llp | 62.558 | 250 | ||||||
| 2026-02-02 | 13F | Avidian Wealth Solutions, LLC | 0 | -100,00 | 0 | |||||
| 2026-02-06 | 13F | EverSource Wealth Advisors, LLC | 774 | 7,20 | 3 | 50,00 | ||||
| 2026-01-30 | 13F | Us Bancorp \de\ | 2.316 | 581,18 | 9 | 800,00 | ||||
| 2026-02-17 | 13F | Susquehanna International Group, Llp | Put | 24.500 | 18,36 | 98 | 24,36 | |||
| 2026-02-17 | 13F | Engineers Gate Manager LP | 0 | -100,00 | 0 | |||||
| 2026-02-11 | 13F | Simplex Trading, Llc | 0 | -100,00 | 0 | |||||
| 2026-02-17 | 13F | Susquehanna International Group, Llp | Call | 125.000 | 92,60 | 499 | 101,62 | |||
| 2026-02-10 | 13F | Axq Capital, Lp | 22.791 | 60,38 | 91 | 66,67 | ||||
| 2026-02-10 | 13F | Quantbot Technologies LP | 0 | -100,00 | 0 | |||||
| 2026-02-10 | 13F | Acadian Asset Management Llc | 0 | -100,00 | 0 | |||||
| 2026-02-17 | 13F | Aqr Capital Management Llc | 123.292 | 85,88 | 492 | 94,84 | ||||
| 2026-02-17 | 13F | Brevan Howard Capital Management LP | 0 | -100,00 | 0 | |||||
| 2025-09-24 | NP | SWSSX - Schwab Small-Cap Index Fund This fund is a listed as child fund of Charles Schwab Investment Management Inc and if that institution has disclosed ownership in this security, then these positions will not be double counted when calculating total shares and total value | 130.028 | -0,80 | 845 | 81,33 | ||||
| 2025-09-26 | NP | SLPIX - Small-cap Profund Investor Class | 46 | -9,80 | 0 | |||||
| 2026-02-13 | 13F | Walleye Trading LLC | 0 | -100,00 | 0 | |||||
| 2026-02-13 | 13F | Marshall Wace, Llp | 83.092 | 332 | ||||||
| 2026-02-13 | 13F | Sterling Capital Management LLC | 626 | 404,84 | 2 | |||||
| 2026-02-13 | 13F | Pinnacle Wealth Planning Services, Inc. | 132 | 1 | ||||||
| 2026-02-17 | 13F | Blackstone Group Inc | 0 | -100,00 | 0 | |||||
| 2026-02-13 | 13F | Walleye Trading LLC | Call | 0 | -100,00 | 0 | ||||
| 2026-02-12 | 13F | Jane Street Group, Llc | Call | 42.300 | 138,98 | 169 | 150,75 | |||
| 2025-11-14 | 13F | Hrt Financial Lp | 0 | -100,00 | 0 | |||||
| 2026-01-08 | 13F | True Wealth Design, LLC | 160 | 6,67 | 1 | |||||
| 2026-02-06 | 13F | Covestor Ltd | 22 | 0,00 | 0 | |||||
| 2026-02-12 | 13F | Jane Street Group, Llc | 121.600 | -92,34 | 485 | -91,98 | ||||
| 2026-02-17 | 13F | Tower Research Capital LLC (TRC) | 2.727 | -13,07 | 11 | -9,09 | ||||
| 2026-02-12 | 13F | Jane Street Group, Llc | Put | 24.400 | 33,33 | 97 | 40,58 | |||
| 2026-02-17 | 13F | Point72 Asset Management, L.P. | 355.622 | 270,60 | 1.419 | 288,49 | ||||
| 2026-02-06 | 13F | Pnc Financial Services Group, Inc. | 313 | 13,41 | 1 | 0,00 | ||||
| 2026-02-13 | 13F | Walleye Trading LLC | Put | 0 | -100,00 | 0 | ||||
| 2025-09-26 | NP | FSSNX - Fidelity Small Cap Index Fund This fund is a listed as child fund of Fmr Llc and if that institution has disclosed ownership in this security, then these positions will not be double counted when calculating total shares and total value | 513.534 | -3,90 | 3.338 | 75,45 | ||||
| 2026-02-17 | 13F | Optiver Holding B.V. | 0 | -100,00 | 0 | |||||
| 2026-02-17 | 13F | Amundi | 87.468 | 187,48 | 349 | 127,45 | ||||
| 2026-02-06 | 13F | IFP Advisors, Inc | 142 | 1.190,91 | 1 | |||||
| 2026-02-03 | 13F | Ethic Inc. | 16.528 | 3,90 | 66 | 8,33 | ||||
| 2026-02-17 | 13F | Masters Capital Management Llc | 2.100.000 | -31,15 | 8.379 | -27,89 | ||||
| 2026-02-17 | 13F | Jump Financial, LLC | 379.157 | 141,19 | 1.513 | 152,84 | ||||
| 2026-02-13 | 13F | Barclays Plc | 149.612 | 104,80 | 597 | 114,39 | ||||
| 2026-02-13 | 13F | Walleye Capital LLC | Put | 4.800 | 37,14 | 19 | 46,15 | |||
| 2025-09-26 | NP | ETTOX - E*TRADE No Fee Total Market Index Fund | 100 | 0,00 | 1 | |||||
| 2026-02-13 | 13F | Victory Capital Management Inc | 11.133 | 44 | ||||||
| 2026-02-17 | 13F | Sabby Management, Llc | 0 | -100,00 | 0 | |||||
| 2025-10-27 | 13F | Stone House Investment Management, LLC | 0 | -100,00 | 0 | |||||
| 2026-02-13 | 13F | Walleye Capital LLC | 13.242 | -65,96 | 53 | -64,86 | ||||
| 2026-02-13 | 13F | Walleye Capital LLC | Call | 500 | -44,44 | 2 | -66,67 | |||
| 2026-02-13 | 13F | Police & Firemen's Retirement System of New Jersey | 24.190 | 63,89 | 97 | 71,43 | ||||
| 2026-02-17 | 13F | Jain Global LLC | 16.059 | 64 | ||||||
| 2026-02-17 | 13F | Advisor Group Holdings, Inc. | 400 | -36,81 | 2 | -50,00 | ||||
| 2026-01-21 | 13F | Oak Thistle LLC | 13.607 | 54 | ||||||
| 2026-02-17 | 13F | LMR Partners LLP | 0 | -100,00 | 0 | |||||
| 2026-02-17 | 13F | Northern Trust Corp | 731.754 | 38,36 | 2.920 | 44,94 | ||||
| 2025-09-29 | NP | CCSO - Carbon Collective Climate Solutions U.S. Equity ETF | 9.495 | 0,00 | 62 | 84,85 | ||||
| 2026-02-10 | 13F | Rothschild Investment Llc | 37 | 0 | ||||||
| 2026-02-12 | 13F | BlackRock, Inc. | 6.519.256 | 61,25 | 26.012 | 68,87 | ||||
| 2026-02-03 | 13F | SBI Securities Co., Ltd. | 1.433 | -9,82 | 6 | -16,67 | ||||
| 2026-02-17 | 13F | Cooper Creek Partners Management Llc | 2.388.495 | -5,29 | 10 | 0,00 | ||||
| 2026-02-05 | 13F | Pinnacle Associates Ltd | 261.840 | 4,90 | 1.045 | 9,78 | ||||
| 2026-02-06 | 13F | ProShare Advisors LLC | 17.522 | 70 | ||||||
| 2025-11-12 | 13F | American Century Companies Inc | 0 | -100,00 | 0 | |||||
| 2026-02-10 | 13F | Connor, Clark & Lunn Investment Management Ltd. | 15.242 | 61 | ||||||
| 2026-02-13 | 13F | Citigroup Inc | 2.669 | -77,32 | 11 | -77,27 | ||||
| 2026-02-13 | 13F | National Bank Of Canada /fi/ | 9 | -99,96 | 0 | -100,00 | ||||
| 2026-02-13 | 13F | Sei Investments Co | 20.345 | 2,66 | 81 | 8,00 | ||||
| 2025-09-26 | NP | REBYX - U.S. Small Cap Equity Fund Class Y | 0 | -100,00 | 0 | -100,00 | ||||
| 2026-02-13 | 13F | Rhumbline Advisers | 64.834 | 56,76 | 259 | 64,33 | ||||
| 2026-02-13 | 13F | Centiva Capital, LP | 199.944 | -85,07 | 798 | -84,38 | ||||
| 2026-02-09 | 13F | Legal & General Group Plc | 169.484 | 2,60 | 676 | 7,47 | ||||
| 2026-02-10 | 13F | Goldman Sachs Group Inc | 800.102 | 126,45 | 3.192 | 137,15 | ||||
| 2026-01-15 | 13F | Nisa Investment Advisors, Llc | 392 | 0,00 | 2 | 0,00 | ||||
| 2025-09-24 | NP | BLACKROCK FUNDS - iShares Total U.S. Stock Market Index Fund Investor A | 0 | -100,00 | 0 | -100,00 | ||||
| 2026-02-13 | 13F | Ieq Capital, Llc | 14.648 | 58 | ||||||
| 2026-02-17 | 13F | Royal Bank Of Canada | 5.490 | -95,23 | 22 | -94,98 | ||||
| 2026-01-23 | 13F | Farther Finance Advisors, LLC | 347 | 25,27 | 1 | 0,00 | ||||
| 2026-02-09 | 13F | Huntington National Bank | 1 | 0,00 | 0 | |||||
| 2026-02-13 | 13F | Wells Fargo & Company/mn | 104.868 | 234,35 | 418 | 251,26 | ||||
| 2026-02-17 | 13F | Ghisallo Capital Management LLC | 0 | -100,00 | 0 | |||||
| 2026-02-17 | 13F | Oxford Asset Management Llp | 0 | -100,00 | 0 | -100,00 | ||||
| 2026-01-05 | 13F | GAMMA Investing LLC | 74 | 0 | ||||||
| 2026-02-02 | 13F | Wolverine Asset Management Llc | 284 | -59,66 | 1 | -50,00 | ||||
| 2026-02-10 | 13F | Bnp Paribas Arbitrage, Sa | 19.921 | 89,56 | 79 | 97,50 | ||||
| 2026-02-11 | 13F | Parallel Advisors, LLC | 375 | 1 | ||||||
| 2026-02-10 | 13F | CIBC Asset Management Inc | 18.744 | 75 | ||||||
| 2026-02-13 | 13F | Itau Unibanco Holding S.A. | 420.007 | -42,49 | 1.676 | -39,79 | ||||
| 2026-02-17 | 13F | Fmr Llc | 31.544 | 264,71 | 126 | 290,63 | ||||
| 2026-02-11 | 13F | Deutsche Bank Ag\ | 66.431 | 68,13 | 265 | 76,67 | ||||
| 2026-02-02 | 13F | Strs Ohio | 0 | -100,00 | 0 | |||||
| 2026-02-11 | 13F | Jpmorgan Chase & Co | 38.997 | 81,34 | 156 | 91,36 | ||||
| 2026-02-17 | 13F | Two Sigma Investments, Lp | 84.176 | 336 | ||||||
| 2025-09-26 | NP | TISBX - TIAA-CREF Small-Cap Blend Index Fund Institutional Class | 65.295 | 0,00 | 424 | 82,76 | ||||
| 2026-02-10 | 13F | BW Gestao de Investimentos Ltda. | 3.686.140 | 49,70 | 14.708 | 56,77 | ||||
| 2026-02-12 | 13F | Banco BTG Pactual S.A. | 346.500 | -41,91 | 1.383 | -39,17 | ||||
| 2026-02-17 | 13F | United Airlines Holdings, Inc. | 2.653.861 | 10.589 | ||||||
| 2026-02-11 | 13F | Ameritas Investment Partners, Inc. | 7.782 | 31 | ||||||
| 2025-09-24 | NP | PPNMX - SmallCap Growth Fund I R-3 | 2.716 | -48,11 | 18 | -5,56 | ||||
| 2025-09-17 | NP | GMRAX - Nationwide Small Cap Index Fund Class A | 4.262 | 0,00 | 28 | 80,00 | ||||
| 2025-09-24 | NP | BLACKROCK FUNDS - iShares Russell Small/Mid-Cap Index Fund Investor A | 8.309 | 22,32 | 54 | 125,00 | ||||
| 2025-11-14 | 13F | Cubist Systematic Strategies, LLC | 8.440 | 32 | ||||||
| 2026-02-13 | 13F | Quarry LP | 4.626 | 1.457,58 | 18 | 1.700,00 | ||||
| 2025-09-24 | NP | Innovator ETFs Trust - Innovator U.S. Small Cap Managed Floor ETF | 1.286 | 6,19 | 8 | 100,00 | ||||
| 2026-02-12 | 13F | Swiss National Bank | 133.900 | 0,00 | 534 | 4,71 | ||||
| 2026-02-13 | 13F | Manufacturers Life Insurance Company, The | 0 | -100,00 | 0 | |||||
| 2025-11-13 | 13F | Sagil Capital Llp | 0 | -100,00 | 0 | -100,00 | ||||
| 2026-02-03 | 13F | Canal Insurance CO | 10.000 | 0,00 | 0 | |||||
| 2025-09-24 | NP | FIDU - Fidelity MSCI Industrials Index ETF This fund is a listed as child fund of Fmr Llc and if that institution has disclosed ownership in this security, then these positions will not be double counted when calculating total shares and total value | 14.663 | 2,52 | 95 | 90,00 | ||||
| 2026-02-09 | 13F | Geode Capital Management, Llc | 2.213.178 | 28,45 | 8.833 | 34,51 | ||||
| 2026-02-13 | 13F | Ubs Asset Management Americas Inc | 62.445 | 47,26 | 249 | 54,66 | ||||
| 2026-02-17 | 13F | Polar Asset Management Partners Inc. | 0 | -100,00 | 0 |