Grundlæggende statistik
| Institutionelle ejere | 191 total, 191 long only, 0 short only, 0 long/short - change of -1,04% MRQ |
| Gennemsnitlig porteføljeallokering | 0.1546 % - change of 8,12% MRQ |
| Institutionelle aktier (lange) | 36.418.465 (ex 13D/G) - change of 0,02MM shares 0,05% MRQ |
| Institutionel værdi (lang) | $ 539.947 USD ($1000) |
Institutionelt ejerskab og aktionærer
Eaton Vance Tax-Managed Diversified Equity Income Fund (US:ETY) har 191 institutionelle ejere og aktionærer, der har indsendt 13D/G- eller 13F-formularer til Securities Exchange Commission (SEC). Disse institutioner har i alt 36,418,465 aktier. Største aktionærer omfatter Morgan Stanley, Raymond James Financial Inc, Wells Fargo & Company/mn, Invesco Ltd., PCEF - Invesco CEF Income Composite ETF, LPL Financial LLC, Principal Securities, Inc., Guggenheim Capital Llc, RFG Advisory, LLC, and Bank Of America Corp /de/ .
Eaton Vance Tax-Managed Diversified Equity Income Fund (NYSE:ETY) institutionel ejerskabsstruktur viser aktuelle positioner i virksomheden efter institutioner og fonde, samt seneste ændringer i positionsstørrelse. Større aktionærer kan omfatte individuelle investorer, investeringsforeninger, hedgefonde eller institutioner. Skema 13D angiver, at investoren besidder (eller besidder) mere end 5 % af virksomheden og har til hensigt (eller har til hensigt at) aktivt at forfølge en ændring i forretningsstrategi. Skema 13G indikerer en passiv investering på over 5%.
The share price as of September 8, 2025 is 16,00 / share. Previously, on September 9, 2024, the share price was 13,87 / share. This represents an increase of 15,36% over that period.

Fondens stemningsscore
Fund Sentiment Score (fka Ownership Accumulation Score) finder de aktier, der bliver mest købt af fonde. Det er resultatet af en sofistikeret, multi-faktor kvantitativ model, der identificerer virksomheder med de højeste niveauer af institutionel akkumulering. Scoringsmodellen bruger en kombination af den samlede stigning i oplyste ejere, ændringerne i porteføljeallokeringer i disse ejere og andre målinger. Tallet går fra 0 til 100, hvor højere tal indikerer et højere niveau af akkumulering for sine jævnaldrende, og 50 er gennemsnittet.
Opdateringsfrekvens: Dagligt
Se Ownership Explorer, som giver en liste over højest rangerende virksomheder.
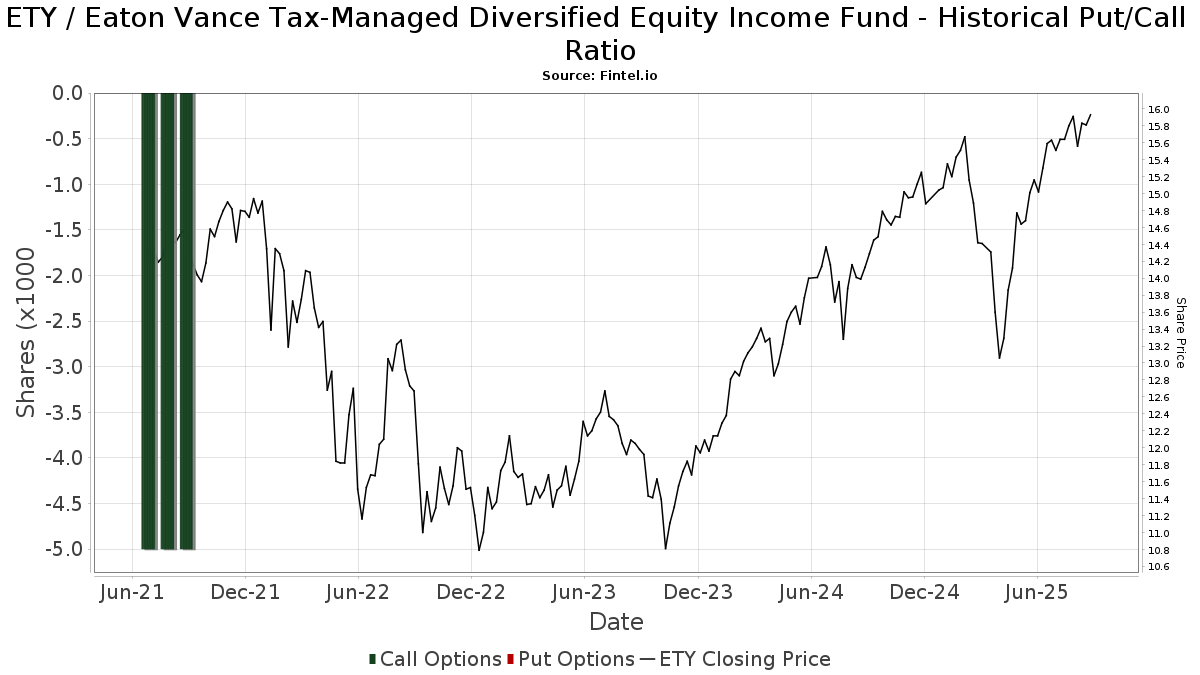
Institutionel Put/Call-forhold
Ud over at indberette standardaktie- og gældsudstedelser skal institutter med mere end 100 mill. aktiver under forvaltning også oplyse deres put- og call-optionsbeholdninger. Da salgsoptioner generelt indikerer negativ stemning, og købsoptioner indikerer positiv stemning, kan vi få en fornemmelse af den overordnede institutionelle stemning ved at plotte forholdet mellem put og kald. Diagrammet til højre viser det historiske put/call-forhold for dette instrument.
Brug af Put/Call Ratio som en indikator for investorernes stemning overvinder en af de vigtigste mangler ved at bruge totalt institutionelt ejerskab, som er, at en betydelig mængde af aktiver under forvaltning investeres passivt for at spore indekser. Passivt forvaltede fonde køber typisk ikke optioner, så indikatoren for put/call-forholdet følger mere nøje følelsen af aktivt forvaltede fonde.
13F og NPORT arkivering
Detaljer om 13F-arkivering er gratis. Detaljer om NP-ansøgninger kræver et premium-medlemskab. Grønne rækker angiver nye positioner. Røde rækker angiver lukkede positioner. Klik på linket ikon for at se den fulde transaktionshistorik.
Opgrader
for at låse premium-data op og eksportere til Excel ![]() .
.
| Fil dato | Kilde | Investor | Type | Gennemsnitlig pris (Øst) |
Aktier | Δ Aktier (%) |
Rapporteret Værdi ($1000) |
Δ Værdi (%) |
Port Alloc (%) |
|
|---|---|---|---|---|---|---|---|---|---|---|
| 2025-08-08 | 13F | Creative Planning | 46.113 | 41,29 | 713 | 53,33 | ||||
| 2025-08-12 | 13F | Jefferies Financial Group Inc. | 18.836 | 31,53 | 291 | 42,65 | ||||
| 2025-06-12 | 13F/A | Deutsche Bank Ag\ | 0 | -100,00 | 0 | |||||
| 2025-08-13 | 13F | Cerity Partners LLC | 28.792 | 38,10 | 445 | 49,83 | ||||
| 2025-07-22 | 13F | Confluence Wealth Services, Inc. | 19.312 | 1,71 | 299 | 18,25 | ||||
| 2025-08-12 | 13F | WealthTrak Capital Management LLC | 494 | 0,00 | 8 | 0,00 | ||||
| 2025-08-13 | 13F | Baird Financial Group, Inc. | 518.461 | 5,71 | 8.021 | 14,69 | ||||
| 2025-08-07 | 13F | Cvfg Llc | 12.944 | 15,10 | 200 | 25,00 | ||||
| 2025-07-29 | 13F | Salomon & Ludwin, LLC | 992 | 0,00 | 15 | 7,14 | ||||
| 2025-08-18 | 13F | Geneos Wealth Management Inc. | 13.910 | 125,45 | 215 | 147,13 | ||||
| 2025-04-18 | 13F | Insigneo Advisory Services, Llc | 0 | -100,00 | 0 | -100,00 | ||||
| 2025-07-17 | 13F | City Holding Co | 0 | -100,00 | 0 | |||||
| 2025-08-14 | 13F | Kovitz Investment Group Partners, LLC | 16.282 | 56,39 | 252 | 69,59 | ||||
| 2025-08-14 | 13F | Monograph Wealth Advisors, Llc | 18.288 | 0,02 | 283 | 8,46 | ||||
| 2025-08-08 | 13F | Capital Investment Advisory Services, LLC | 19.674 | 74,40 | 304 | 90,00 | ||||
| 2025-08-13 | 13F | Mount Yale Investment Advisors, LLC | 2.333 | 36 | ||||||
| 2025-07-17 | 13F | Uncommon Cents Investing LLC | 10.384 | 0,00 | 161 | 8,11 | ||||
| 2025-07-24 | 13F | IFP Advisors, Inc | 1.041 | -34,94 | 16 | -27,27 | ||||
| 2025-07-31 | 13F | Curio Wealth, Llc | 0 | -100,00 | 0 | |||||
| 2025-07-31 | 13F | Cambridge Investment Research Advisors, Inc. | 390.591 | -11,36 | 6 | 0,00 | ||||
| 2025-08-08 | 13F | Cetera Investment Advisers | 241.286 | 15,14 | 3.733 | 24,90 | ||||
| 2025-07-30 | 13F | Princeton Global Asset Management LLC | 4.983 | 0,00 | 77 | 8,45 | ||||
| 2025-08-06 | 13F | Moors & Cabot, Inc. | 0 | -100,00 | 0 | |||||
| 2025-07-29 | 13F | Stratos Wealth Advisors, LLC | 34.269 | 0,00 | 530 | 8,61 | ||||
| 2025-07-10 | 13F | Oliver Lagore Vanvalin Investment Group | 12.755 | -3,37 | 182 | -8,12 | ||||
| 2025-05-02 | 13F | Dakota Wealth Management | 0 | -100,00 | 0 | |||||
| 2025-08-13 | 13F | Guggenheim Capital Llc | 1.036.165 | 7,76 | 16.029 | 16,91 | ||||
| 2025-08-29 | 13F | Centaurus Financial, Inc. | 42.136 | -11,77 | 1 | |||||
| 2025-08-12 | 13F | Proequities, Inc. | 0 | 0 | ||||||
| 2025-08-08 | 13F | Kane Investment Management, Inc. | 0 | -100,00 | 0 | |||||
| 2025-07-15 | 13F | Beacon Investment Advisory Services, Inc. | 10.000 | 0,00 | 155 | 8,45 | ||||
| 2025-07-29 | 13F | Stratos Wealth Partners, LTD. | 13.728 | 7,17 | 212 | 16,48 | ||||
| 2025-07-29 | 13F | Burford Brothers, Inc. | 21.400 | 0,00 | 331 | 8,52 | ||||
| 2025-08-05 | 13F | GPS Wealth Strategies Group, LLC | 233.555 | -0,55 | 3.613 | 7,92 | ||||
| 2025-08-14 | 13F | CoreFirst Bank & Trust | 625 | 10 | ||||||
| 2025-08-12 | 13F | CIBC Private Wealth Group, LLC | 2.412 | 0,00 | 37 | 27,59 | ||||
| 2025-08-13 | 13F | Nicolet Advisory Services, Llc | 23.634 | 0,00 | 366 | 17,68 | ||||
| 2025-08-01 | 13F | Transcend Wealth Collective, Llc | 10.428 | 161 | ||||||
| 2025-08-15 | 13F | Captrust Financial Advisors | 14.213 | -16,46 | 220 | -9,50 | ||||
| 2025-08-14 | 13F | Stifel Financial Corp | 423.473 | 8,05 | 6.551 | 17,23 | ||||
| 2025-08-12 | 13F | South Plains Financial, Inc. | 0 | -100,00 | 0 | |||||
| 2025-08-05 | 13F | Bank of New York Mellon Corp | 17.001 | -0,01 | 263 | 8,68 | ||||
| 2025-08-14 | 13F | Hrt Financial Lp | 0 | -100,00 | 0 | |||||
| 2025-07-14 | 13F | Golden State Equity Partners | 11.003 | 0,00 | 170 | 8,97 | ||||
| 2025-07-31 | 13F | Oppenheimer & Co Inc | 19.877 | 0,13 | 307 | 8,48 | ||||
| 2025-04-29 | 13F | Raleigh Capital Management Inc. | 0 | -100,00 | 0 | |||||
| 2025-08-12 | 13F | Quantum Private Wealth, LLC | 15.000 | -25,00 | 232 | -18,60 | ||||
| 2025-07-25 | 13F | Stephens Consulting, LLC | 0 | -100,00 | 0 | |||||
| 2025-07-28 | 13F | Mutual Advisors, LLC | 11.122 | 1,86 | 175 | 16,78 | ||||
| 2025-05-08 | 13F | Essential Planning, LLC. | 0 | -100,00 | 0 | |||||
| 2025-05-12 | 13F | Independent Advisor Alliance | 0 | -100,00 | 0 | |||||
| 2025-07-15 | 13F | Focused Wealth Management, Inc | 11.454 | -13,55 | 177 | -5,85 | ||||
| 2025-08-08 | 13F | Avantax Advisory Services, Inc. | 16.791 | 0,16 | 260 | 8,37 | ||||
| 2025-08-11 | 13F | Elequin Capital Lp | 1.155 | -85,10 | 18 | -84,55 | ||||
| 2025-08-13 | 13F | Smith, Moore & Co. | 67.626 | 15,84 | 1.046 | 25,72 | ||||
| 2025-05-05 | 13F | Transce3nd, LLC | 0 | -100,00 | 0 | |||||
| 2025-07-29 | 13F | Chicago Partners Investment Group LLC | 13.486 | 0,00 | 211 | 10,53 | ||||
| 2025-04-25 | 13F | Smallwood Wealth Investment Management, LLC | 2.437 | 35 | ||||||
| 2025-07-24 | 13F | Ronald Blue Trust, Inc. | 800 | 12 | ||||||
| 2025-08-14 | 13F | Goldman Sachs Group Inc | 100.000 | -14,20 | 1.547 | -6,86 | ||||
| 2025-08-14 | 13F | Wiley Bros.-aintree Capital, Llc | 40.250 | 177,17 | 623 | 201,94 | ||||
| 2025-07-11 | 13F | Farther Finance Advisors, LLC | 5.096 | 1,03 | 79 | 9,86 | ||||
| 2025-08-08 | 13F | Hartland & Co., LLC | 15.525 | 23,30 | 240 | 34,08 | ||||
| 2025-04-28 | 13F | Pinnacle Financial Partners Inc | 9.122 | -26,64 | 136 | -25,27 | ||||
| 2025-08-08 | 13F/A | Ignite Planners, LLC | 44.598 | -5,54 | 693 | 4,85 | ||||
| 2025-08-05 | 13F | Key FInancial Inc | 1.599 | 0,00 | 25 | 9,09 | ||||
| 2025-08-14 | 13F | Mml Investors Services, Llc | 28.508 | 10,13 | 0 | |||||
| 2025-08-12 | 13F | NWF Advisory Services Inc. | 46.999 | 670 | ||||||
| 2025-08-07 | 13F | Vista Investment Partners Ii, Llc | 12.414 | 12,14 | 192 | 22,29 | ||||
| 2025-07-18 | 13F | Truist Financial Corp | 43.201 | 5,89 | 668 | 14,97 | ||||
| 2025-08-04 | 13F | ELCO Management Co., LLC | 46.400 | -2,11 | 718 | 6,22 | ||||
| 2025-08-19 | 13F | National Asset Management, Inc. | 10.337 | -61,37 | 160 | -60,15 | ||||
| 2025-07-24 | 13F | Us Bancorp \de\ | 8.863 | -0,78 | 137 | 7,87 | ||||
| 2025-07-28 | 13F | Harbour Investments, Inc. | 21.633 | 13,44 | 335 | 23,25 | ||||
| 2025-08-14 | 13F | Smartleaf Asset Management LLC | 234 | 0,00 | 4 | 0,00 | ||||
| 2025-08-14 | 13F | IHT Wealth Management, LLC | 357.335 | 4,17 | 5.528 | 13,00 | ||||
| 2025-08-05 | 13F | Summit Investment Advisory Services, LLC | 0 | -100,00 | 0 | |||||
| 2025-07-30 | 13F | D.a. Davidson & Co. | 18.011 | 2,86 | 279 | 11,65 | ||||
| 2025-08-07 | 13F | Cypress Capital Management LLC (WY) | 280.492 | 141,32 | 4.339 | 161,86 | ||||
| 2025-07-15 | 13F | MCF Advisors LLC | 1.744 | 0,00 | 27 | 8,33 | ||||
| 2025-08-12 | 13F | LPL Financial LLC | 1.174.809 | 3,77 | 18.174 | 12,57 | ||||
| 2025-08-12 | 13F | Putnam Fl Investment Management Co | 42.458 | -0,57 | 657 | 7,89 | ||||
| 2025-08-12 | 13F | Global Retirement Partners, LLC | 9.282 | -50,37 | 144 | -48,75 | ||||
| 2025-08-19 | 13F | Newbridge Financial Services Group, Inc. | 39.668 | 614 | ||||||
| 2025-08-07 | 13F | Commerce Bank | 30.743 | 0,00 | 476 | 8,45 | ||||
| 2025-08-15 | 13F | Morgan Stanley | 12.285.081 | -0,79 | 190.050 | 7,63 | ||||
| 2025-07-17 | 13F | Sonora Investment Management Group, LLC | 10.312 | 0,00 | 160 | 8,16 | ||||
| 2025-08-14 | 13F | Cohen & Steers, Inc. | 295.617 | 0,00 | 5 | 0,00 | ||||
| 2025-07-17 | 13F | Greenleaf Trust | 39.274 | -4,99 | 608 | 3,06 | ||||
| 2025-08-04 | 13F | L.m. Kohn & Company | 18.964 | 33,14 | 293 | 44,33 | ||||
| 2025-07-30 | 13F | Dudley Capital Management, Llc | 11.986 | 0,76 | 185 | 9,47 | ||||
| 2025-07-25 | 13F | Atria Wealth Solutions, Inc. | 54.625 | 88,78 | 845 | 105,10 | ||||
| 2025-08-14 | 13F | EP Wealth Advisors, Inc. | 29.485 | 456 | ||||||
| 2025-07-28 | NP | PCEF - Invesco CEF Income Composite ETF This fund is a listed as child fund of Invesco Ltd. and if that institution has disclosed ownership in this security, then these positions will not be double counted when calculating total shares and total value | 1.325.862 | -13,66 | 19.848 | -14,52 | ||||
| 2025-08-11 | 13F | HighTower Advisors, LLC | 298.312 | 2,98 | 4.615 | 11,72 | ||||
| 2025-05-15 | 13F | Lido Advisors, LLC | 0 | -100,00 | 0 | |||||
| 2025-08-08 | 13F | Wealth Alliance | 19.224 | 4,69 | 297 | 13,79 | ||||
| 2025-07-22 | 13F | Merit Financial Group, LLC | 130.897 | 3,69 | 2.025 | 12,44 | ||||
| 2025-08-14 | 13F | UBS Group AG | 467.163 | -0,50 | 7.227 | 7,95 | ||||
| 2025-08-11 | 13F | Aptus Capital Advisors, LLC | 166.110 | 0,00 | 2.570 | 8,49 | ||||
| 2025-07-29 | 13F | International Assets Investment Management, Llc | 41.415 | 4,54 | 641 | 13,48 | ||||
| 2025-08-15 | 13F | CI Private Wealth, LLC | 30.474 | -7,02 | 471 | 0,86 | ||||
| 2025-07-29 | 13F | Activest Wealth Management | 3.325 | -41,09 | 51 | -36,25 | ||||
| 2025-08-08 | 13F | Kingsview Wealth Management, LLC | 77.215 | 30,88 | 1.195 | 41,97 | ||||
| 2025-07-30 | 13F | Bogart Wealth, LLC | 3.231 | 0,00 | 50 | 6,52 | ||||
| 2025-08-12 | 13F | MAI Capital Management | 6.991 | 1,27 | 108 | 10,20 | ||||
| 2025-08-01 | 13F | Chilton Capital Management Llc | 3.700 | 0,00 | 57 | 9,62 | ||||
| 2025-05-14 | 13F | Synovus Financial Corp | 0 | -100,00 | 0 | |||||
| 2025-07-30 | 13F | Retirement Planning Group | 10.139 | 0,00 | 157 | 8,33 | ||||
| 2025-07-24 | 13F | Eastern Bank | 2.344 | 0,00 | 36 | 9,09 | ||||
| 2025-04-28 | 13F | Redmont Wealth Advisors Llc | 5.138 | 73 | ||||||
| 2025-05-09 | 13F | Shaker Financial Services, LLC | 0 | -100,00 | 0 | |||||
| 2025-08-04 | 13F | Assetmark, Inc | 3.325 | 68,27 | 51 | 82,14 | ||||
| 2025-07-29 | 13F | Private Trust Co Na | 4.035 | 0,00 | 62 | 8,77 | ||||
| 2025-07-09 | 13F | Byrne Asset Management LLC | 400 | 0,00 | 6 | 20,00 | ||||
| 2025-07-23 | 13F | Morey & Quinn Wealth Partners, LLC | 49.046 | 15,54 | 759 | 25,29 | ||||
| 2025-07-22 | 13F | Cedar Mountain Advisors, LLC | 768 | 0,00 | 12 | 10,00 | ||||
| 2025-08-14 | 13F | Mariner, LLC | 44.250 | 20,64 | 685 | 30,78 | ||||
| 2025-08-15 | 13F | Kestra Advisory Services, LLC | 95.777 | 27,22 | 1.482 | 38,02 | ||||
| 2025-04-21 | 13F | Nelson, Van Denburg & Campbell Wealth Management Group, LLC | 0 | -100,00 | 0 | |||||
| 2025-07-21 | 13F | Barrett & Company, Inc. | 3.250 | 0,00 | 50 | 8,70 | ||||
| 2025-08-12 | 13F | Ameritas Investment Partners, Inc. | 35.085 | 8,33 | 543 | 17,57 | ||||
| 2025-08-14 | 13F | Atomi Financial Group, Inc. | 77.507 | 3,55 | 1.199 | 12,37 | ||||
| 2025-08-12 | 13F | J.w. Cole Advisors, Inc. | 24.653 | -6,08 | 381 | 1,87 | ||||
| 2025-08-01 | 13F | Twin Lakes Capital Management, LLC | 3.181 | 2,02 | 49 | 11,36 | ||||
| 2025-08-12 | 13F | Gladstone Institutional Advisory LLC | 56.500 | 0,16 | 874 | 8,71 | ||||
| 2025-08-14 | 13F | Mendel Capital Management LLC | 20.188 | -16,41 | 312 | -9,30 | ||||
| 2025-07-17 | 13F | C2C Wealth Management, LLC | 238.094 | -2,18 | 3.683 | 6,14 | ||||
| 2025-08-14 | 13F | Guardian Wealth Advisors, Llc / Nc | 164.610 | 0,00 | 2.547 | 8,48 | ||||
| 2025-07-14 | 13F/A | Seek First Inc. | 20.998 | 26,88 | 325 | 37,87 | ||||
| 2025-08-14 | 13F | Comerica Bank | 95.647 | -3,51 | 1.480 | 4,67 | ||||
| 2025-08-15 | 13F | Equitable Holdings, Inc. | 13.050 | 4,03 | 202 | 12,92 | ||||
| 2025-07-11 | 13F | Kapstone Financial Advisors LLC | 11.266 | 2,74 | 174 | 11,54 | ||||
| 2025-08-12 | 13F | Change Path, LLC | 14.169 | -84,25 | 219 | -82,92 | ||||
| 2025-08-14 | 13F | Mercer Global Advisors Inc /adv | 24.861 | -0,36 | 385 | 8,17 | ||||
| 2025-07-08 | 13F | Parallel Advisors, LLC | 5.000 | -60,74 | 77 | -57,46 | ||||
| 2025-07-10 | 13F | Exchange Traded Concepts, Llc | 3.809 | 59 | ||||||
| 2025-08-15 | 13F | Blue Chip Partners, Inc. | 15.447 | 0,00 | 239 | 8,18 | ||||
| 2025-08-08 | 13F | Flaharty Asset Management, LLC | 34.107 | 4,15 | 528 | 13,09 | ||||
| 2025-08-12 | 13F | Jpmorgan Chase & Co | 2.987 | -28,09 | 46 | -22,03 | ||||
| 2025-08-06 | 13F | Commonwealth Equity Services, Llc | 239.474 | 10,61 | 4 | 0,00 | ||||
| 2025-08-11 | 13F | Private Advisor Group, LLC | 225.324 | 0,54 | 3.486 | 9,08 | ||||
| 2025-08-14 | 13F | Garden State Investment Advisory Services LLC | 14.407 | 0,41 | 223 | 8,82 | ||||
| 2025-07-18 | 13F | Parsons Capital Management Inc/ri | 150.136 | -5,70 | 2.323 | 2,29 | ||||
| 2025-08-08 | 13F | TD Capital Management LLC | 1.302 | 0,00 | 20 | 11,11 | ||||
| 2025-08-07 | 13F | Hughes Financial Services, LLC | 2.121 | 0,00 | 34 | 10,00 | ||||
| 2025-07-14 | 13F | AdvisorNet Financial, Inc | 618 | 10 | ||||||
| 2025-08-01 | 13F | Envestnet Asset Management Inc | 19.572 | 4,52 | 303 | 13,11 | ||||
| 2025-05-13 | 13F | Northern Trust Corp | 0 | -100,00 | 0 | |||||
| 2025-07-16 | 13F | Formidable Asset Management, LLC | 35.852 | 0,00 | 511 | 0,00 | ||||
| 2025-08-05 | 13F | Mission Wealth Management, Lp | 14.499 | -12,12 | 224 | -4,68 | ||||
| 2025-08-14 | 13F/A | Rockefeller Capital Management L.P. | 301.117 | 2,49 | 4.658 | 11,20 | ||||
| 2025-08-14 | 13F | Wells Fargo & Company/mn | 1.954.890 | 4,04 | 30.242 | 12,87 | ||||
| 2025-07-30 | 13F | Capital Wealth Alliance, LLC | 16.470 | 0,00 | 255 | 8,55 | ||||
| 2025-07-21 | 13F | Compass Planning Associates Inc | 17.450 | 0,00 | 270 | 8,47 | ||||
| 2025-08-05 | 13F | Dunhill Financial, LLC | 533 | 8 | ||||||
| 2025-08-13 | 13F | Beacon Pointe Advisors, LLC | 21.918 | 0,00 | 339 | 8,65 | ||||
| 2025-07-10 | 13F | Wealth Enhancement Advisory Services, Llc | 42.163 | 4,51 | 660 | 14,78 | ||||
| 2025-07-29 | 13F | Stephens Inc /ar/ | 10.734 | 0,37 | 166 | 9,21 | ||||
| 2025-08-13 | 13F | Millstone Evans Group, LLC | 6.322 | 0,00 | 98 | 7,78 | ||||
| 2025-07-11 | 13F | Kingstone Capital Partners Texas, LLC | 23.948 | 0 | ||||||
| 2025-08-13 | 13F | Invesco Ltd. | 1.513.968 | -0,62 | 23.421 | 7,82 | ||||
| 2025-08-13 | 13F/A | StoneX Group Inc. | 0 | -100,00 | 0 | -100,00 | ||||
| 2025-08-14 | 13F | Ameriprise Financial Inc | 410.548 | -52,51 | 6.327 | -48,68 | ||||
| 2025-07-14 | 13F | U.S. Capital Wealth Advisors, LLC | 19.105 | -57,14 | 296 | -53,54 | ||||
| 2025-08-12 | 13F | Heron Bay Capital Management | 406.483 | 28,38 | 6.288 | 39,27 | ||||
| 2025-04-17 | 13F | Fortitude Advisory Group L.L.C. | 0 | -100,00 | 0 | -100,00 | ||||
| 2025-08-14 | 13F | Matrix Private Capital Group Llc | 629.694 | -2,67 | 9.741 | 5,59 | ||||
| 2025-08-11 | 13F | HHM Wealth Advisors, LLC | 3.587 | 2,05 | 55 | 10,00 | ||||
| 2025-08-15 | 13F | Tower Research Capital LLC (TRC) | 4 | -50,00 | 0 | |||||
| 2025-08-12 | 13F | BlackRock, Inc. | 7.377 | 0,00 | 114 | 8,57 | ||||
| 2025-08-14 | 13F | Royal Bank Of Canada | 713.247 | 1,87 | 11.033 | 10,51 | ||||
| 2025-08-11 | 13F | Hexagon Capital Partners LLC | 0 | -100,00 | 0 | |||||
| 2025-08-13 | 13F | Northwestern Mutual Wealth Management Co | 22.374 | -0,63 | 346 | 7,79 | ||||
| 2025-08-11 | 13F | Principal Securities, Inc. | 1.134.479 | 7,16 | 17.550 | 10,89 | ||||
| 2025-08-12 | 13F | Advisors Asset Management, Inc. | 292.815 | 14,59 | 4.530 | 24,32 | ||||
| 2025-08-28 | NP | Cohen & Steers Closed-end Opportunity Fund, Inc. | 295.617 | 0,00 | 4.573 | 8,49 | ||||
| 2025-08-04 | 13F | Syverson Strege & Co | 17.665 | 0,00 | 273 | 8,76 | ||||
| 2025-08-14 | 13F | Arete Wealth Advisors, LLC | 27.122 | -0,35 | 0 | |||||
| 2025-05-08 | 13F | Plante Moran Financial Advisors, LLC | 0 | -100,00 | 0 | |||||
| 2025-05-13 | 13F | M Holdings Securities, Inc. | 0 | -100,00 | 0 | |||||
| 2025-05-20 | 13F/A | Colony Group, LLC | 0 | -100,00 | 0 | -100,00 | ||||
| 2025-08-12 | 13F | Steward Partners Investment Advisory, Llc | 196.325 | 6,35 | 3.037 | 15,39 | ||||
| 2025-07-15 | 13F | SJS Investment Consulting Inc. | 65 | 1 | ||||||
| 2025-07-25 | 13F | Concurrent Investment Advisors, LLC | 21.771 | 337 | ||||||
| 2025-07-17 | 13F | Sound Income Strategies, LLC | 2.667 | 0,00 | 41 | 7,89 | ||||
| 2025-08-07 | 13F | Allworth Financial LP | 7.967 | 0,00 | 123 | 14,95 | ||||
| 2025-08-14 | 13F | CoreCap Advisors, LLC | 336.018 | 3,46 | 5.198 | 12,24 | ||||
| 2025-08-08 | 13F | Pnc Financial Services Group, Inc. | 43.446 | 0,00 | 672 | 8,56 | ||||
| 2025-07-01 | 13F | Harbor Investment Advisory, Llc | 0 | -100,00 | 0 | |||||
| 2025-07-22 | 13F | Mascoma Wealth Management LLC | 3.190 | 0,00 | 49 | 8,89 | ||||
| 2025-08-25 | 13F/A | Neuberger Berman Group LLC | 11.312 | 0,00 | 175 | 8,07 | ||||
| 2025-09-04 | 13F/A | Advisor Group Holdings, Inc. | 551.166 | -9,90 | 8.527 | -2,26 | ||||
| 2025-08-13 | 13F | Brown Advisory Inc | 13.063 | -6,29 | 202 | 2,02 | ||||
| 2025-07-25 | 13F | Cwm, Llc | 1.084 | -84,43 | 0 | |||||
| 2025-08-05 | 13F | Strategic Financial Concepts, LLC | 15.415 | -0,39 | 238 | 8,18 | ||||
| 2025-07-17 | 13F | Janney Montgomery Scott LLC | 314.945 | 1,61 | 5 | 0,00 | ||||
| 2025-05-14 | 13F | Karpus Management, Inc. | 0 | -100,00 | 0 | |||||
| 2025-08-04 | 13F | Spire Wealth Management | 1.000 | 0,00 | 15 | 7,14 | ||||
| 2025-08-14 | 13F | Gen-Wealth Partners Inc | 850 | 0,00 | 13 | 8,33 | ||||
| 2025-07-28 | 13F | Frazier Financial Advisors, LLC | 95 | 0,00 | 1 | 0,00 | ||||
| 2025-07-21 | 13F | Ameritas Advisory Services, LLC | 37.265 | -27,73 | 576 | -25,19 | ||||
| 2025-08-13 | 13F | Rsm Us Wealth Management Llc | 27.393 | 0,00 | 424 | 8,46 | ||||
| 2025-08-14 | 13F | LaSalle St. Investment Advisors, LLC | 0 | -100,00 | 0 | |||||
| 2025-04-25 | 13F | Intelligence Driven Advisers, LLC | 0 | -100,00 | 0 | |||||
| 2025-07-15 | 13F | Wealth Effects Llc | 43.812 | -11,63 | 678 | -4,11 | ||||
| 2025-08-14 | 13F | Raymond James Financial Inc | 2.643.146 | 1,91 | 40.889 | 10,56 | ||||
| 2025-07-09 | 13F | David J Yvars Group | 40.622 | 1,20 | 628 | 9,98 | ||||
| 2025-07-09 | 13F | Fiduciary Alliance LLC | 22.450 | 347 | ||||||
| 2025-08-06 | 13F | Wedbush Securities Inc | 139.198 | -0,07 | 2 | 100,00 | ||||
| 2025-07-08 | 13F | Webster Bank, N. A. | 4.825 | 0,00 | 75 | 8,82 | ||||
| 2025-08-12 | 13F | Inscription Capital, LLC | 10.132 | -13,40 | 157 | 0,00 | ||||
| 2025-07-15 | 13F | Financial Management Professionals, Inc. | 1.000 | 0,00 | 15 | 7,14 | ||||
| 2025-07-31 | 13F | Strait & Sound Wealth Management LLC | 38.250 | 0,28 | 592 | 8,84 | ||||
| 2025-08-14 | 13F | Bank Of America Corp /de/ | 808.900 | 4,36 | 12.514 | 13,21 | ||||
| 2025-08-21 | 13F | Pathway Financial Advisers, LLC | 385.599 | 3,55 | 5.965 | 12,34 | ||||
| 2025-07-15 | 13F | LVZ Advisors, Inc. | 0 | -100,00 | 0 | |||||
| 2025-07-30 | 13F | Onyx Bridge Wealth Group LLC | 19.449 | 2,04 | 301 | 10,70 | ||||
| 2025-08-12 | 13F | Bokf, Na | 0 | -100,00 | 0 | |||||
| 2025-07-31 | 13F | CNB Bank | 4.590 | 0,00 | 71 | 9,23 | ||||
| 2025-08-14 | 13F | GWM Advisors LLC | 67.795 | 17,23 | 1.049 | 27,18 | ||||
| 2025-07-28 | 13F | RFG Advisory, LLC | 928.828 | -5,25 | 14.369 | 2,79 | ||||
| 2025-08-05 | 13F | Pointe Capital Management LLC | 137.204 | 0,32 | 2.123 | 8,82 | ||||
| 2025-08-13 | 13F | Summit Financial, LLC | 51.079 | 790 |