Grundlæggende statistik
| Institutionelle ejere | 155 total, 155 long only, 0 short only, 0 long/short - change of 2,65% MRQ |
| Gennemsnitlig porteføljeallokering | 0.3735 % - change of 8,39% MRQ |
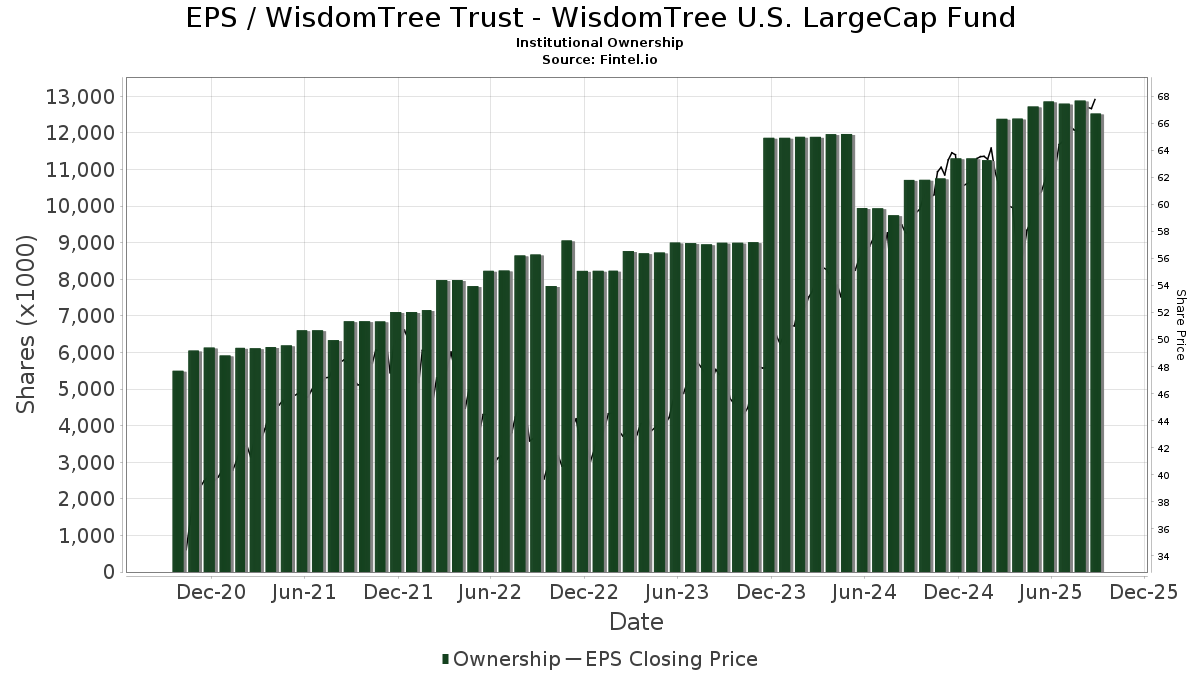
| Institutionelle aktier (lange) | 12.531.110 (ex 13D/G) - change of -0,27MM shares -2,11% MRQ |
| Institutionel værdi (lang) | $ 794.587 USD ($1000) |
Institutionelt ejerskab og aktionærer
WisdomTree Trust - WisdomTree U.S. LargeCap Fund (US:EPS) har 155 institutionelle ejere og aktionærer, der har indsendt 13D/G- eller 13F-formularer til Securities Exchange Commission (SEC). Disse institutioner har i alt 12,531,110 aktier. Største aktionærer omfatter Fiduciary Trust Co, LPL Financial LLC, Private Advisor Group, LLC, Morgan Stanley, Lido Advisors, LLC, Garrett Wealth Advisory Group, LLC, Team Financial Group, LLC, Cetera Investment Advisers, Financial Gravity Companies, Inc., and Ieq Capital, Llc .
WisdomTree Trust - WisdomTree U.S. LargeCap Fund (ARCA:EPS) institutionel ejerskabsstruktur viser aktuelle positioner i virksomheden efter institutioner og fonde, samt seneste ændringer i positionsstørrelse. Større aktionærer kan omfatte individuelle investorer, investeringsforeninger, hedgefonde eller institutioner. Skema 13D angiver, at investoren besidder (eller besidder) mere end 5 % af virksomheden og har til hensigt (eller har til hensigt at) aktivt at forfølge en ændring i forretningsstrategi. Skema 13G indikerer en passiv investering på over 5%.
The share price as of September 18, 2025 is 68,88 / share. Previously, on September 18, 2024, the share price was 58,81 / share. This represents an increase of 17,12% over that period.
Fondens stemningsscore
Fund Sentiment Score (fka Ownership Accumulation Score) finder de aktier, der bliver mest købt af fonde. Det er resultatet af en sofistikeret, multi-faktor kvantitativ model, der identificerer virksomheder med de højeste niveauer af institutionel akkumulering. Scoringsmodellen bruger en kombination af den samlede stigning i oplyste ejere, ændringerne i porteføljeallokeringer i disse ejere og andre målinger. Tallet går fra 0 til 100, hvor højere tal indikerer et højere niveau af akkumulering for sine jævnaldrende, og 50 er gennemsnittet.
Opdateringsfrekvens: Dagligt
Se Ownership Explorer, som giver en liste over højest rangerende virksomheder.
Institutionel Put/Call-forhold
Ud over at indberette standardaktie- og gældsudstedelser skal institutter med mere end 100 mill. aktiver under forvaltning også oplyse deres put- og call-optionsbeholdninger. Da salgsoptioner generelt indikerer negativ stemning, og købsoptioner indikerer positiv stemning, kan vi få en fornemmelse af den overordnede institutionelle stemning ved at plotte forholdet mellem put og kald. Diagrammet til højre viser det historiske put/call-forhold for dette instrument.
Brug af Put/Call Ratio som en indikator for investorernes stemning overvinder en af de vigtigste mangler ved at bruge totalt institutionelt ejerskab, som er, at en betydelig mængde af aktiver under forvaltning investeres passivt for at spore indekser. Passivt forvaltede fonde køber typisk ikke optioner, så indikatoren for put/call-forholdet følger mere nøje følelsen af aktivt forvaltede fonde.
13F og NPORT arkivering
Detaljer om 13F-arkivering er gratis. Detaljer om NP-ansøgninger kræver et premium-medlemskab. Grønne rækker angiver nye positioner. Røde rækker angiver lukkede positioner. Klik på linket ikon for at se den fulde transaktionshistorik.
Opgrader
for at låse premium-data op og eksportere til Excel ![]() .
.
| Fil dato | Kilde | Investor | Type | Gennemsnitlig pris (Øst) |
Aktier | Δ Aktier (%) |
Rapporteret Værdi ($1000) |
Δ Værdi (%) |
Port Alloc (%) |
|
|---|---|---|---|---|---|---|---|---|---|---|
| 2025-07-23 | 13F | REAP Financial Group, LLC | 2.773 | -7,97 | 177 | -0,56 | ||||
| 2025-07-23 | 13F | Secured Retirement Advisors, Llc | 3.759 | -24,65 | 241 | -18,64 | ||||
| 2025-08-11 | 13F | Lowe Brockenbrough & Co Inc | 46.252 | 0,00 | 2.961 | 7,99 | ||||
| 2025-07-23 | 13F | Charter Trust Co | 5.721 | 0,00 | 366 | 7,96 | ||||
| 2025-07-29 | 13F | Chicago Partners Investment Group LLC | 26.237 | 0,21 | 1.725 | 12,38 | ||||
| 2025-08-14 | 13F | Quartz Partners, LLC | 10.425 | -0,32 | 667 | 7,75 | ||||
| 2025-07-22 | 13F | Old National Bancorp /in/ | 0 | -100,00 | 0 | |||||
| 2025-08-11 | 13F | Perennial Investment Advisors, LLC | 0 | -100,00 | 0 | |||||
| 2025-08-14 | 13F | Fort Point Capital Partners LLC | 4.810 | 3,89 | 308 | 12,04 | ||||
| 2025-08-05 | 13F | NewSquare Capital LLC | 69.955 | 7,12 | 4.478 | 15,65 | ||||
| 2025-07-10 | 13F | Wealth Enhancement Advisory Services, Llc | 24.615 | 2,44 | 1.599 | 12,22 | ||||
| 2025-07-25 | 13F | Envestnet Portfolio Solutions, Inc. | 0 | -100,00 | 0 | |||||
| 2025-07-22 | 13F | Berger Financial Group, Inc | 8.129 | -0,39 | 520 | 7,66 | ||||
| 2025-08-15 | 13F | Morgan Stanley | 934.478 | -5,27 | 59.816 | 2,29 | ||||
| 2025-08-12 | 13F | Steward Partners Investment Advisory, Llc | 12.514 | -2,20 | 801 | 5,67 | ||||
| 2025-05-14 | 13F | Portfolio Design Labs, LLC | 0 | -100,00 | 0 | |||||
| 2025-04-30 | 13F | Sofos Investments, Inc. | 260.707 | -0,94 | 15.455 | 3,67 | ||||
| 2025-07-25 | 13F | We Are One Seven, LLC | 4.728 | -20,30 | 303 | -13,96 | ||||
| 2025-08-14 | 13F | Smartleaf Asset Management LLC | 132 | 2,33 | 8 | 14,29 | ||||
| 2025-08-14 | 13F | UBS Group AG | 100.724 | -11,63 | 6.447 | -4,57 | ||||
| 2025-08-14 | 13F | Vista Investment Management | 82.899 | 0,90 | 5.306 | 8,95 | ||||
| 2025-08-12 | 13F | SRS Capital Advisors, Inc. | 61 | 4 | ||||||
| 2025-05-12 | 13F | Independent Advisor Alliance | 0 | -100,00 | 0 | |||||
| 2025-07-24 | 13F | Stonebridge Financial Group, LLC | 0 | -100,00 | 0 | |||||
| 2025-07-14 | 13F/A | Seek First Inc. | 10.956 | 0,37 | 701 | 8,35 | ||||
| 2025-08-11 | 13F | Covestor Ltd | 105 | 0,96 | 0 | |||||
| 2025-08-04 | 13F | Spire Wealth Management | 100 | 0,00 | 6 | 20,00 | ||||
| 2025-08-14 | 13F | Ieq Capital, Llc | 265.154 | 0,00 | 16.973 | 7,98 | ||||
| 2025-07-08 | 13F | Nbc Securities, Inc. | 6.797 | -8,30 | 0 | |||||
| 2025-08-13 | 13F | Lido Advisors, LLC | 869.660 | -3,78 | 55.667 | 3,89 | ||||
| 2025-08-13 | 13F | GM Advisory Group, Inc. | 17.414 | -16,59 | 1.115 | -9,94 | ||||
| 2025-08-05 | 13F | GPS Wealth Strategies Group, LLC | 1.375 | 0,00 | 88 | 8,64 | ||||
| 2025-08-06 | 13F | Walkner Condon Financial Advisors LLC | 4.249 | 0,00 | 272 | 7,97 | ||||
| 2025-08-12 | 13F | Garrett Wealth Advisory Group, LLC | 792.460 | 1,78 | 50.725 | 9,90 | ||||
| 2025-08-26 | NP | EVAGX - The E-Valuator Aggressive Growth (85%-99%) RMS Fund Service Class Shares | 26.464 | 1.694 | ||||||
| 2025-07-21 | 13F | Patriot Financial Group Insurance Agency, LLC | 17.066 | -9,69 | 1.092 | -2,50 | ||||
| 2025-08-08 | 13F | Cetera Investment Advisers | 445.451 | 5,27 | 28.513 | 13,67 | ||||
| 2025-08-12 | 13F | CIBC Private Wealth Group, LLC | 160 | 0,00 | 10 | 25,00 | ||||
| 2025-08-08 | 13F | Financial Gravity Companies, Inc. | 277.453 | 15,11 | 17.760 | 20,43 | ||||
| 2025-08-13 | 13F | Maia Wealth LLC | 41.934 | 94,91 | 2.684 | 120,36 | ||||
| 2025-08-07 | 13F | Rathbone Brothers plc | 10.790 | 0,00 | 691 | 7,98 | ||||
| 2025-08-12 | 13F | MAI Capital Management | 1.023 | 0,00 | 65 | 8,33 | ||||
| 2025-08-13 | 13F | Transce3nd, LLC | 268 | 0,00 | 17 | 13,33 | ||||
| 2025-07-07 | 13F | Thurston, Springer, Miller, Herd & Titak, Inc. | 480 | 0,42 | 31 | 7,14 | ||||
| 2025-07-29 | 13F | Swmg, Llc | 4.476 | 295 | ||||||
| 2025-08-04 | 13F | Atria Investments Llc | 9.209 | 29,03 | 589 | 39,24 | ||||
| 2025-07-15 | 13F | Mather Group, Llc. | 0 | -100,00 | 0 | |||||
| 2025-08-14 | 13F | Qube Research & Technologies Ltd | 124 | 0,00 | 8 | 0,00 | ||||
| 2025-08-15 | 13F | Equitable Holdings, Inc. | 14.333 | -19,59 | 917 | -13,16 | ||||
| 2025-08-04 | 13F | Integrity Alliance, Llc. | 146.613 | -73,95 | 9.385 | -71,87 | ||||
| 2025-07-08 | 13F | Melone Private Wealth, LLC | 9.001 | 0,01 | 574 | 7,50 | ||||
| 2025-08-12 | 13F | BlackRock, Inc. | 957 | 0,00 | 61 | 8,93 | ||||
| 2025-08-11 | 13F | Citigroup Inc | 22.806 | 76,39 | 1.460 | 90,47 | ||||
| 2025-07-11 | 13F/A | Umb Bank N A/mo | 3.517 | 0,00 | 225 | 8,17 | ||||
| 2025-07-28 | 13F | WealthPlan Investment Management, LLC | 28.537 | 1.827 | ||||||
| 2025-07-29 | 13F | Huntleigh Advisors, Inc. | 6.498 | -16,66 | 416 | -10,17 | ||||
| 2025-08-18 | 13F/A | Westwood Holdings Group Inc | 5.113 | 0,00 | 327 | 7,92 | ||||
| 2025-05-15 | 13F | Tower Research Capital LLC (TRC) | 0 | -100,00 | 0 | |||||
| 2025-07-15 | 13F | Optima Capital Llc | 5.182 | 0,33 | 332 | 8,17 | ||||
| 2025-08-01 | 13F | Advisory Alpha, LLC | 24.264 | -0,54 | 1.553 | 7,40 | ||||
| 2025-07-25 | 13F | NorthRock Partners, LLC | 2.531 | -2,05 | 162 | 5,88 | ||||
| 2025-08-14 | 13F | Win Advisors, Inc | 140.061 | 8.965 | ||||||
| 2025-08-13 | 13F | Kilter Group LLC | 7.227 | 3,48 | 463 | 11,59 | ||||
| 2025-08-14 | 13F | Citadel Advisors Llc | 29.955 | -49,46 | 1.917 | -45,43 | ||||
| 2025-07-31 | 13F | Cambridge Investment Research Advisors, Inc. | 3.777 | 6,07 | 0 | |||||
| 2025-08-12 | 13F | Global Retirement Partners, LLC | 21.110 | 19,47 | 1.351 | 24,98 | ||||
| 2025-07-10 | 13F | Kmg Fiduciary Partners, Llc | 27.144 | 5,23 | 1.737 | 13,60 | ||||
| 2025-08-13 | 13F | Capital Group Private Client Services, Inc. | 6.385 | -0,03 | 409 | 7,94 | ||||
| 2025-07-07 | 13F | Nova Wealth Management, Inc. | 3.605 | -26,77 | 231 | -20,96 | ||||
| 2025-07-29 | 13F | Private Trust Co Na | 0 | -100,00 | 0 | |||||
| 2025-08-14 | 13F | GWM Advisors LLC | 6.690 | 428 | ||||||
| 2025-08-11 | 13F | Advisor Resource Council | 7.317 | 468 | ||||||
| 2025-08-14 | 13F | Susquehanna International Group, Llp | 42.212 | 27,21 | 2.702 | 37,32 | ||||
| 2025-08-11 | 13F | Private Advisor Group, LLC | 1.058.176 | -1,56 | 67.734 | 6,29 | ||||
| 2025-04-16 | 13F | Defined Financial Planning LLC | 0 | -100,00 | 0 | |||||
| 2025-08-08 | 13F | Creative Planning | 93.914 | 0,00 | 6.011 | 7,98 | ||||
| 2025-04-14 | 13F | Baldwin Brothers Inc/ma | 0 | -100,00 | 0 | |||||
| 2025-08-07 | 13F | Flagship Wealth Advisors, Llc | 87.260 | 9,59 | 5.586 | 18,33 | ||||
| 2025-08-29 | 13F | Centaurus Financial, Inc. | 11.563 | 1 | ||||||
| 2025-07-18 | 13F | Parsons Capital Management Inc/ri | 9.437 | -4,98 | 604 | 2,72 | ||||
| 2025-07-22 | 13F | Marietta Wealth Management, LLC | 98.447 | 2,21 | 6.302 | 10,37 | ||||
| 2025-08-12 | 13F | Coldstream Capital Management Inc | 0 | -100,00 | 0 | |||||
| 2025-08-26 | NP | EVMLX - The E-Valuator Moderate (50%-70%) RMS Fund Service Class Shares | 23.947 | 1.533 | ||||||
| 2025-08-14 | 13F | Mml Investors Services, Llc | 4.057 | -92,23 | 0 | -100,00 | ||||
| 2025-07-30 | 13F | Paul Damon & Associates, Inc. | 10.000 | 0,00 | 640 | 8,11 | ||||
| 2025-08-07 | 13F | Parkside Financial Bank & Trust | 8.816 | 0,00 | 564 | 8,05 | ||||
| 2025-08-15 | 13F | Kestra Advisory Services, LLC | 240.188 | 8,62 | 15.374 | 17,29 | ||||
| 2025-08-07 | 13F | Efficient Advisors, LLC | 0 | -100,00 | 0 | |||||
| 2025-08-13 | 13F | M&t Bank Corp | 5.925 | 0,00 | 379 | 7,98 | ||||
| 2025-08-15 | 13F | CI Private Wealth, LLC | 7.394 | 100,00 | 473 | 115,98 | ||||
| 2025-08-11 | 13F | Principal Securities, Inc. | 286 | 0,00 | 18 | 5,88 | ||||
| 2025-08-18 | 13F | Geneos Wealth Management Inc. | 640 | 60,00 | 41 | 73,91 | ||||
| 2025-07-15 | 13F | Main Street Group, LTD | 50 | 0,00 | 3 | 50,00 | ||||
| 2025-04-28 | 13F | Actinver Wealth Management, Inc. | 0 | -100,00 | 0 | |||||
| 2025-05-08 | 13F | Armis Advisers, LLC | 0 | -100,00 | 0 | |||||
| 2025-08-07 | 13F | Allworth Financial LP | 1.882 | 0,05 | 120 | 11,11 | ||||
| 2025-08-14 | 13F | Royal Bank Of Canada | 26.160 | -0,67 | 1.675 | 7,30 | ||||
| 2025-08-04 | 13F | IFG Advisory, LLC | 5.811 | 0,00 | 372 | 7,85 | ||||
| 2025-08-05 | 13F | Advisors Preferred, LLC | 0 | -100,00 | 0 | |||||
| 2025-08-08 | 13F | Avantax Advisory Services, Inc. | 103.286 | -0,33 | 6.611 | 7,64 | ||||
| 2025-08-14 | 13F | Bank Of America Corp /de/ | 213.770 | -22,22 | 13.683 | -16,01 | ||||
| 2025-08-14 | 13F | Ancora Advisors, LLC | 835 | 0,00 | 53 | 8,16 | ||||
| 2025-08-26 | NP | EVTTX - The E-Valuator Conservative/Moderate (30%-50%) RMS Fund Service Class Shares | 3.824 | 245 | ||||||
| 2025-07-31 | 13F | Moloney Securities Asset Management, LLC | 74.018 | 7,42 | 4.738 | 15,99 | ||||
| 2025-08-12 | 13F | Proequities, Inc. | 0 | 0 | ||||||
| 2025-07-10 | 13F | Moller Financial Services | 3.730 | 0,00 | 239 | 7,69 | ||||
| 2025-08-04 | 13F | Creative Financial Designs Inc /adv | 994 | -15,40 | 64 | -8,70 | ||||
| 2025-07-14 | 13F | Park Avenue Securities Llc | 3.722 | 0 | ||||||
| 2025-07-25 | 13F | Concurrent Investment Advisors, LLC | 37.643 | -15,93 | 2.410 | -9,23 | ||||
| 2025-08-14 | 13F | Fmr Llc | 15.744 | -8,67 | 1.008 | -1,37 | ||||
| 2025-08-14 | 13F | Ameriprise Financial Inc | 10.508 | -0,57 | 673 | 7,35 | ||||
| 2025-08-14 | 13F | Kovitz Investment Group Partners, LLC | 139.475 | 0,02 | 8.925 | 7,96 | ||||
| 2025-08-04 | 13F | Arkadios Wealth Advisors | 13.678 | 2,01 | 876 | 10,20 | ||||
| 2025-07-09 | 13F | Beacon Financial Group | 45.957 | -0,08 | 2.942 | 7,89 | ||||
| 2025-08-08 | 13F | Bouchey Financial Group Ltd | 7.815 | 0,00 | 500 | 7,99 | ||||
| 2025-04-23 | 13F | Western Wealth Management, LLC | 0 | -100,00 | 0 | -100,00 | ||||
| 2025-08-01 | 13F | Envestnet Asset Management Inc | 12.446 | -79,99 | 797 | -78,41 | ||||
| 2025-08-12 | 13F | Jpmorgan Chase & Co | 138.096 | 4,61 | 8.840 | 12,96 | ||||
| 2025-08-26 | NP | EVVLX - The E-Valuator Very Conservative (0%-15%) RMS Fund Service Class Shares | 526 | 34 | ||||||
| 2025-07-30 | 13F | Insight Advisors, LLC/ PA | 0 | -100,00 | 0 | |||||
| 2025-08-12 | 13F | Founders Financial Alliance, LLC | 3.543 | 19,74 | 227 | 29,14 | ||||
| 2025-08-14 | 13F | Mariner, LLC | 0 | -100,00 | 0 | |||||
| 2025-08-14 | 13F | Herold Advisors, Inc. | 17.360 | 0,00 | 1.111 | 7,97 | ||||
| 2025-07-14 | 13F | E&G Advisors, LP | 7.225 | 0,84 | 462 | 8,96 | ||||
| 2025-07-22 | 13F | Beacon Financial Advisory LLC | 20.361 | -14,26 | 1.303 | -7,39 | ||||
| 2025-08-13 | 13F | Jones Financial Companies Lllp | 20.146 | 42,70 | 1.285 | 54,51 | ||||
| 2025-07-18 | 13F | Institute for Wealth Management, LLC. | 9.910 | 0,00 | 634 | 8,01 | ||||
| 2025-08-14 | 13F | Redwood Financial Network Corp | 7.191 | 0,00 | 460 | 7,98 | ||||
| 2025-08-14 | 13F | Stifel Financial Corp | 12.086 | -0,87 | 774 | 7,06 | ||||
| 2025-08-14 | 13F | Betterment LLC | 52.775 | 3,19 | 3 | 0,00 | ||||
| 2025-07-16 | 13F | ORG Partners LLC | 10.703 | -3,25 | 686 | 4,57 | ||||
| 2025-07-28 | 13F | Capital Management Corp /va | 3.225 | -5,84 | 206 | 1,48 | ||||
| 2025-08-14 | 13F | CoreCap Advisors, LLC | 4.648 | -2,02 | 298 | 5,69 | ||||
| 2025-08-06 | 13F | Modera Wealth Management, LLC | 35.094 | -0,28 | 2.246 | 7,67 | ||||
| 2025-08-06 | 13F | Commonwealth Equity Services, Llc | 6.754 | 0,16 | 0 | |||||
| 2025-07-15 | 13F | SJS Investment Consulting Inc. | 1.726 | 0,00 | 110 | 7,84 | ||||
| 2025-08-13 | 13F | First Trust Advisors Lp | 3.718 | 238 | ||||||
| 2025-07-08 | 13F | RMR Wealth Builders | 3.194 | 204 | ||||||
| 2025-08-12 | 13F | Cornerstone Wealth Management, LLC | 8.506 | 0,14 | 544 | 8,15 | ||||
| 2025-08-12 | 13F | LPL Financial LLC | 1.278.743 | 13,04 | 81.852 | 22,06 | ||||
| 2025-07-28 | 13F | Mutual Advisors, LLC | 4.050 | 267 | ||||||
| 2025-08-05 | 13F | C2P Capital Advisory Group, LLC d.b.a. Prosperity Capital Advisors | 28.020 | -2,16 | 1.794 | 5,47 | ||||
| 2025-05-13 | 13F | EPG Wealth Management LLC | 0 | -100,00 | 0 | -100,00 | ||||
| 2025-09-04 | 13F/A | Advisor Group Holdings, Inc. | 25.019 | 256,60 | 1.601 | 285,78 | ||||
| 2025-08-14 | 13F | Integrated Wealth Concepts LLC | 3.420 | -83,57 | 219 | -82,33 | ||||
| 2025-08-14 | 13F | Raymond James Financial Inc | 34.195 | 16,11 | 2.189 | 25,39 | ||||
| 2025-08-12 | 13F | PSI Advisors, LLC | 0 | -100,00 | 0 | |||||
| 2025-08-13 | 13F | Cerity Partners LLC | 4.645 | 0,00 | 297 | 8,00 | ||||
| 2025-08-14 | 13F | Wells Fargo & Company/mn | 81.040 | -0,75 | 5.187 | 7,17 | ||||
| 2025-07-29 | 13F | Systelligence, LLC | 111.186 | 7.117 | ||||||
| 2025-08-14 | 13F | Two Sigma Investments, Lp | 54.400 | 3.482 | ||||||
| 2025-07-29 | 13F | AssuredPartners Investment Advisors, LLC | 43.358 | -2,01 | 2.775 | 5,84 | ||||
| 2025-08-14 | 13F | Fiduciary Trust Co | 2.252.225 | -6,74 | 144.165 | 0,70 | ||||
| 2025-07-10 | 13F | Rockland Trust Co | 37.404 | -2,55 | 2.394 | 5,23 | ||||
| 2025-08-13 | 13F | Northwestern Mutual Wealth Management Co | 109.748 | 16,42 | 7.025 | 25,70 | ||||
| 2025-07-22 | 13F | IFS Advisors, LLC | 4.873 | -3,75 | 312 | 3,67 | ||||
| 2025-08-14 | 13F | Jane Street Group, Llc | 0 | -100,00 | 0 | |||||
| 2025-08-14 | 13F | Comerica Bank | 1.011 | 0,00 | 65 | 8,47 | ||||
| 2025-07-22 | 13F | Team Financial Group, LLC | 451.840 | 5,96 | 28.922 | 14,41 | ||||
| 2025-07-17 | 13F | Coastline Trust Co | 1.380 | 0,00 | 88 | 8,64 | ||||
| 2025-07-23 | 13F | Prime Capital Investment Advisors, LLC | 56.000 | -4,71 | 3.585 | 2,90 | ||||
| 2025-08-06 | 13F | AE Wealth Management LLC | 428 | 2.957,14 | 27 | |||||
| 2025-07-10 | 13F | Focus Financial Network, Inc. | 4.788 | 306 | ||||||
| 2025-08-14 | 13F | Harwood Advisory Group, LLC | 35 | 0,00 | 2 | 0,00 | ||||
| 2025-08-14 | 13F | Essential Planning, LLC. | 10.914 | 0,01 | 699 | 8,05 | ||||
| 2025-07-28 | 13F | Harbour Investments, Inc. | 47.945 | 13,58 | 3.069 | 22,62 | ||||
| 2025-08-08 | 13F | Pnc Financial Services Group, Inc. | 3.872 | 0,00 | 248 | 7,86 | ||||
| 2025-08-26 | NP | EVGLX - The E-Valuator Growth (70%-85%) RMS Fund Service Class Shares | 52.505 | 3.361 | ||||||
| 2025-08-13 | 13F | Jackson Creek Investment Advisors LLC | 8.954 | 0,27 | 1 | |||||
| 2025-07-18 | 13F | Bartlett & Co. Wealth Management Llc | 939 | 0,00 | 60 | 9,09 | ||||
| 2025-08-07 | 13F | Verus Capital Partners, Llc | 8.167 | 5,18 | 523 | 13,48 | ||||
| 2025-08-14 | 13F | Goldman Sachs Group Inc | 78.849 | 191,95 | 5.047 | 215,24 | ||||
| 2025-07-15 | 13F | Garrett Investment Advisors LLC | 4.342 | 0,00 | 278 | 7,78 | ||||
| 2025-05-08 | NP | QALTX - Quantified Alternative Investment Fund Investor Class Shares | 211 | -96,30 | 13 | -96,55 | ||||
| 2025-07-24 | 13F | Ronald Blue Trust, Inc. | 81 | 0,00 | 5 | 25,00 | ||||
| 2025-08-26 | NP | EVCLX - The E-Valuator Conservative (15%-30%) RMS Fund Service Class Shares | 3.920 | 251 | ||||||
| 2025-07-22 | 13F | Simplicity Wealth,LLC | 0 | -100,00 | 0 | |||||
| 2025-08-13 | 13F | Stenger Family Office, LLC | 0 | -100,00 | 0 | |||||
| 2025-08-19 | 13F | Advisory Services Network, LLC | 3.935 | 0,00 | 258 | 10,30 | ||||
| 2025-07-28 | 13F | Axxcess Wealth Management, Llc | 3.561 | 1,40 | 228 | 9,13 |