Grundlæggende statistik
| Institutionelle ejere | 152 total, 152 long only, 0 short only, 0 long/short - change of 9,35% MRQ |
| Gennemsnitlig porteføljeallokering | 0.0570 % - change of -41,66% MRQ |
| Institutionelle aktier (lange) | 1.587.153 (ex 13D/G) - change of 0,13MM shares 8,72% MRQ |
| Institutionel værdi (lang) | $ 170.375 USD ($1000) |
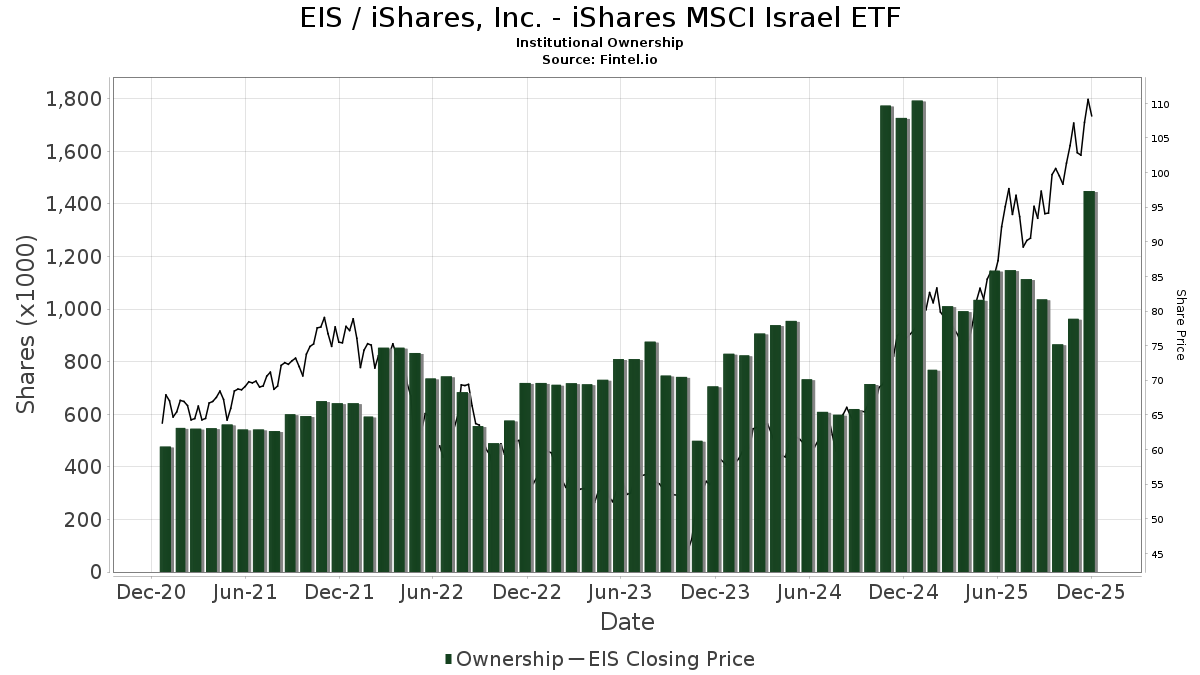
Institutionelt ejerskab og aktionærer
iShares, Inc. - iShares MSCI Israel ETF (US:EIS) har 152 institutionelle ejere og aktionærer, der har indsendt 13D/G- eller 13F-formularer til Securities Exchange Commission (SEC). Disse institutioner har i alt 1,587,153 aktier. Største aktionærer omfatter Korea Investment CORP, Morgan Stanley, UBS Group AG, LPL Financial LLC, Wells Fargo & Company/mn, CoreCap Advisors, LLC, Monument Capital Management, Swiss Life Asset Management Ltd, Nepc Llc, and Mml Investors Services, Llc .
iShares, Inc. - iShares MSCI Israel ETF (ARCA:EIS) institutionel ejerskabsstruktur viser aktuelle positioner i virksomheden efter institutioner og fonde, samt seneste ændringer i positionsstørrelse. Større aktionærer kan omfatte individuelle investorer, investeringsforeninger, hedgefonde eller institutioner. Skema 13D angiver, at investoren besidder (eller besidder) mere end 5 % af virksomheden og har til hensigt (eller har til hensigt at) aktivt at forfølge en ændring i forretningsstrategi. Skema 13G indikerer en passiv investering på over 5%.
The share price as of April 13, 2026 is 125,28 / share. Previously, on April 14, 2025, the share price was 75,19 / share. This represents an increase of 66,62% over that period.
Fondens stemningsscore
Fund Sentiment Score (fka Ownership Accumulation Score) finder de aktier, der bliver mest købt af fonde. Det er resultatet af en sofistikeret, multi-faktor kvantitativ model, der identificerer virksomheder med de højeste niveauer af institutionel akkumulering. Scoringsmodellen bruger en kombination af den samlede stigning i oplyste ejere, ændringerne i porteføljeallokeringer i disse ejere og andre målinger. Tallet går fra 0 til 100, hvor højere tal indikerer et højere niveau af akkumulering for sine jævnaldrende, og 50 er gennemsnittet.
Opdateringsfrekvens: Dagligt
Se Ownership Explorer, som giver en liste over højest rangerende virksomheder.
AI+ Ask Fintel’s AI assistant about iShares, Inc. - iShares MSCI Israel ETF.
Select a question to share a public post with an AI-crafted answer.
Thinking of good questions…
Institutionel Put/Call-forhold
Ud over at indberette standardaktie- og gældsudstedelser skal institutter med mere end 100 mill. aktiver under forvaltning også oplyse deres put- og call-optionsbeholdninger. Da salgsoptioner generelt indikerer negativ stemning, og købsoptioner indikerer positiv stemning, kan vi få en fornemmelse af den overordnede institutionelle stemning ved at plotte forholdet mellem put og kald. Diagrammet til højre viser det historiske put/call-forhold for dette instrument.
Brug af Put/Call Ratio som en indikator for investorernes stemning overvinder en af de vigtigste mangler ved at bruge totalt institutionelt ejerskab, som er, at en betydelig mængde af aktiver under forvaltning investeres passivt for at spore indekser. Passivt forvaltede fonde køber typisk ikke optioner, så indikatoren for put/call-forholdet følger mere nøje følelsen af aktivt forvaltede fonde.
13F og NPORT arkivering
Detaljer om 13F-arkivering er gratis. Detaljer om NP-ansøgninger kræver et premium-medlemskab. Grønne rækker angiver nye positioner. Røde rækker angiver lukkede positioner. Klik på linket ikon for at se den fulde transaktionshistorik.
Opgrader
for at låse premium-data op og eksportere til Excel ![]() .
.
| Fil dato | Kilde | Investor | Type | Gennemsnitlig pris (Øst) |
Aktier | Δ Aktier (%) |
Rapporteret Værdi ($1000) |
Δ Værdi (%) |
Port Alloc (%) |
|
|---|---|---|---|---|---|---|---|---|---|---|
| 2026-02-12 | 13F | CIBC Private Wealth Group, LLC | 1.840 | 0,00 | 202 | 9,78 | ||||
| 2026-01-26 | 13F | Cwm, Llc | 708 | 235,55 | 0 | |||||
| 2025-10-30 | 13F | Twin Peaks Wealth Advisors, LLC | 0 | -100,00 | 0 | |||||
| 2026-01-30 | 13F | Wealth High Governance Capital Ltda | 0 | -100,00 | 0 | -100,00 | ||||
| 2026-02-10 | 13F/A | Northwestern Mutual Wealth Management Co | 410 | 0,00 | 45 | 9,76 | ||||
| 2026-02-10 | 13F | Texas Yale Capital Corp. | 4.470 | 0,00 | 492 | 9,60 | ||||
| 2026-01-28 | 13F | Nadler Financial Group, Inc. | 4.400 | 0,00 | 484 | 9,75 | ||||
| 2026-02-17 | 13F | Summit Trail Advisors, Llc | 2.700 | 0,00 | 297 | 10,00 | ||||
| 2026-01-12 | 13F | DAVENPORT & Co LLC | 11.390 | -1,81 | 1.253 | 7,74 | ||||
| 2026-02-17 | 13F | Raymond James Financial Inc | 18.447 | 69,44 | 2.030 | 85,98 | ||||
| 2025-11-14 | 13F | Two Sigma Securities, Llc | 0 | -100,00 | 0 | |||||
| 2026-01-21 | 13F | Y.D. More Investments Ltd | 612 | -26,44 | 61 | -22,08 | ||||
| 2026-02-11 | 13F | Marvin & Palmer Associates Inc | 0 | -100,00 | 0 | |||||
| 2026-01-16 | 13F | West Branch Capital LLC | 500 | 0,00 | 55 | 10,00 | ||||
| 2026-01-22 | 13F | Financial Consulate, Inc | 108 | 0,00 | 12 | 10,00 | ||||
| 2026-01-20 | 13F | Princeton Global Asset Management LLC | 303 | 0,66 | 33 | 10,00 | ||||
| 2026-01-28 | 13F | Geneos Wealth Management Inc. | 18.861 | 2.075 | ||||||
| 2026-02-12 | 13F | Sepio Capital, LP | 20.888 | 0,78 | 2.298 | 10,59 | ||||
| 2025-10-24 | 13F | Evergreen Private Wealth LLC | 0 | -100,00 | 0 | |||||
| 2026-02-06 | 13F | HighTower Advisors, LLC | 28.662 | 98,37 | 3.154 | 117,60 | ||||
| 2026-01-26 | 13F | AE Wealth Management LLC | 264 | 9,09 | 29 | 20,83 | ||||
| 2026-02-12 | 13F | Brinker Capital Investments, LLC | 1.859 | 205 | ||||||
| 2026-04-07 | 13F | CoreCap Advisors, LLC | 41.287 | -13,38 | 4.791 | -8,66 | ||||
| 2026-02-12 | 13F | BlackRock, Inc. | 0 | -100,00 | 0 | -100,00 | ||||
| 2026-02-17 | 13F | VestGen Advisors, LLC | 23.684 | 2.606 | ||||||
| 2025-11-07 | 13F | Beacon Capital Management, LLC | 0 | -100,00 | 0 | |||||
| 2026-02-11 | 13F | LPL Financial LLC | 58.132 | 115,86 | 6.396 | 136,80 | ||||
| 2026-02-02 | 13F | Truist Financial Corp | 4.051 | 13,28 | 446 | 24,30 | ||||
| 2026-02-17 | 13F | Susquehanna International Group, Llp | 0 | -100,00 | 0 | -100,00 | ||||
| 2026-04-06 | 13F | Highline Wealth Partners Llc | 0 | -100,00 | 0 | |||||
| 2026-01-16 | 13F | Ronald Blue Trust, Inc. | 4.548 | -0,24 | 500 | 9,41 | ||||
| 2026-01-30 | 13F | Kiker Wealth Management, LLC | 0 | -100,00 | 0 | |||||
| 2026-03-04 | 13F | SHP Wealth Management | 116 | 13 | ||||||
| 2026-04-06 | 13F | CX Institutional | 527 | 0,00 | 0 | |||||
| 2026-02-13 | 13F | SRS Capital Advisors, Inc. | 20 | 2 | ||||||
| 2026-02-13 | 13F | Mill Creek Capital Advisors, LLC | 11.051 | 15,20 | 1.216 | 26,30 | ||||
| 2026-02-10 | 13F | Envestnet Asset Management Inc | 14.869 | 241,42 | 1.636 | 275,23 | ||||
| 2026-02-14 | 13F | Rockefeller Capital Management L.P. | 991 | 98,20 | 109 | 118,00 | ||||
| 2026-01-12 | 13F | Contravisory Investment Management, Inc. | 11.777 | 1.296 | ||||||
| 2026-02-17 | 13F | Aqr Capital Management Llc | 2.320 | 0,00 | 255 | 9,91 | ||||
| 2026-02-13 | 13F | National Bank Of Canada /fi/ | 894 | -0,45 | 98 | 10,11 | ||||
| 2026-01-22 | 13F | Spirepoint Private Client, Llc | 1.850 | 204 | ||||||
| 2026-02-05 | 13F | Allworth Financial LP | 1.569 | 64,64 | 173 | 81,05 | ||||
| 2026-02-09 | 13F | Smithfield Trust Co | 13.229 | 0,00 | 1 | 0,00 | ||||
| 2026-01-28 | 13F | Legacy Capital Group California, Inc. | 11.670 | 1.284 | ||||||
| 2026-01-29 | 13F | Sanctuary Advisors, LLC | 2.632 | 290 | ||||||
| 2026-02-11 | 13F | Jpmorgan Chase & Co | 186 | -27,06 | 20 | -20,00 | ||||
| 2026-02-17 | 13F | Royal Bank Of Canada | 27.724 | 44,60 | 3.051 | 58,66 | ||||
| 2026-01-28 | 13F | WMG Financial Advisors, LLC | 11.615 | 1.278 | ||||||
| 2026-01-26 | 13F | Mirae Asset Global Investments Co., Ltd. | 1.790 | -5,69 | 197 | 3,16 | ||||
| 2026-02-13 | 13F | Colony Group, LLC | 4.100 | 451 | ||||||
| 2026-01-15 | 13F | Nilsine Partners, LLC | 27.985 | 1,99 | 3.079 | 11,88 | ||||
| 2026-02-12 | 13F | Triumph Capital Management | 335 | -8,47 | 37 | 0,00 | ||||
| 2026-02-13 | 13F | Graney & King, LLC | 980 | 108 | ||||||
| 2026-02-17 | 13F | GAM Holding AG | 3.350 | 368 | ||||||
| 2026-01-21 | 13F | Sound Income Strategies, LLC | 30 | 4 | ||||||
| 2026-01-27 | 13F | Sage Financial Group Inc | 1.841 | 203 | ||||||
| 2026-02-06 | 13F | Csenge Advisory Group | 13.485 | 31,54 | 1.484 | 44,26 | ||||
| 2026-02-13 | 13F | Korea Investment CORP | 410.232 | 0,00 | 45.138 | 9,70 | ||||
| 2026-02-17 | 13F | Advisor Group Holdings, Inc. | 21.866 | 83,36 | 2.407 | 104,85 | ||||
| 2026-04-08 | 13F | Castle Rock Wealth Management, LLC | 5.689 | 670 | ||||||
| 2026-02-13 | 13F | Rhumbline Advisers | 170 | -57,50 | 19 | -55,00 | ||||
| 2026-02-18 | 13F | KKM Financial LLC | 3.999 | 15,41 | 440 | 26,80 | ||||
| 2026-04-07 | 13F | Farther Finance Advisors, LLC | 572 | 0,00 | 68 | 8,06 | ||||
| 2026-02-04 | 13F | Atlantic Union Bankshares Corp | 2 | 0,00 | 0 | |||||
| 2026-01-29 | 13F | UBS Group AG | 69.281 | 59,90 | 7.623 | 75,42 | ||||
| 2026-02-17 | 13F | Cetera Investment Advisers | 25.562 | 136,82 | 2.813 | 159,89 | ||||
| 2026-02-12 | 13F | Cloud Capital Management, LLC | 0 | -100,00 | 0 | |||||
| 2026-02-17 | 13F | National Asset Management, Inc. | 12.245 | 1.347 | ||||||
| 2026-01-23 | 13F | Colorado Capital Management, Inc. | 3.342 | 0,00 | 0 | |||||
| 2026-02-04 | 13F | BCJ Capital Management, LLC | 2.058 | 226 | ||||||
| 2026-02-12 | 13F | Scotia Capital Inc. | 4.263 | 0,00 | 469 | 9,84 | ||||
| 2026-02-17 | 13F | Advisory Services Network, LLC | 6.496 | 232,28 | 715 | 264,29 | ||||
| 2026-01-30 | 13F | Wealthfront Advisers Llc | 6.959 | 16,08 | 766 | 27,29 | ||||
| 2026-02-17 | 13F | D. E. Shaw & Co., Inc. | 10.790 | -8,60 | 1.187 | 0,25 | ||||
| 2026-02-11 | 13F | O'shaughnessy Asset Management, Llc | 238 | 26 | ||||||
| 2026-03-16 | 13F | Osbon Capital Management Llc | 3.279 | 361 | ||||||
| 2026-02-11 | 13F | Franklin Resources Inc | 130 | 0,00 | 14 | 7,69 | ||||
| 2026-02-13 | 13F | Integrated Wealth Concepts LLC | 0 | -100,00 | 0 | |||||
| 2026-02-12 | 13F | Commonwealth Equity Services, Llc | 23.244 | 156,67 | 2.558 | |||||
| 2026-02-17 | 13F | Creative Planning | 3.008 | 1,08 | 331 | 10,74 | ||||
| 2026-02-17 | 13F | Perennial Investment Advisors, LLC | 2.753 | 0,99 | 303 | 10,62 | ||||
| 2026-02-03 | 13F | International Assets Investment Management, Llc | 2.627 | -6,94 | 289 | 9,89 | ||||
| 2026-02-04 | 13F | Swiss Life Asset Management Ltd | 31.333 | 0,00 | 3.448 | 9,71 | ||||
| 2026-01-30 | 13F | Kohmann Bosshard Financial Services, LLC | 551 | 61 | ||||||
| 2025-11-13 | 13F | Glenmede Investment Management, LP | 1.931 | 0,00 | 194 | 5,46 | ||||
| 2026-02-13 | 13F | Wells Fargo & Company/mn | 45.431 | 34,57 | 4.999 | 47,61 | ||||
| 2026-02-09 | 13F | Arrow Investment Advisors, LLC | 4.205 | -18,99 | 463 | -11,15 | ||||
| 2026-02-11 | 13F | IMA Wealth, Inc. | 143 | -17,34 | 16 | -11,76 | ||||
| 2026-02-20 | 13F | Sunbelt Securities, Inc. | 3.081 | 339 | ||||||
| 2026-02-17 | 13F | Elequin Capital Lp | 0 | -100,00 | 0 | |||||
| 2026-04-06 | 13F | Miller Global Investments, LLC | 2.401 | -5,10 | 279 | 0,00 | ||||
| 2026-02-17 | 13F | EFG International AG | 2.300 | 253 | ||||||
| 2026-02-13 | 13F | Marshall Wace, Llp | 0 | -100,00 | 0 | |||||
| 2026-01-14 | 13F | Nova Wealth Management, Inc. | 384 | 0,00 | 42 | 10,53 | ||||
| 2026-02-13 | 13F | Morgan Stanley | 138.044 | 24,04 | 15.189 | 36,08 | ||||
| 2026-02-13 | 13F | Atlas Capital Advisors Llc | 7 | -99,30 | 1 | -100,00 | ||||
| 2026-01-12 | 13F | Evolution Wealth Advisors, LLC | 4.165 | 458 | ||||||
| 2026-01-29 | 13F | 4Thought Financial Group Inc. | 39 | 0,00 | 4 | 33,33 | ||||
| 2026-01-27 | 13F | TD Waterhouse Canada Inc. | 1.880 | 0,00 | 206 | 10,16 | ||||
| 2026-02-17 | 13F | Nepc Llc | 31.069 | 0,00 | 3.419 | 9,69 | ||||
| 2026-02-12 | 13F | Wealthspire Advisors, LLC | 0 | -100,00 | 0 | |||||
| 2026-02-06 | 13F | Covestor Ltd | 7 | 40,00 | 0 | |||||
| 2026-02-11 | 13F | Ameritas Investment Partners, Inc. | 40 | 4 | ||||||
| 2026-01-15 | 13F | Fortitude Family Office, LLC | 2.308 | 0,00 | 254 | 9,52 | ||||
| 2026-04-13 | 13F | IFP Advisors, Inc | 867 | 115,14 | 101 | 127,27 | ||||
| 2026-02-06 | 13F | Copia Wealth Management | 691 | 76 | ||||||
| 2026-02-17 | 13F | NewSquare Capital LLC | 9.870 | -39,17 | 1.086 | -33,31 | ||||
| 2026-02-17 | 13F | Glenmede Trust Co Na | 1.931 | 0,00 | 212 | 48,25 | ||||
| 2026-02-17 | 13F | Bank Of America Corp /de/ | 24.789 | 22,28 | 2.728 | 34,14 | ||||
| 2025-11-14 | 13F | Arizona PSPRS Trust | 0 | -100,00 | 0 | |||||
| 2026-01-29 | 13F | Comerica Bank | 26 | 0,00 | 3 | 0,00 | ||||
| 2026-02-06 | 13F | VSM Wealth Advisory, LLC | 200 | 0,00 | 22 | 10,00 | ||||
| 2025-11-14 | 13F/A | NorthRock Partners, LLC | 0 | -100,00 | 0 | |||||
| 2026-01-26 | 13F | Monument Capital Management | 36.462 | 5,04 | 4.012 | 15,23 | ||||
| 2026-02-17 | 13F | Captrust Financial Advisors | 2.893 | 0,00 | 318 | 9,66 | ||||
| 2026-01-23 | 13F | Optima Capital Llc | 130 | 14 | ||||||
| 2026-01-27 | 13F | BigSur Wealth Management LLC | 3.000 | 0,00 | 330 | 10,00 | ||||
| 2026-02-17 | 13F | Zacks Investment Management | 6.543 | -65,30 | 720 | -61,98 | ||||
| 2026-02-17 | 13F | Fmr Llc | 1.087 | 5,33 | 120 | 15,53 | ||||
| 2026-02-02 | 13F | Mutual Advisors, LLC | 7.325 | 806 | ||||||
| 2026-02-13 | 13F | Mml Investors Services, Llc | 31.013 | 23,16 | 3.412 | 35,13 | ||||
| 2026-02-10 | 13F | BW Gestao de Investimentos Ltda. | 0 | -100,00 | 0 | |||||
| 2025-11-10 | 13F | Kovitz Investment Group Partners, LLC | 0 | -100,00 | 0 | |||||
| 2026-02-06 | 13F | EverSource Wealth Advisors, LLC | 100 | 0,00 | 11 | 10,00 | ||||
| 2026-01-30 | 13F | Us Bancorp \de\ | 1.151 | 0,00 | 127 | 9,57 | ||||
| 2026-01-30 | 13F | Camden Capital, LLC | 3.719 | -17,61 | 409 | -9,51 | ||||
| 2026-02-05 | 13F | Cambridge Investment Research Advisors, Inc. | 2.192 | 6,30 | 0 | |||||
| 2026-01-20 | 13F | Analyst IMS Investment Management Services Ltd. | 3.605 | 0 | ||||||
| 2026-02-17 | 13F | Equitable Holdings, Inc. | 13.341 | -8,90 | 1.468 | -0,07 | ||||
| 2026-02-13 | 13F | Mariner, LLC | 2.337 | 257 | ||||||
| 2026-02-13 | 13F | Battery Global Advisors, LLC | 0 | -100,00 | 0 | |||||
| 2026-02-17 | 13F | Blair William & Co/il | 5.795 | 638 | ||||||
| 2026-02-13 | 13F | MAI Capital Management | 195 | 21 | ||||||
| 2026-02-12 | 13F | Steward Partners Investment Advisory, Llc | 11 | 0,00 | 1 | 0,00 | ||||
| 2026-02-06 | 13F | Griffin Asset Management, Inc. | 2.526 | 278 | ||||||
| 2026-02-10 | 13F | BlackDiamond Wealth Management Inc. | 2.450 | 0,00 | 297 | 21,22 | ||||
| 2026-01-16 | 13F | Beaumont Financial Advisors, LLC | 5.550 | 0,00 | 611 | 9,71 | ||||
| 2026-02-05 | 13F | Thrivent Financial For Lutherans | 2.564 | -2,17 | 0 | |||||
| 2026-02-09 | 13F | Blue Bell Private Wealth Management, Llc | 25 | 0,00 | 3 | 0,00 | ||||
| 2026-02-18 | 13F | Beacon Pointe Advisors, LLC | 6.468 | 97,26 | 712 | 116,77 | ||||
| 2026-02-10 | 13F | Bank of New York Mellon Corp | 2.003 | -95,32 | 220 | -89,29 | ||||
| 2026-02-17 | 13F | Hilltop Holdings Inc. | 0 | -100,00 | 0 | |||||
| 2026-01-29 | 13F | Concord Wealth Partners | 65 | 7 | ||||||
| 2026-02-17 | 13F | BlueCrest Capital Management Ltd | 12.000 | 0,00 | 1.320 | 9,73 | ||||
| 2026-01-23 | 13F | Valley National Advisers Inc | 96 | 0,00 | 0 | |||||
| 2026-02-04 | 13F | Ameritas Advisory Services, LLC | 0 | -100,00 | 0 | |||||
| 2026-02-17 | 13F | Intrepid Family Office Llc | 10.000 | 0,00 | 1.100 | 9,67 | ||||
| 2026-02-13 | 13F | Kestra Advisory Services, LLC | 0 | -100,00 | 0 | |||||
| 2026-02-13 | 13F | Barclays Plc | 0 | -100,00 | 0 | |||||
| 2026-02-12 | 13F | Adviser Investments LLC | 3.942 | 0,00 | 434 | 9,62 | ||||
| 2026-04-08 | 13F | Wealth Enhancement Advisory Services, Llc | 3.420 | -40,90 | 403 | -40,12 | ||||
| 2026-02-09 | 13F | First National Trust Co | 2.025 | 223 | ||||||
| 2026-02-05 | 13F | AlphaCore Capital LLC | 400 | 0,00 | 44 | 10,00 | ||||
| 2026-01-15 | 13F | Bernard Wealth Management Corp. | 1.559 | -2,50 | 172 | 6,88 | ||||
| 2026-02-02 | 13F | Summit Place Financial Advisors, LLC | 3.510 | 0,00 | 386 | 9,66 | ||||
| 2026-02-06 | 13F | Pnc Financial Services Group, Inc. | 200 | 0,00 | 22 | 10,00 | ||||
| 2026-02-12 | 13F | Principal Securities, Inc. | 0 | -100,00 | 0 | |||||
| 2026-02-17 | 13F | Jones Financial Companies Lllp | 2.838 | -0,28 | 312 | 15,99 | ||||
| 2026-02-17 | 13F | Toronto Dominion Bank | 2.905 | 0,00 | 320 | 9,62 | ||||
| 2026-01-14 | 13F | Jfs Wealth Advisors, Llc | 359 | 1,13 | 40 | 11,43 | ||||
| 2026-02-13 | 13F | Stifel Financial Corp | 6.603 | 2,36 | 727 | 12,21 | ||||
| 2026-02-19 | 13F | CI Private Wealth, LLC | 3.235 | 46,71 | 241 | 14,83 | ||||
| 2026-02-04 | 13F | Biltmore Family Office, LLC | 533 | 0,00 | 59 | 9,43 | ||||
| 2026-02-17 | 13F | Ameriprise Financial Inc | 4.766 | 55,70 | 524 | 70,68 | ||||
| 2026-02-13 | 13F | Flow Traders U.s. Llc | 14.796 | 17,75 | 2 | 0,00 | ||||
| 2026-01-30 | 13F | Activest Wealth Management | 625 | 0,00 | 69 | 9,68 | ||||
| 2026-02-11 | 13F | Viewpoint Capital Management LLC | 160 | 0,00 | 18 | 6,25 | ||||
| 2026-04-13 | 13F | Cyndeo Wealth Partners, LLC | 3.399 | -9,55 | 394 | -4,60 | ||||
| 2026-02-13 | 13F | Knollwood Investment Advisory, LLC | 6.925 | 0,00 | 762 | 9,65 | ||||
| 2026-02-11 | 13F | MCF Advisors LLC | 200 | 0,00 | 22 | 10,00 | ||||
| 2026-02-05 | 13F | Plante Moran Financial Advisors, LLC | 0 | -100,00 | 0 | |||||
| 2026-04-06 | 13F | Israel Discount Bank of New York | 3.920 | -12,60 | 455 | -7,91 | ||||
| 2026-02-12 | 13F | Bank Of Montreal /can/ | 3.875 | 108,78 | 426 | 129,03 | ||||
| 2026-04-08 | 13F | RVW Wealth, LLC | 8.302 | 6,68 | 963 | 12,50 | ||||
| 2026-01-23 | 13F | Westside Investment Management, Inc. | 600 | 0,00 | 66 | 10,00 | ||||
| 2026-02-04 | 13F | Rinkey Investments | 1.847 | 203 | ||||||
| 2026-02-13 | 13F | Glen Eagle Advisors, LLC | 5 | 0,00 | 1 |