Grundlæggende statistik
| Institutionelle ejere | 169 total, 169 long only, 0 short only, 0 long/short - change of 10,39% MRQ |
| Gennemsnitlig porteføljeallokering | 0.1663 % - change of 7,61% MRQ |
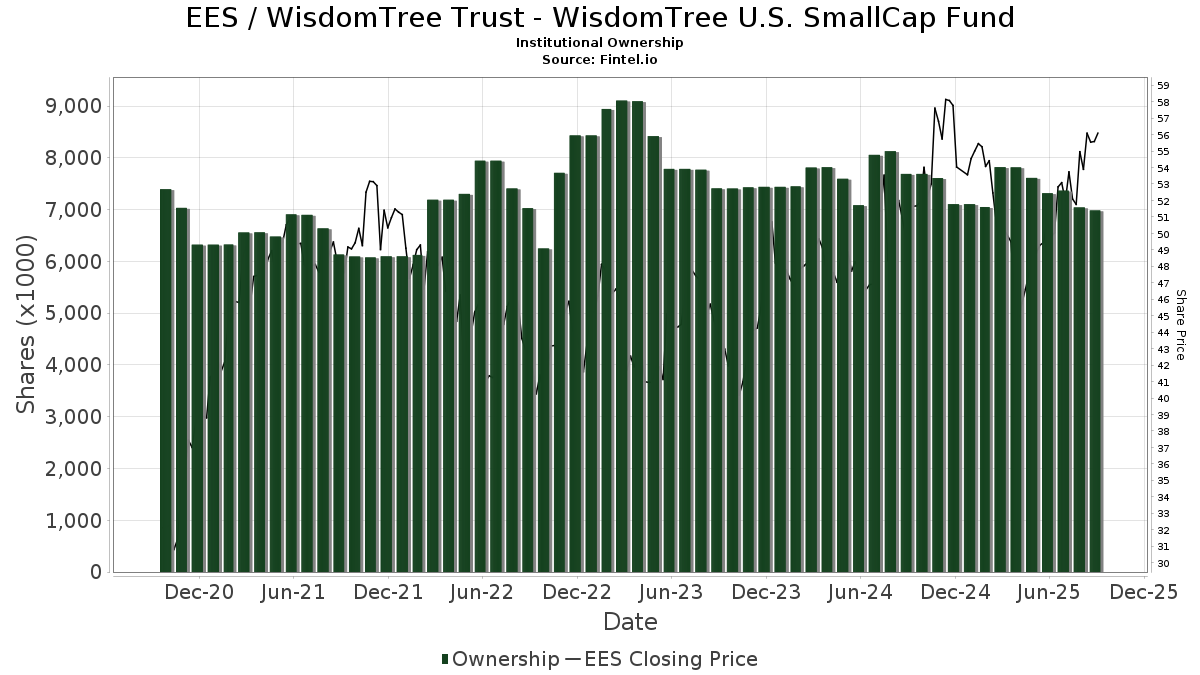
| Institutionelle aktier (lange) | 6.869.586 (ex 13D/G) - change of -0,10MM shares -1,37% MRQ |
| Institutionel værdi (lang) | $ 386.513 USD ($1000) |
Institutionelt ejerskab og aktionærer
WisdomTree Trust - WisdomTree U.S. SmallCap Fund (US:EES) har 169 institutionelle ejere og aktionærer, der har indsendt 13D/G- eller 13F-formularer til Securities Exchange Commission (SEC). Disse institutioner har i alt 6,869,586 aktier. Største aktionærer omfatter Morgan Stanley, UBS Group AG, LPL Financial LLC, Bank Of America Corp /de/, Ameriprise Financial Inc, Cetera Investment Advisers, Key FInancial Inc, Shore Point Advisors, LLC, Savant Capital, LLC, and Raymond James Financial Inc .
WisdomTree Trust - WisdomTree U.S. SmallCap Fund (ARCA:EES) institutionel ejerskabsstruktur viser aktuelle positioner i virksomheden efter institutioner og fonde, samt seneste ændringer i positionsstørrelse. Større aktionærer kan omfatte individuelle investorer, investeringsforeninger, hedgefonde eller institutioner. Skema 13D angiver, at investoren besidder (eller besidder) mere end 5 % af virksomheden og har til hensigt (eller har til hensigt at) aktivt at forfølge en ændring i forretningsstrategi. Skema 13G indikerer en passiv investering på over 5%.
The share price as of February 27, 2026 is 59,72 / share. Previously, on March 3, 2025, the share price was 50,84 / share. This represents an increase of 17,47% over that period.
Fondens stemningsscore
Fund Sentiment Score (fka Ownership Accumulation Score) finder de aktier, der bliver mest købt af fonde. Det er resultatet af en sofistikeret, multi-faktor kvantitativ model, der identificerer virksomheder med de højeste niveauer af institutionel akkumulering. Scoringsmodellen bruger en kombination af den samlede stigning i oplyste ejere, ændringerne i porteføljeallokeringer i disse ejere og andre målinger. Tallet går fra 0 til 100, hvor højere tal indikerer et højere niveau af akkumulering for sine jævnaldrende, og 50 er gennemsnittet.
Opdateringsfrekvens: Dagligt
Se Ownership Explorer, som giver en liste over højest rangerende virksomheder.
AI+ Ask Fintel’s AI assistant about WisdomTree Trust - WisdomTree U.S. SmallCap Fund.
Select a question to share a public post with an AI-crafted answer.
Thinking of good questions…
Institutionel Put/Call-forhold
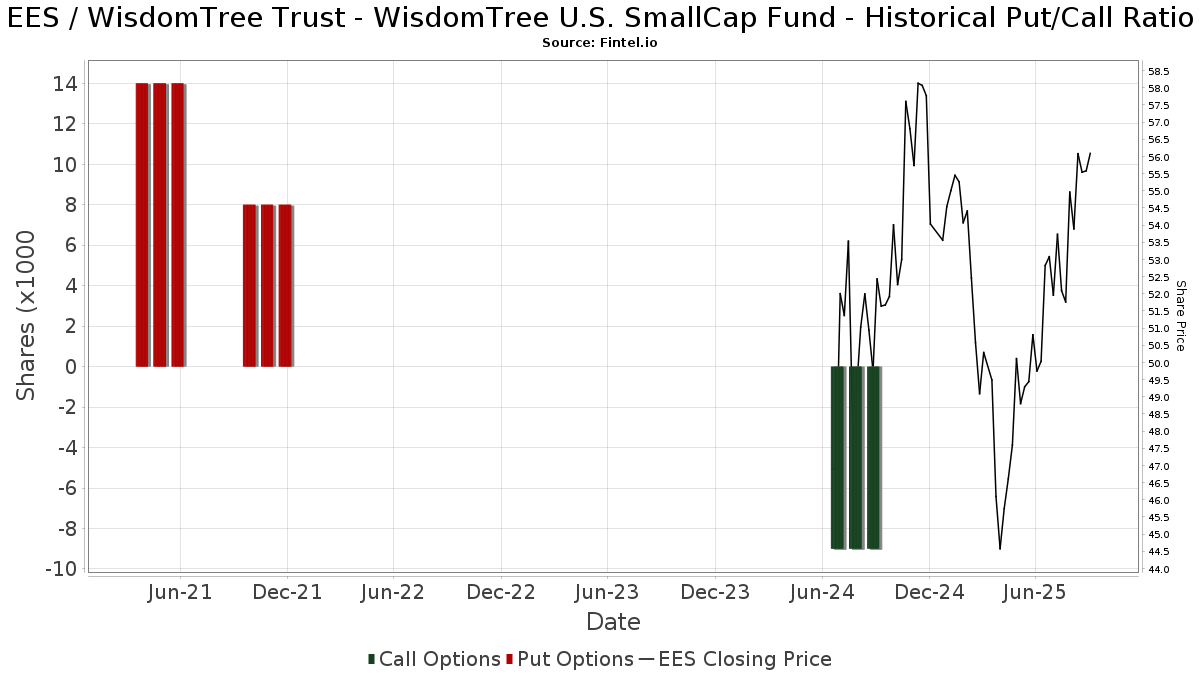
Ud over at indberette standardaktie- og gældsudstedelser skal institutter med mere end 100 mill. aktiver under forvaltning også oplyse deres put- og call-optionsbeholdninger. Da salgsoptioner generelt indikerer negativ stemning, og købsoptioner indikerer positiv stemning, kan vi få en fornemmelse af den overordnede institutionelle stemning ved at plotte forholdet mellem put og kald. Diagrammet til højre viser det historiske put/call-forhold for dette instrument.
Brug af Put/Call Ratio som en indikator for investorernes stemning overvinder en af de vigtigste mangler ved at bruge totalt institutionelt ejerskab, som er, at en betydelig mængde af aktiver under forvaltning investeres passivt for at spore indekser. Passivt forvaltede fonde køber typisk ikke optioner, så indikatoren for put/call-forholdet følger mere nøje følelsen af aktivt forvaltede fonde.
13F og NPORT arkivering
Detaljer om 13F-arkivering er gratis. Detaljer om NP-ansøgninger kræver et premium-medlemskab. Grønne rækker angiver nye positioner. Røde rækker angiver lukkede positioner. Klik på linket ikon for at se den fulde transaktionshistorik.
Opgrader
for at låse premium-data op og eksportere til Excel ![]() .
.
| Fil dato | Kilde | Investor | Type | Gennemsnitlig pris (Øst) |
Aktier | Δ Aktier (%) |
Rapporteret Værdi ($1000) |
Δ Værdi (%) |
Port Alloc (%) |
|
|---|---|---|---|---|---|---|---|---|---|---|
| 2026-02-10 | 13F | Godfrey Financial Associates, Inc. | 153 | 9 | ||||||
| 2026-01-23 | 13F | Nbt Bank N A /ny | 57 | 2 | ||||||
| 2026-01-29 | 13F | UBS Group AG | 720.592 | -1,44 | 41.023 | 0,43 | ||||
| 2026-01-27 | 13F | Institute for Wealth Management, LLC. | 4.290 | 0,00 | 244 | 2,09 | ||||
| 2026-01-05 | 13F | Horizons Wealth Management | 832 | 0,00 | 47 | 2,17 | ||||
| 2025-09-26 | NP | BLGR - Bluemonte Large Cap Growth ETF | 4 | 0 | ||||||
| 2026-02-13 | 13F | Pine Valley Investments Ltd Liability Co | 6.666 | 3,19 | 380 | 5,28 | ||||
| 2026-01-12 | 13F | Lvm Capital Management Ltd/mi | 3.916 | -5,77 | 0 | |||||
| 2026-02-11 | 13F | Lowe Brockenbrough & Co Inc | 1.200 | 0,00 | 68 | 1,49 | ||||
| 2026-02-05 | 13F | Wilson & Boucher Capital Management, LLC | 5.400 | 0,00 | 307 | 1,99 | ||||
| 2026-01-07 | 13F | Precedent Wealth Partners, Llc | 6.418 | -9,97 | 365 | -8,29 | ||||
| 2026-02-17 | 13F | Claro Advisors LLC | 7.049 | -14,18 | 401 | -12,45 | ||||
| 2026-01-26 | 13F | Asset Dedication, LLC | 3.162 | 0,00 | 180 | 2,27 | ||||
| 2026-01-30 | 13F | Arlington Trust Co LLC | 0 | -100,00 | 0 | |||||
| 2026-02-17 | 13F | Fmr Llc | 6.278 | -0,03 | 357 | 2,00 | ||||
| 2026-02-12 | 13F | Columbia River Financial Group, LLC | 9.175 | 0,00 | 1 | |||||
| 2026-01-12 | 13F | Roble, Belko & Company, Inc | 9.000 | 1 | ||||||
| 2026-01-16 | 13F | Ronald Blue Trust, Inc. | 2.708 | 0,00 | 154 | 1,99 | ||||
| 2026-02-13 | 13F | Arkadios Wealth Advisors | 158.396 | 26,48 | 9.017 | 28,89 | ||||
| 2026-02-17 | 13F | Ancora Advisors, LLC | 95 | 0,00 | 5 | 0,00 | ||||
| 2026-01-08 | 13F | Moller Financial Services | 18.397 | -0,24 | 1.047 | 1,65 | ||||
| 2026-01-29 | 13F | Howard Wealth Management, Llc | 19.170 | 0,00 | 1.091 | 1,87 | ||||
| 2026-02-17 | 13F | Creative Planning | 25.869 | 1,71 | 1.473 | 3,66 | ||||
| 2026-02-11 | 13F | Nemes Rush Group LLC | 8.956 | -2,47 | 510 | -0,78 | ||||
| 2026-02-17 | 13F | Forefront Analytics, LLC | 17.760 | -0,89 | 1.011 | 1,00 | ||||
| 2026-02-17 | 13F | Ameriflex Group, Inc. | 1.355 | 77 | ||||||
| 2026-01-20 | 13F | Savvy Advisors, Inc. | 6.212 | 5,11 | 354 | 6,97 | ||||
| 2025-09-26 | NP | BINT - Bluemonte Global Equity ETF | 19 | 1 | ||||||
| 2026-02-17 | 13F | Raymond James Financial Inc | 174.318 | 3,88 | 9.924 | 5,85 | ||||
| 2026-01-13 | 13F | CoreCap Advisors, LLC | 2.377 | 0,00 | 135 | 2,27 | ||||
| 2026-01-21 | 13F | Flagship Harbor Advisors, Llc | 14.493 | -1,86 | 825 | 0,00 | ||||
| 2026-02-09 | 13F | Kingsview Wealth Management, LLC | 5.210 | 0,00 | 297 | 1,72 | ||||
| 2026-01-13 | 13F | Team Financial Group, LLC | 2.740 | 0,33 | 156 | 1,97 | ||||
| 2026-02-17 | 13F | Advisory Services Network, LLC | 5.195 | 0,35 | 296 | 2,08 | ||||
| 2026-02-06 | 13F | Addison Advisors LLC | 225 | 0,00 | 13 | 0,00 | ||||
| 2026-01-28 | 13F | Geneos Wealth Management Inc. | 1.900 | 108 | ||||||
| 2026-02-13 | 13F | Golden State Wealth Management, LLC | 538 | 0,19 | 31 | 0,00 | ||||
| 2026-02-03 | 13F | Cheviot Value Management, LLC | 199 | 0,00 | 12 | 0,00 | ||||
| 2026-02-17 | 13F | Private Advisor Group, LLC | 73.194 | 17,62 | 4.167 | 19,85 | ||||
| 2026-02-13 | 13F | Ubs Asset Management Americas Inc | 882 | 50 | ||||||
| 2026-01-29 | 13F | Concurrent Investment Advisors, LLC | 18.469 | 64,23 | 1.051 | 67,36 | ||||
| 2026-02-11 | 13F | Jpmorgan Chase & Co | 44.796 | -0,26 | 2.550 | 1,63 | ||||
| 2026-02-17 | 13F | Susquehanna International Group, Llp | 5.128 | -51,94 | 292 | -51,17 | ||||
| 2026-02-11 | 13F | O'shaughnessy Asset Management, Llc | 3.417 | 0,00 | 195 | 2,11 | ||||
| 2026-01-23 | 13F | Oxler Private Wealth LLC | 11.862 | -6,19 | 675 | -4,39 | ||||
| 2025-10-15 | 13F | Defined Financial Planning LLC | 51.262 | 32,85 | 2.850 | 43,02 | ||||
| 2026-02-06 | 13F | Global Retirement Partners, LLC | 22.397 | -5,03 | 1.275 | -3,19 | ||||
| 2026-01-26 | 13F | AE Wealth Management LLC | 2.974 | 13,95 | 169 | 16,55 | ||||
| 2026-02-12 | 13F | Ankerstar Wealth, LLC | 264 | 15 | ||||||
| 2025-09-26 | NP | AAAA - Amplius Aggressive Asset Allocation ETF | 5.049 | 260 | ||||||
| 2026-02-17 | 13F | Cresset Asset Management, LLC | 7.728 | 0,00 | 440 | 1,86 | ||||
| 2026-02-17 | 13F | Royal Bank Of Canada | 101.675 | -8,04 | 5.789 | -6,30 | ||||
| 2026-01-26 | 13F | Merit Financial Group, LLC | 64.594 | 3.677 | ||||||
| 2025-11-12 | 13F | CIBC Bancorp USA Inc. | 10.740 | 600 | ||||||
| 2026-02-06 | 13F | Pnc Financial Services Group, Inc. | 1.605 | 0,00 | 91 | 2,25 | ||||
| 2026-01-29 | 13F | Sanctuary Advisors, LLC | 6.523 | 371 | ||||||
| 2026-01-29 | 13F | Nbc Securities, Inc. | 17.762 | 55,96 | 1.011 | 58,96 | ||||
| 2026-01-21 | 13F | Indiana Trust & Investment Management CO | 2.143 | 0,00 | 122 | 2,52 | ||||
| 2026-02-17 | 13F | IHT Wealth Management, LLC | 5.064 | -5,56 | 288 | -3,68 | ||||
| 2026-02-05 | 13F | Plante Moran Financial Advisors, LLC | 249 | 14 | ||||||
| 2026-02-10 | 13F/A | Northwestern Mutual Wealth Management Co | 4.046 | 31,36 | 230 | 33,72 | ||||
| 2026-02-13 | 13F | Pinnacle Wealth Planning Services, Inc. | 73 | 4 | ||||||
| 2026-01-21 | 13F | Culbertson A N & Co Inc | 61.811 | -1,04 | 3.519 | 0,83 | ||||
| 2026-02-14 | 13F | Rockefeller Capital Management L.P. | 46.139 | 379,96 | 2.627 | 389,01 | ||||
| 2026-02-06 | 13F | Larson Financial Group LLC | 15.121 | -1,82 | 861 | 0,00 | ||||
| 2025-09-26 | NP | BLUX - Bluemonte Dynamic Total Market ETF | 51 | 3 | ||||||
| 2026-02-06 | 13F | Eqis Capital Management, Inc. | 7.030 | -0,14 | 400 | 1,78 | ||||
| 2026-01-09 | 13F | Graves-Light Private Wealth Management, Inc. | 3.900 | 0,00 | 222 | 2,30 | ||||
| 2026-02-05 | 13F | Atria Investments Llc | 45.103 | -10,61 | 2.568 | -8,94 | ||||
| 2026-02-12 | 13F | Laurel Oak Wealth Management, Llc | 3.887 | 221 | ||||||
| 2026-02-09 | 13F | Harbour Investments, Inc. | 6.854 | 12,16 | 390 | 14,37 | ||||
| 2026-01-15 | 13F | Essential Planning, LLC. | 7.538 | -3,41 | 429 | -1,61 | ||||
| 2026-02-12 | 13F | Commonwealth Equity Services, Llc | 3.871 | -95,93 | 220 | 4.300,00 | ||||
| 2026-02-06 | 13F | Covestor Ltd | 133 | 2,31 | 0 | |||||
| 2025-10-10 | 13F | Kathleen S. Wright Associates Inc. | 134.121 | -0,43 | 7.493 | 9,16 | ||||
| 2026-02-12 | 13F | TopTier Wealth Management, LLC | 95.044 | 5.411 | ||||||
| 2026-02-12 | 13F | Wealthspire Advisors, LLC | 0 | -100,00 | 0 | |||||
| 2026-02-12 | 13F | Principal Securities, Inc. | 0 | -100,00 | 0 | |||||
| 2026-02-13 | 13F | Morgan Stanley | 733.144 | -3,71 | 41.738 | -1,88 | ||||
| 2026-01-14 | 13F | Kmg Fiduciary Partners, Llc | 10.599 | 0,34 | 603 | 2,20 | ||||
| 2026-02-17 | 13F | Jones Financial Companies Lllp | 1.366 | 7,14 | 78 | 8,45 | ||||
| 2026-01-29 | 13F | Comerica Bank | 1.969 | -31,08 | 112 | -29,56 | ||||
| 2026-02-17 | 13F | Equitable Holdings, Inc. | 4.498 | -6,25 | 256 | -4,48 | ||||
| 2026-01-29 | 13F | Dunhill Financial, LLC | 63 | 1,61 | 4 | 0,00 | ||||
| 2026-02-12 | 13F | CIBC Private Wealth Group, LLC | 10.740 | 0,00 | 611 | 1,83 | ||||
| 2026-02-12 | 13F | Betterment LLC | 8.757 | -5,68 | 0 | |||||
| 2026-01-12 | 13F | Amplius Wealth Advisors, LLC | 119.390 | -2,37 | 6.797 | -0,53 | ||||
| 2026-01-12 | 13F | World Equity Group, Inc. | 5.826 | 0,43 | 332 | 2,16 | ||||
| 2026-01-12 | 13F | Uhlmann Price Securities, Llc | 5.239 | 0,33 | 298 | 2,41 | ||||
| 2026-02-17 | 13F | Bank Of America Corp /de/ | 546.338 | -2,54 | 31.103 | -0,68 | ||||
| 2026-01-21 | 13F | Newbridge Financial Services Group, Inc. | 375 | 0,00 | 21 | 5,00 | ||||
| 2026-01-23 | 13F | U.S. Capital Wealth Advisors, LLC | 3.807 | 0,00 | 217 | 1,89 | ||||
| 2026-02-11 | 13F | Insight Advisors, LLC/ PA | 54.192 | 34,67 | 3.085 | 37,23 | ||||
| 2026-02-05 | 13F | Cambridge Investment Research Advisors, Inc. | 23.022 | 25,93 | 1 | 0,00 | ||||
| 2026-02-13 | 13F | Kestra Advisory Services, LLC | 0 | -100,00 | 0 | |||||
| 2026-02-13 | 13F | Mariner, LLC | 51.193 | 846,79 | 2.914 | 864,90 | ||||
| 2026-02-17 | 13F | Captrust Financial Advisors | 3.945 | 0,00 | 225 | 1,82 | ||||
| 2025-11-10 | 13F | Hartland & Co., LLC | 0 | -100,00 | 0 | |||||
| 2026-01-29 | 13F | Quest 10 Wealth Builders, Inc. | 0 | -100,00 | 0 | |||||
| 2026-01-27 | 13F | Berger Financial Group, Inc | 4.963 | 0,00 | 283 | 1,81 | ||||
| 2026-01-28 | 13F | Chicago Partners Investment Group LLC | 6.262 | -14,77 | 374 | -9,00 | ||||
| 2026-02-17 | 13F | Mercer Global Advisors Inc /adv | 5.668 | 323 | ||||||
| 2026-02-13 | 13F | Quattro Advisors LLC | 238 | 14 | ||||||
| 2026-02-13 | 13F | Wells Fargo & Company/mn | 141.392 | 15,17 | 8.049 | 17,35 | ||||
| 2026-02-10 | 13F | Linscomb & Williams, Inc. | 158.502 | -3,67 | 9.024 | -1,85 | ||||
| 2026-02-09 | 13F | Key FInancial Inc | 284.006 | 3,11 | 16.168 | 4,93 | ||||
| 2026-02-12 | 13F | Steward Partners Investment Advisory, Llc | 18.129 | -3,58 | 1.032 | -1,71 | ||||
| 2026-02-17 | 13F | Citadel Advisors Llc | 0 | -100,00 | 0 | |||||
| 2026-02-17 | 13F | Ameriprise Financial Inc | 463.887 | -0,89 | 26.409 | 1,01 | ||||
| 2026-01-26 | 13F | Means Investment Co., Inc. | 10.902 | 0,21 | 621 | 2,14 | ||||
| 2025-10-10 | 13F | Envision Financial LLC | 0 | -100,00 | 0 | |||||
| 2026-02-17 | 13F | Qube Research & Technologies Ltd | 133 | 0,00 | 8 | 0,00 | ||||
| 2026-02-12 | 13F | Johnson Financial Group, Inc. | 160 | 0,00 | 9 | 12,50 | ||||
| 2026-02-17 | 13F | D. E. Shaw & Co., Inc. | 3.755 | 0,00 | 214 | 1,91 | ||||
| 2025-09-26 | NP | BLUC - Bluemonte Large Cap Core ETF | 15 | 1 | ||||||
| 2026-02-12 | 13F | Bank Of Montreal /can/ | 475 | 26 | ||||||
| 2026-02-20 | 13F | Sunbelt Securities, Inc. | 39 | 0,00 | 2 | 0,00 | ||||
| 2026-02-05 | 13F | Allworth Financial LP | 513 | 0,00 | 29 | 3,57 | ||||
| 2026-02-17 | 13F | Cetera Investment Advisers | 376.996 | 2,94 | 21.462 | 4,89 | ||||
| 2026-01-29 | 13F | S.A. Mason LLC | 9.450 | 0,00 | 538 | 1,90 | ||||
| 2026-02-12 | 13F | Jane Street Group, Llc | 23.842 | 1.357 | ||||||
| 2026-02-17 | 13F | Aqr Capital Management Llc | 3.550 | 202 | ||||||
| 2026-02-13 | 13F | Luminist Capital LLC | 7 | 0,00 | 0 | |||||
| 2026-02-17 | 13F | Advisor Group Holdings, Inc. | 42.569 | -4,85 | 2.424 | -3,23 | ||||
| 2026-01-14 | 13F | Exchange Traded Concepts, Llc | 52 | -28,77 | 3 | -50,00 | ||||
| 2026-01-21 | 13F | Crux Wealth Advisors | 4.744 | -2,29 | 270 | -0,37 | ||||
| 2025-11-14 | 13F | Herbst Group, Llc | 0 | -100,00 | 0 | |||||
| 2026-01-21 | 13F | Modera Wealth Management, LLC | 7.321 | 7,33 | 417 | 9,19 | ||||
| 2026-01-05 | 13F | GAMMA Investing LLC | 106 | 0,00 | 6 | 20,00 | ||||
| 2026-02-03 | 13F | Coston, McIsaac & Partners | 100 | 0,00 | 0 | |||||
| 2026-02-10 | 13F | Savant Capital, LLC | 182.618 | -8,98 | 10.396 | -7,24 | ||||
| 2026-01-12 | 13F | DAVENPORT & Co LLC | 6.741 | -11,14 | 384 | -9,46 | ||||
| 2026-01-26 | 13F | Cwm, Llc | 15.506 | 24,01 | 1 | |||||
| 2026-02-17 | 13F | Blair William & Co/il | 6.419 | -3,42 | 365 | -1,62 | ||||
| 2026-01-12 | 13F | Abound Wealth Management | 84 | -49,40 | 5 | -55,56 | ||||
| 2026-02-06 | 13F | Forefront Wealth Partners, LLC | 0 | -100,00 | 0 | |||||
| 2026-02-17 | 13F | NewSquare Capital LLC | 53.713 | 9,98 | 3.058 | 12,06 | ||||
| 2026-02-12 | 13F | Titleist Asset Management, Llc | 13.501 | 769 | ||||||
| 2025-11-12 | 13F | Transce3nd, LLC | 0 | -100,00 | 0 | |||||
| 2026-02-13 | 13F | Stifel Financial Corp | 49.133 | -0,39 | 2.797 | 1,52 | ||||
| 2026-02-17 | 13F | Tower Research Capital LLC (TRC) | 15 | -21,05 | 1 | -100,00 | ||||
| 2026-01-23 | 13F | Assetmark, Inc | 751 | 0,00 | 43 | 2,44 | ||||
| 2026-02-03 | 13F | RFG Advisory, LLC | 8.363 | 41,31 | 476 | 44,24 | ||||
| 2026-01-30 | 13F | Us Bancorp \de\ | 8.577 | 0,00 | 488 | 1,88 | ||||
| 2026-02-05 | 13F | Tucker Asset Management Llc | 61 | 3 | ||||||
| 2026-01-14 | 13F | Jfs Wealth Advisors, Llc | 1.813 | 0,00 | 103 | 1,98 | ||||
| 2026-02-17 | 13F | Warren Averett Asset Management, LLC | 79.105 | -0,20 | 4.503 | 1,69 | ||||
| 2026-02-11 | 13F | LPL Financial LLC | 580.190 | 5,24 | 33.030 | 7,24 | ||||
| 2026-02-02 | 13F | Capital Management Corp /va | 5.417 | 0,00 | 308 | 1,99 | ||||
| 2026-02-19 | 13F | Claris Financial LLC | 24.437 | 49,53 | 1.391 | 67,19 | ||||
| 2026-02-13 | 13F | Smartleaf Asset Management LLC | 25.109 | 35,75 | 1.440 | 39,57 | ||||
| 2026-02-11 | 13F | Howard Bailey Securities, Llc | 5.702 | -91,86 | 325 | -91,72 | ||||
| 2026-02-02 | 13F | Essex Savings Bank | 4.200 | 0,00 | 239 | 2,14 | ||||
| 2026-02-11 | 13F | Smithbridge Asset Management Inc/de | 8.058 | 81,12 | 459 | 84,68 | ||||
| 2025-09-26 | NP | BVAL - Bluemonte Large Cap Value ETF | 16 | 1 | ||||||
| 2026-01-14 | 13F | Nova Wealth Management, Inc. | 53 | 0,00 | 3 | 50,00 | ||||
| 2026-02-17 | 13F | Wiley Bros.-aintree Capital, Llc | 34.577 | 0,00 | 1.968 | 1,92 | ||||
| 2026-02-09 | 13F | Prospera Financial Services Inc | 0 | -100,00 | 0 | |||||
| 2026-02-13 | 13F | Citigroup Inc | 1.840 | 0,00 | 105 | 1,96 | ||||
| 2026-02-10 | 13F | Operose Advisors LLC | 27 | 2 | ||||||
| 2026-02-10 | 13F | Rothschild Investment Llc | 900 | -35,71 | 51 | -34,62 | ||||
| 2026-02-09 | 13F | PSI Advisors, LLC | 5.893 | -1,31 | 335 | 0,60 | ||||
| 2026-02-09 | 13F | Frazier Financial Advisors, LLC | 1.032 | 0,00 | 59 | 1,75 | ||||
| 2026-01-23 | 13F | Financial Connections Group, Inc. | 1.350 | 0,00 | 0 | |||||
| 2026-01-30 | 13F | Laurel Wealth Advisors LLC | 4.180 | 238 | ||||||
| 2026-01-08 | 13F | Wealth Enhancement Advisory Services, Llc | 6.195 | 0,08 | 363 | 6,47 | ||||
| 2026-01-23 | 13F | Farther Finance Advisors, LLC | 1 | 0 | ||||||
| 2026-02-06 | 13F | IFP Advisors, Inc | 624 | 0,00 | 36 | 2,94 | ||||
| 2026-02-13 | 13F | Mml Investors Services, Llc | 7.842 | -0,41 | 446 | 1,59 | ||||
| 2026-01-23 | 13F | Optima Capital Llc | 24.240 | 0,04 | 1.380 | 1,92 | ||||
| 2026-02-10 | 13F | Envestnet Asset Management Inc | 77.682 | -31,51 | 4.422 | -30,21 | ||||
| 2026-02-13 | 13F | Aptus Capital Advisors, LLC | 410 | 23 | ||||||
| 2026-01-21 | 13F | Register Financial Advisors LLC | 1.507 | 0,07 | 86 | 1,19 | ||||
| 2026-01-28 | 13F | New Perspectives, Inc | 21.928 | -6,15 | 1.248 | -4,37 | ||||
| 2026-02-17 | 13F | Two Sigma Investments, Lp | 10.100 | 140,48 | 575 | 145,30 | ||||
| 2026-02-13 | 13F | Colony Group, LLC | 4.222 | 11,84 | 240 | 14,29 | ||||
| 2026-01-23 | 13F | Shore Point Advisors, LLC | 263.725 | -0,28 | 15.014 | 1,61 | ||||
| 2026-02-10 | 13F | Root Financial Partners, LLC | 567 | 0,00 | 32 | 3,23 | ||||
| 2026-02-11 | 13F | Empowered Funds, LLC | 6.722 | -5,10 | 383 | -3,29 | ||||
| 2026-02-10 | 13F | Goldman Sachs Group Inc | 15.029 | 0,00 | 856 | 1,91 | ||||
| 2026-02-11 | 13F | Janney Montgomery Scott LLC | 4.349 | -9,58 | 0 | |||||
| 2025-11-14 | 13F | Clearwater Capital Advisors, LLC | 0 | -100,00 | 0 |