Grundlæggende statistik
| Institutionelle ejere | 189 total, 189 long only, 0 short only, 0 long/short - change of 10,47% MRQ |
| Gennemsnitlig porteføljeallokering | 0.1568 % - change of -31,50% MRQ |
| Institutionelle aktier (lange) | 17.506.334 (ex 13D/G) - change of 0,42MM shares 2,44% MRQ |
| Institutionel værdi (lang) | $ 536.057 USD ($1000) |
Institutionelt ejerskab og aktionærer
iShares, Inc. - iShares Emerging Markets Dividend ETF (US:DVYE) har 189 institutionelle ejere og aktionærer, der har indsendt 13D/G- eller 13F-formularer til Securities Exchange Commission (SEC). Disse institutioner har i alt 17,506,334 aktier. Største aktionærer omfatter Bank Of America Corp /de/, Creative Planning, Morgan Stanley, Keybank National Association/oh, UBS Group AG, Susquehanna International Group, Llp, LPL Financial LLC, Cresset Asset Management, LLC, Auto-Owners Insurance Co, and BCJ Capital Management, LLC .
iShares, Inc. - iShares Emerging Markets Dividend ETF (ARCA:DVYE) institutionel ejerskabsstruktur viser aktuelle positioner i virksomheden efter institutioner og fonde, samt seneste ændringer i positionsstørrelse. Større aktionærer kan omfatte individuelle investorer, investeringsforeninger, hedgefonde eller institutioner. Skema 13D angiver, at investoren besidder (eller besidder) mere end 5 % af virksomheden og har til hensigt (eller har til hensigt at) aktivt at forfølge en ændring i forretningsstrategi. Skema 13G indikerer en passiv investering på over 5%.
The share price as of March 6, 2026 is 33,61 / share. Previously, on March 10, 2025, the share price was 26,83 / share. This represents an increase of 25,27% over that period.

Fondens stemningsscore
Fund Sentiment Score (fka Ownership Accumulation Score) finder de aktier, der bliver mest købt af fonde. Det er resultatet af en sofistikeret, multi-faktor kvantitativ model, der identificerer virksomheder med de højeste niveauer af institutionel akkumulering. Scoringsmodellen bruger en kombination af den samlede stigning i oplyste ejere, ændringerne i porteføljeallokeringer i disse ejere og andre målinger. Tallet går fra 0 til 100, hvor højere tal indikerer et højere niveau af akkumulering for sine jævnaldrende, og 50 er gennemsnittet.
Opdateringsfrekvens: Dagligt
Se Ownership Explorer, som giver en liste over højest rangerende virksomheder.
AI+ Ask Fintel’s AI assistant about iShares, Inc. - iShares Emerging Markets Dividend ETF.
Select a question to share a public post with an AI-crafted answer.
Thinking of good questions…
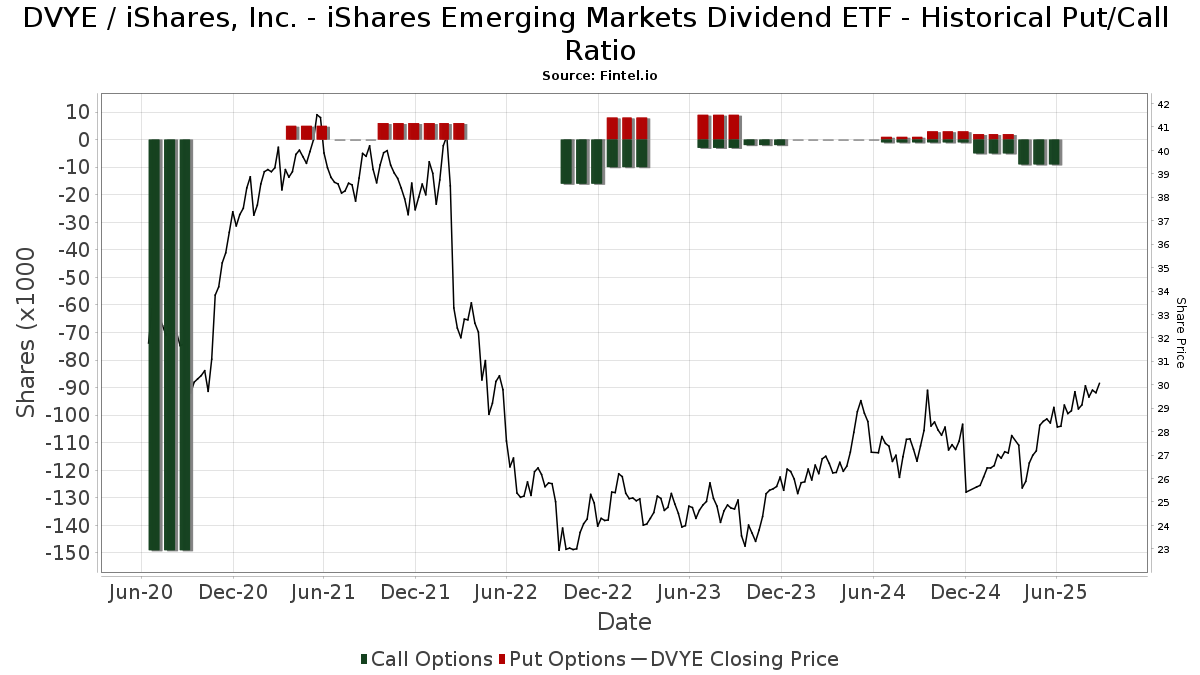
Institutionel Put/Call-forhold
Ud over at indberette standardaktie- og gældsudstedelser skal institutter med mere end 100 mill. aktiver under forvaltning også oplyse deres put- og call-optionsbeholdninger. Da salgsoptioner generelt indikerer negativ stemning, og købsoptioner indikerer positiv stemning, kan vi få en fornemmelse af den overordnede institutionelle stemning ved at plotte forholdet mellem put og kald. Diagrammet til højre viser det historiske put/call-forhold for dette instrument.
Brug af Put/Call Ratio som en indikator for investorernes stemning overvinder en af de vigtigste mangler ved at bruge totalt institutionelt ejerskab, som er, at en betydelig mængde af aktiver under forvaltning investeres passivt for at spore indekser. Passivt forvaltede fonde køber typisk ikke optioner, så indikatoren for put/call-forholdet følger mere nøje følelsen af aktivt forvaltede fonde.
13F og NPORT arkivering
Detaljer om 13F-arkivering er gratis. Detaljer om NP-ansøgninger kræver et premium-medlemskab. Grønne rækker angiver nye positioner. Røde rækker angiver lukkede positioner. Klik på linket ikon for at se den fulde transaktionshistorik.
Opgrader
for at låse premium-data op og eksportere til Excel ![]() .
.
| Fil dato | Kilde | Investor | Type | Gennemsnitlig pris (Øst) |
Aktier | Δ Aktier (%) |
Rapporteret Værdi ($1000) |
Δ Værdi (%) |
Port Alloc (%) |
|
|---|---|---|---|---|---|---|---|---|---|---|
| 2026-02-11 | 13F | LPL Financial LLC | 733.741 | 16,99 | 22.863 | 22,79 | ||||
| 2026-02-02 | 13F | Peregrine Asset Advisers, Inc. | 210.037 | 431,82 | 6.545 | 458,36 | ||||
| 2026-02-17 | 13F | Royal Bank Of Canada | 244.320 | 1,54 | 7.613 | 6,56 | ||||
| 2026-02-09 | 13F | Harbour Investments, Inc. | 1.363 | 0,00 | 42 | 5,00 | ||||
| 2026-02-12 | 13F | Wealthspire Advisors, LLC | 51.658 | 0,00 | 1.610 | 4,96 | ||||
| 2026-01-26 | 13F | Whittier Trust Co | 488 | 0,00 | 16 | 7,14 | ||||
| 2026-02-13 | 13F | Citigroup Inc | 8.284 | 258 | ||||||
| 2026-02-17 | 13F | Raymond James Financial Inc | 103.236 | 21,67 | 3.217 | 27,67 | ||||
| 2026-02-17 | 13F | Gladstone Institutional Advisory LLC | 11.645 | 38,88 | 363 | 45,97 | ||||
| 2026-02-13 | 13F | Barclays Plc | 0 | -100,00 | 0 | |||||
| 2025-11-14 | 13F | Citadel Advisors Llc | Call | 0 | -100,00 | 0 | -100,00 | |||
| 2026-02-10 | 13F/A | Northwestern Mutual Wealth Management Co | 45.313 | 16,51 | 1.412 | 22,27 | ||||
| 2026-02-05 | 13F | Western Wealth Management, LLC | 9.413 | 17,05 | 293 | 23,11 | ||||
| 2026-02-17 | 13F | Ameriprise Financial Inc | 60.815 | 475,19 | 1.903 | 507,99 | ||||
| 2025-11-06 | 13F | Financial Advocates Investment Management | 0 | -100,00 | 0 | |||||
| 2026-01-08 | 13F | Armstrong Advisory Group, Inc | 40.709 | 37,67 | 1.268 | 44,58 | ||||
| 2026-01-26 | 13F | AE Wealth Management LLC | 857 | 0,00 | 27 | 4,00 | ||||
| 2026-02-05 | 13F | Tucker Asset Management Llc | 29 | 1 | ||||||
| 2025-11-13 | 13F | Glenmede Investment Management, LP | 9.500 | -40,62 | 282 | -38,43 | ||||
| 2026-02-10 | 13F | Lido Advisors, LLC | 52.290 | 0,08 | 1.626 | 4,84 | ||||
| 2026-02-13 | 13F | National Bank Of Canada /fi/ | 9.136 | -34,65 | 284 | -31,40 | ||||
| 2026-02-13 | 13F | Eagle Bluffs Wealth Management LLC | 0 | -100,00 | 0 | |||||
| 2026-01-29 | 13F | Concord Wealth Partners | 96.223 | 1,79 | 2.998 | 6,84 | ||||
| 2026-02-10 | 13F | Blueline Advisors Llc | 0 | 0 | ||||||
| 2026-02-12 | 13F | Planning Project LLC | 1.216 | 38 | ||||||
| 2026-01-30 | 13F | Pekin Hardy Strauss, Inc. | 123.995 | 77,43 | 3.864 | 86,26 | ||||
| 2026-02-11 | 13F | Ipsen Advisor Group LLC | 49.278 | 1,81 | 1.535 | 6,82 | ||||
| 2026-02-10 | 13F | CIBC Asset Management Inc | 6.753 | -18,79 | 210 | -14,63 | ||||
| 2026-02-12 | 13F | BlackRock, Inc. | 13.686 | 93,03 | 426 | 102,86 | ||||
| 2026-02-13 | 13F | Smartleaf Asset Management LLC | 1.003 | -0,40 | 31 | 6,90 | ||||
| 2026-02-17 | 13F | United Capital Financial Advisers, Llc | 43.985 | -6,70 | 1.371 | -2,07 | ||||
| 2026-02-03 | 13F | International Assets Investment Management, Llc | 2.500 | 78 | ||||||
| 2026-02-10 | 13F | Cherry Tree Wealth Management, LLC | 281 | 0,00 | 9 | 0,00 | ||||
| 2026-02-17 | 13F | IHT Wealth Management, LLC | 11.589 | 7,02 | 361 | 12,46 | ||||
| 2025-10-10 | 13F | Sound Income Strategies, LLC | 0 | -100,00 | 0 | -100,00 | ||||
| 2025-11-14 | 13F | Eqis Capital Management, Inc. | 0 | -100,00 | 0 | |||||
| 2026-02-13 | 13F | Wells Fargo & Company/mn | 175 | -97,92 | 5 | -97,99 | ||||
| 2026-01-20 | 13F | Nvwm, Llc | 51 | 2,00 | 2 | 0,00 | ||||
| 2026-02-11 | 13F | Jpmorgan Chase & Co | 277.124 | 69,75 | 8.635 | 78,19 | ||||
| 2026-02-10 | 13F | Elgethun Capital Management | 10.925 | 0,00 | 340 | 5,26 | ||||
| 2026-01-29 | 13F | Sanctuary Advisors, LLC | 72.208 | 22,56 | 2.250 | 28,64 | ||||
| 2026-01-29 | 13F | UBS Group AG | 938.171 | 7,88 | 29.233 | 13,23 | ||||
| 2026-02-20 | 13F | Sunbelt Securities, Inc. | 25 | 0,00 | 1 | |||||
| 2025-10-15 | 13F | Private Trust Co Na | 0 | -100,00 | 0 | |||||
| 2026-02-12 | 13F | Commonwealth Equity Services, Llc | 231.832 | -15,36 | 7.224 | 90.187,50 | ||||
| 2026-01-29 | 13F | Concord Asset Management, LLC/VA | 94.656 | 1,04 | 2.949 | 6,04 | ||||
| 2026-02-03 | 13F | D.B. Root & Company, LLC | 10.850 | 338 | ||||||
| 2026-02-17 | 13F | Hyundai Investments Co., Ltd. | 14.536 | 454 | ||||||
| 2026-02-02 | 13F | Eq Wealth Advisors, Llc | 636 | 20 | ||||||
| 2026-02-04 | 13F | BCJ Capital Management, LLC | 396.053 | 13,72 | 12.341 | 19,34 | ||||
| 2026-01-30 | 13F | Keybank National Association/oh | 972.150 | 9,82 | 30.292 | 15,26 | ||||
| 2026-01-26 | 13F | Abundance Wealth Counselors | 7.671 | -2,47 | 239 | 2,58 | ||||
| 2026-02-10 | 13F | CFS Investment Advisory Services, LLC | 323.738 | 33,11 | 10.088 | 37,07 | ||||
| 2026-02-06 | 13F | Signature Estate & Investment Advisors Llc | 39.208 | -0,21 | 1.222 | 4,72 | ||||
| 2026-01-30 | 13F | Sigma Planning Corp | 8.620 | -5,57 | 269 | -1,11 | ||||
| 2026-02-11 | 13F | Winnow Wealth Llc | 19.454 | -7,86 | 623 | -1,74 | ||||
| 2026-02-17 | 13F | Creative Planning | 1.094.334 | -0,64 | 34.099 | 4,28 | ||||
| 2026-02-04 | 13F | Raelipskie Partnership | 21.540 | 1,60 | 671 | 6,68 | ||||
| 2026-01-26 | 13F | Cwm, Llc | 230 | 0,00 | 0 | |||||
| 2025-11-10 | 13F | Empirical Financial Services, LLC d.b.a. Empirical Wealth Management | 0 | -100,00 | 0 | |||||
| 2026-02-12 | 13F | Steward Partners Investment Advisory, Llc | 96.079 | -4,43 | 2.994 | 0,30 | ||||
| 2026-02-17 | 13F | Private Advisor Group, LLC | 42.223 | 3,51 | 1.316 | 8,59 | ||||
| 2026-01-23 | 13F | Eagle Strategies LLC | 18.683 | 5,16 | 582 | 10,44 | ||||
| 2025-11-13 | 13F | Diversify Advisory Services, LLC | 0 | -100,00 | 0 | |||||
| 2026-02-17 | 13F | Cetera Investment Advisers | 130.678 | 53,37 | 4.072 | 60,97 | ||||
| 2026-02-24 | 13F | Astoria Portfolio Advisors LLC. | 24.377 | 855 | ||||||
| 2026-01-26 | 13F | Whittier Trust Co Of Nevada Inc | 271 | 0,00 | 9 | 0,00 | ||||
| 2026-01-26 | 13F | Invested Advisors | 13.163 | 410 | ||||||
| 2026-02-13 | 13F | 10Elms LLP | 26.106 | 0,00 | 813 | 4,90 | ||||
| 2026-02-17 | 13F | Citadel Advisors Llc | 282.762 | -77,49 | 8.811 | -76,37 | ||||
| 2026-02-06 | 13F | Envestnet Portfolio Solutions, Inc. | 7.647 | 238 | ||||||
| 2026-02-13 | 13F | Mml Investors Services, Llc | 12.791 | 16,81 | 399 | 22,46 | ||||
| 2026-02-17 | 13F | Blair William & Co/il | 1.625 | 0,00 | 51 | 4,17 | ||||
| 2025-11-19 | 13F/A | Auto-Owners Insurance Co | 500.000 | -71,43 | 14.845 | -70,39 | ||||
| 2026-02-05 | 13F | bLong Financial, LLC | 28.361 | -1,54 | 884 | 3,27 | ||||
| 2026-02-17 | 13F | Susquehanna International Group, Llp | 787.773 | -0,74 | 24.547 | 4,18 | ||||
| 2026-01-29 | 13F | Concurrent Investment Advisors, LLC | 20.400 | -5,99 | 636 | -1,40 | ||||
| 2026-02-10 | 13F | Crescent Grove Advisors, LLC | 139.341 | 0,98 | 4.342 | 5,96 | ||||
| 2026-01-23 | 13F | Rsm Us Wealth Management Llc | 7.013 | 0,00 | 220 | 5,77 | ||||
| 2026-02-04 | 13F | Securian Asset Management, Inc | 250.000 | 0,00 | 7.790 | 4,96 | ||||
| 2026-02-12 | 13F | Bank Of Montreal /can/ | 2.264 | 0,00 | 71 | 4,48 | ||||
| 2026-02-12 | 13F | Federation des caisses Desjardins du Quebec | 61 | 0,00 | 2 | 0,00 | ||||
| 2026-02-13 | 13F | Virtus ETF Advisers LLC | 101 | 818,18 | 3 | |||||
| 2026-01-16 | 13F | Balboa Wealth Partners | 8.909 | -6,80 | 278 | -2,12 | ||||
| 2026-01-30 | 13F | Joel Isaacson & Co., LLC | 0 | -100,00 | 0 | |||||
| 2026-02-17 | 13F | Old Mission Capital Llc | 34.945 | -62,45 | 1.089 | -60,62 | ||||
| 2026-02-17 | 13F | Tower Research Capital LLC (TRC) | 0 | -100,00 | 0 | |||||
| 2026-02-17 | 13F | Fmr Llc | 1.295 | -38,92 | 40 | -35,48 | ||||
| 2026-02-13 | 13F | Ariadne Wealth Management, LP | 73.201 | 0,00 | 2.547 | 10,26 | ||||
| 2026-01-08 | 13F | Wealth Enhancement Advisory Services, Llc | 100.700 | 13,60 | 3.210 | 23,51 | ||||
| 2026-02-11 | 13F | Argent Advisors, Inc. | 233.532 | -6,03 | 7.277 | -1,38 | ||||
| 2026-02-13 | 13F | Stifel Financial Corp | 145.682 | -1,40 | 4.540 | 3,46 | ||||
| 2026-01-08 | 13F | Wedmont Private Capital | 8.385 | 1,37 | 267 | 9,92 | ||||
| 2026-01-29 | 13F | Comerica Bank | 17.749 | -0,40 | 553 | 4,54 | ||||
| 2026-02-17 | 13F | Hancock Whitney Corp | 39.691 | 0,91 | 1.237 | 5,91 | ||||
| 2026-02-09 | 13F | Integrity Advisory Solutions, LLC | 15.928 | 6,58 | 496 | 11,96 | ||||
| 2026-01-28 | 13F | City State Bank | 185 | 0,00 | 6 | 0,00 | ||||
| 2026-02-06 | 13F | Pnc Financial Services Group, Inc. | 850 | 0,00 | 26 | 4,00 | ||||
| 2026-02-13 | 13F | Change Path, LLC | 21.205 | 13,34 | 661 | 18,92 | ||||
| 2025-11-14 | 13F | Wood Tarver Financial Group, LLC | 0 | -100,00 | 0 | |||||
| 2026-02-13 | 13F | Morgan Stanley | 1.087.489 | 9,45 | 33.886 | 14,86 | ||||
| 2025-11-14 | 13F | Financial Network Wealth Management LLC | 0 | -100,00 | 0 | |||||
| 2026-02-17 | 13F | State Of Wisconsin Investment Board | 267.953 | 0,00 | 8.349 | 4,95 | ||||
| 2026-02-11 | 13F | Straight Path Wealth Management | 6.850 | 213 | ||||||
| 2026-01-28 | 13F | Geneos Wealth Management Inc. | 939 | 0,00 | 29 | 7,41 | ||||
| 2026-02-17 | 13F | Captrust Financial Advisors | 6.492 | 202 | ||||||
| 2026-02-06 | 13F | Larson Financial Group LLC | 0 | -100,00 | 0 | |||||
| 2026-02-10 | 13F | Envestnet Asset Management Inc | 97.551 | 10,47 | 3.040 | 15,95 | ||||
| 2026-01-20 | 13F | AdvisorNet Financial, Inc | 806 | 0,00 | 25 | 8,70 | ||||
| 2026-01-20 | 13F | Ntv Asset Management Llc | 23.800 | 742 | ||||||
| 2026-02-03 | 13F | Sowa Financial Group, Inc. | 11.617 | -10,82 | 0 | |||||
| 2026-02-11 | 13F | Sunrise Financial Services, LLC | 1.263 | 39 | ||||||
| 2026-02-11 | 13F | Janney Montgomery Scott LLC | 109.694 | 33,26 | 3 | 50,00 | ||||
| 2026-01-07 | 13F | Stonebridge Wealth Management, LLC | 27.227 | 848 | ||||||
| 2026-01-12 | 13F | DAVENPORT & Co LLC | 8.241 | 2,79 | 257 | 7,56 | ||||
| 2026-01-09 | 13F | 180 Wealth Advisors, Llc | 47.739 | 6,57 | 1.488 | 11,80 | ||||
| 2026-01-26 | 13F | DORVAL Corp | 44.729 | 0,00 | 1.394 | 4,89 | ||||
| 2026-02-10 | 13F | Bank of New York Mellon Corp | 303.326 | 16,22 | 9.452 | 21,98 | ||||
| 2026-02-27 | 13F | Strategic Investment Solutions, Inc. /IL | 160 | 0,00 | 5 | 0,00 | ||||
| 2026-02-02 | 13F | Truist Financial Corp | 55.038 | -17,25 | 1.715 | -13,17 | ||||
| 2026-02-17 | 13F | Qube Research & Technologies Ltd | 0 | -100,00 | 0 | |||||
| 2026-02-12 | 13F | Principal Securities, Inc. | 0 | -100,00 | 0 | |||||
| 2026-02-13 | 13F | Kestra Advisory Services, LLC | 1.740 | 54 | ||||||
| 2026-02-17 | 13F | VestGen Advisors, LLC | 11.414 | -3,28 | 356 | 1,43 | ||||
| 2026-01-29 | 13F | D.a. Davidson & Co. | 27.865 | 15,31 | 868 | 21,06 | ||||
| 2025-11-17 | 13F | FSA Wealth Management LLC | 18 | 0,00 | 2 | 0,00 | ||||
| 2026-02-12 | 13F | Jane Street Group, Llc | Call | 21.600 | 673 | |||||
| 2026-01-23 | 13F | TFC Financial Management | 2.750 | 17,32 | 86 | 23,19 | ||||
| 2025-11-07 | 13F | Axxcess Wealth Management, Llc | 0 | -100,00 | 0 | |||||
| 2026-02-03 | 13F | Grange Capital, LLC | 103.144 | -0,46 | 3.214 | 4,45 | ||||
| 2026-02-09 | 13F | Prospera Financial Services Inc | 6.770 | 211 | ||||||
| 2026-02-03 | 13F | Crestwood Advisors Group LLC | 44.119 | 0,01 | 1.375 | 4,97 | ||||
| 2026-01-06 | 13F | Nelson, Van Denburg & Campbell Wealth Management Group, LLC | 9.145 | 285 | ||||||
| 2026-02-05 | 13F | Intrua Financial, LLC | 7.500 | 0,00 | 234 | 4,95 | ||||
| 2026-02-18 | 13F | GWM Advisors LLC | 108.066 | -58,54 | 3.367 | -56,48 | ||||
| 2026-02-13 | 13F | Colony Group, LLC | 69.042 | 2.151 | ||||||
| 2026-02-06 | 13F | GPS Wealth Strategies Group, LLC | 0 | -100,00 | 0 | |||||
| 2026-02-17 | 13F | Wiley Bros.-aintree Capital, Llc | 140.233 | 1,75 | 4.373 | 6,63 | ||||
| 2026-02-13 | 13F | Morgan Dempsey Capital Management Llc | 1.839 | 0,00 | 57 | 5,56 | ||||
| 2026-02-12 | 13F | Triumph Capital Management | 1.545 | 34,93 | 48 | 45,45 | ||||
| 2026-02-13 | 13F | Sweeney & Michel, Llc | 18.646 | 0,84 | 658 | 24,39 | ||||
| 2026-02-17 | 13F | Consultiva Wealth Management, Corp. | 630 | 0,00 | 20 | 5,56 | ||||
| 2026-02-13 | 13F | Baird Financial Group, Inc. | 51.001 | -7,18 | 1.589 | -2,58 | ||||
| 2026-02-13 | 13F | Solstein Capital, LLC | 58 | 0,00 | 2 | 0,00 | ||||
| 2026-02-12 | 13F | Jane Street Group, Llc | 250.000 | -49,68 | 7.790 | -47,18 | ||||
| 2025-10-16 | 13F | Lowe Wealth Advisors, LLC | 23.235 | 2,24 | 690 | 5,84 | ||||
| 2026-01-21 | 13F | Capital Investment Advisory Services, LLC | 2.445 | 0,00 | 76 | 5,56 | ||||
| 2026-02-13 | 13F | Advyzon Investment Management, LLC | 13.785 | 15,28 | 430 | 20,85 | ||||
| 2026-03-02 | 13F | Sankala Group LLC | 8 | 0 | ||||||
| 2026-01-30 | 13F | Wealthfront Advisers Llc | 45.525 | -1,94 | 1.419 | 2,90 | ||||
| 2026-02-06 | 13F | Mach-1 Financial Group, Inc. | 0 | -100,00 | 0 | |||||
| 2026-02-11 | 13F | SOUTH STATE Corp | 1.370 | 43 | ||||||
| 2026-01-22 | 13F | Apollon Wealth Management, LLC | 6.480 | 202 | ||||||
| 2026-02-13 | 13F | Mariner, LLC | 332.974 | 13,11 | 10.375 | 18,72 | ||||
| 2026-02-17 | 13F | Summit Global Investments | 80.164 | -10,54 | 2 | 0,00 | ||||
| 2026-02-17 | 13F | Glenmede Trust Co Na | 9.500 | -40,62 | 296 | -32,11 | ||||
| 2026-01-22 | 13F | Pinnacle Bancorp, Inc. | 5.800 | 0,00 | 181 | 4,65 | ||||
| 2026-01-28 | 13F | CAPROCK Group, Inc. | 0 | -100,00 | 0 | |||||
| 2025-12-09 | 13F | Painted Porch Advisors LLC | 185 | 0,00 | 5 | 0,00 | ||||
| 2026-01-27 | 13F | WestEnd Advisors, LLC | 147 | 0,00 | 5 | 0,00 | ||||
| 2026-02-12 | 13F | Investment Research Partners LLC | 14.211 | 2,30 | 443 | 4,00 | ||||
| 2026-01-26 | 13F | BCS Private Wealth Management, Inc. | 23.791 | 2,26 | 741 | 7,39 | ||||
| 2026-02-05 | 13F | Cambridge Investment Research Advisors, Inc. | 25.994 | -15,54 | 1 | |||||
| 2026-02-17 | 13F | Bank Of America Corp /de/ | 1.218.945 | 11,44 | 37.982 | 16,95 | ||||
| 2026-01-28 | 13F | Barrett & Company, Inc. | 19.734 | -1,66 | 615 | 3,19 | ||||
| 2026-02-04 | 13F | Pensionmark Financial Group, Llc | 32.017 | 0,68 | 988 | 4,56 | ||||
| 2025-11-14 | 13F | Strategic Wealth Partners, Ltd. | 0 | -100,00 | 0 | |||||
| 2026-01-28 | 13F | REDW Wealth LLC | 10.497 | 0,00 | 327 | 5,14 | ||||
| 2026-02-12 | 13F | Mission Creek Capital Partners, Inc. | 0 | -100,00 | 0 | |||||
| 2026-02-06 | 13F | 3EDGE Asset Management, LP | 177.304 | 4,33 | 5.525 | 9,49 | ||||
| 2026-02-03 | 13F | We Are One Seven, LLC | 17.726 | 552 | ||||||
| 2026-02-05 | 13F | Security National Bank | 4.947 | 0,00 | 154 | 5,48 | ||||
| 2026-02-05 | 13F | Stephens Inc /ar/ | 89.535 | 2,89 | 2.790 | 7,98 | ||||
| 2026-02-17 | 13F | Integrated Advisors Network LLC | 108.421 | 15,88 | 3.378 | 21,64 | ||||
| 2026-02-06 | 13F | Global Retirement Partners, LLC | 263 | 1,15 | 8 | 14,29 | ||||
| 2026-01-26 | 13F | Asset Dedication, LLC | 5.572 | -6,59 | 174 | -2,26 | ||||
| 2026-02-13 | 13F | MAI Capital Management | 25.535 | 1.347,56 | 796 | 1.428,85 | ||||
| 2026-01-29 | 13F | Ashton Thomas Private Wealth, LLC | 14.502 | 23,03 | 452 | 29,23 | ||||
| 2026-02-05 | 13F | Blume Capital Management, Inc. | 625 | 0,00 | 19 | 5,56 | ||||
| 2026-02-17 | 13F | Equitable Holdings, Inc. | 79.529 | 3,86 | 2.478 | 9,02 | ||||
| 2026-02-17 | 13F | Advisor Group Holdings, Inc. | 201.155 | 34,91 | 6.268 | 41,75 | ||||
| 2026-02-10 | 13F | Godfrey Financial Associates, Inc. | 1.017 | 32 | ||||||
| 2026-02-17 | 13F | Advisory Services Network, LLC | 0 | -100,00 | 0 | |||||
| 2026-01-28 | 13F | Glassman Wealth Services | 13 | 0,00 | 0 | |||||
| 2026-02-11 | 13F | Simplex Trading, Llc | 370 | 266,34 | 12 | |||||
| 2026-02-03 | 13F | Vantage Financial Partners, LLC | 30.270 | 1,38 | 943 | 6,43 | ||||
| 2026-02-06 | 13F | IFP Advisors, Inc | 9.606 | 111,49 | 299 | 123,13 | ||||
| 2026-02-17 | 13F | Cresset Asset Management, LLC | 527.767 | 0,28 | 16.445 | 5,25 | ||||
| 2026-02-13 | 13F | Beta Wealth Group, Inc. | 311.429 | -3,08 | 9.704 | 1,73 | ||||
| 2026-02-13 | 13F | Navis Wealth Advisors, LLC | 25.525 | 795 | ||||||
| 2026-02-06 | 13F | Marble Harbor Investment Counsel, LLC | 20.400 | -19,37 | 636 | -15,45 | ||||
| 2026-02-18 | 13F | Braeburn Wealth Management LLC | 6.575 | 205 | ||||||
| 2026-02-10 | 13F | CIBC World Markets Inc. | 20.486 | 638 | ||||||
| 2026-02-13 | 13F | Marshall Wace, Llp | 180.877 | 5.636 | ||||||
| 2026-02-13 | 13F | Level Four Advisory Services, Llc | 7.230 | 225 | ||||||
| 2026-02-17 | 13F | Angeles Wealth Management, Llc | 0 | -100,00 | 0 | |||||
| 2026-01-23 | 13F | DHJJ Financial Advisors, Ltd. | 6 | 0,00 | 0 | |||||
| 2026-01-27 | 13F | Revisor Wealth Management LLC | 241.153 | -4,64 | 8.023 | 8,16 | ||||
| 2026-02-14 | 13F | Rockefeller Capital Management L.P. | 43.149 | -3,71 | 1.345 | 1,05 | ||||
| 2026-02-03 | 13F | Encompass More Asset Management | 27.778 | 866 | ||||||
| 2026-02-20 | 13F | Kovitz Investment Group Partners, LLC | 0 | -100,00 | 0 | |||||
| 2026-02-11 | 13F | Buckingham Strategic Partners | 0 | -100,00 | 0 | |||||
| 2026-02-04 | 13F | Drive Wealth Management, Llc | 12.693 | 396 | ||||||
| 2025-10-21 | 13F | Optimum Investment Advisors | 11.801 | 6,88 | 350 | 10,76 | ||||
| 2026-02-17 | 13F | Mercer Global Advisors Inc /adv | 269.917 | 92,92 | 8.411 | 102,46 | ||||
| 2026-02-02 | 13F | Vista Capital Partners, Inc. | 26.957 | 0,00 | 840 | 4,88 | ||||
| 2026-02-17 | 13F | Jones Financial Companies Lllp | 22.983 | 70,50 | 716 | 80,81 | ||||
| 2026-01-23 | 13F | Assetmark, Inc | 253.754 | 1,75 | 7.907 | 6,78 | ||||
| 2026-02-05 | 13F | Park Square Financial Group, LLC | 0 | -100,00 | 0 | |||||
| 2026-01-14 | 13F | Crumly & Associates Inc. | 7.395 | 230 | ||||||
| 2026-02-09 | 13F | Thrive Capital Management, LLC | 93.957 | -1,21 | 2.928 | 3,68 | ||||
| 2026-02-04 | 13F | Anson Capital, Inc. | 63.823 | 39,42 | 1.989 | 46,28 | ||||
| 2026-02-13 | 13F | Golden State Wealth Management, LLC | 101 | 1,00 | 3 | 50,00 | ||||
| 2025-11-06 | 13F | Ameritas Advisory Services, LLC | 0 | -100,00 | 0 | -100,00 | ||||
| 2026-02-24 | 13F | SG Trading Solutions, LLC | 77.892 | 2 | ||||||
| 2026-02-06 | 13F | Cascade Financial Partners, LLC | 24.213 | 0,00 | 754 | 5,01 | ||||
| 2026-02-19 | 13F | CI Private Wealth, LLC | 6.644 | 207 | ||||||
| 2026-02-17 | 13F | Regal Investment Advisors LLC | 11.787 | 8,61 | 367 | 13,98 | ||||
| 2025-11-13 | 13F | Benchmark Investment Advisors LLC | 48.900 | 3,14 | 1.445 | 11,68 |