Grundlæggende statistik
| Institutionelle aktier (lange) | 3.820.114 - 20,99% (ex 13D/G) - change of 0,39MM shares 11,45% MRQ |
| Institutionel værdi (lang) | $ 305.586 USD ($1000) |
Institutionelt ejerskab og aktionærer
Danaos Corporation (US:DAC) har 137 institutionelle ejere og aktionærer, der har indsendt 13D/G- eller 13F-formularer til Securities Exchange Commission (SEC). Disse institutioner har i alt 3,820,114 aktier. Største aktionærer omfatter Acadian Asset Management Llc, ION Fund Management Ltd, RBF Capital, LLC, Ion Asset Management Ltd., No Street GP LP, Morgan Stanley, Jpmorgan Chase & Co, Goldman Sachs Group Inc, Two Sigma Investments, Lp, and Arrowstreet Capital, Limited Partnership .
Danaos Corporation (NYSE:DAC) institutionel ejerskabsstruktur viser aktuelle positioner i virksomheden efter institutioner og fonde, samt seneste ændringer i positionsstørrelse. Større aktionærer kan omfatte individuelle investorer, investeringsforeninger, hedgefonde eller institutioner. Skema 13D angiver, at investoren besidder (eller besidder) mere end 5 % af virksomheden og har til hensigt (eller har til hensigt at) aktivt at forfølge en ændring i forretningsstrategi. Skema 13G indikerer en passiv investering på over 5%.
The share price as of March 20, 2026 is 111,70 / share. Previously, on March 24, 2025, the share price was 81,14 / share. This represents an increase of 37,66% over that period.

Fondens stemningsscore
Fund Sentiment Score (fka Ownership Accumulation Score) finder de aktier, der bliver mest købt af fonde. Det er resultatet af en sofistikeret, multi-faktor kvantitativ model, der identificerer virksomheder med de højeste niveauer af institutionel akkumulering. Scoringsmodellen bruger en kombination af den samlede stigning i oplyste ejere, ændringerne i porteføljeallokeringer i disse ejere og andre målinger. Tallet går fra 0 til 100, hvor højere tal indikerer et højere niveau af akkumulering for sine jævnaldrende, og 50 er gennemsnittet.
Opdateringsfrekvens: Dagligt
Se Ownership Explorer, som giver en liste over højest rangerende virksomheder.
AI+ Ask Fintel’s AI assistant about Danaos Corporation.
Select a question to share a public post with an AI-crafted answer.
Thinking of good questions…
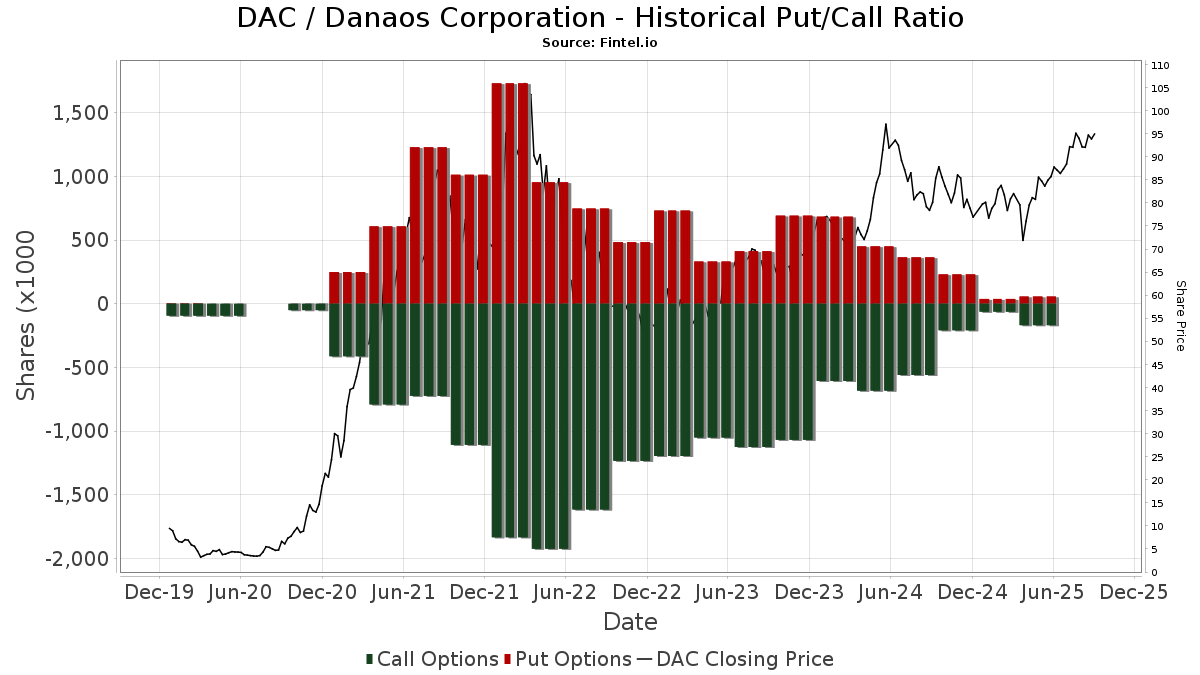
Institutionel Put/Call-forhold
Ud over at indberette standardaktie- og gældsudstedelser skal institutter med mere end 100 mill. aktiver under forvaltning også oplyse deres put- og call-optionsbeholdninger. Da salgsoptioner generelt indikerer negativ stemning, og købsoptioner indikerer positiv stemning, kan vi få en fornemmelse af den overordnede institutionelle stemning ved at plotte forholdet mellem put og kald. Diagrammet til højre viser det historiske put/call-forhold for dette instrument.
Brug af Put/Call Ratio som en indikator for investorernes stemning overvinder en af de vigtigste mangler ved at bruge totalt institutionelt ejerskab, som er, at en betydelig mængde af aktiver under forvaltning investeres passivt for at spore indekser. Passivt forvaltede fonde køber typisk ikke optioner, så indikatoren for put/call-forholdet følger mere nøje følelsen af aktivt forvaltede fonde.
13D/G-arkivering
Vi præsenterer 13D/G ansøgninger separat fra 13F ansøgninger på grund af den forskellige behandling af SEC. 13D/G-ansøgninger kan indgives af grupper af investorer (med én ledende), hvorimod 13F-ansøgninger ikke kan. Dette resulterer i situationer, hvor en investor kan indsende en 13D/G, der rapporterer én værdi for de samlede aktier (der repræsenterer alle de aktier, der ejes af investorgruppen), men derefter indsender en 13F, der rapporterer en anden værdi for de samlede aktier (der udelukkende repræsenterer deres egne) ejendomsret). Det betyder, at aktieejerskab af 13D/G-arkiver og 13F-arkiveringer ofte ikke er direkte sammenlignelige, så vi præsenterer dem separat.
Bemærk: Fra den 16. maj 2021 viser vi ikke længere ejere, der ikke har indsendt en 13D/G inden for det seneste år. Tidligere viste vi den fulde historie af 13D/G-arkiver. Generelt skal enheder, der er forpligtet til at indgive 13D/G-ansøgninger, indgive mindst årligt, før de indsender en afsluttende ansøgning. Dog forlader fonde nogle gange positioner uden at indsende en afsluttende ansøgning (dvs. de afvikler), så visning af den fulde historie resulterede nogle gange i forvirring om det nuværende ejerskab. For at undgå forvirring viser vi nu kun 'aktuelle' ejere - det vil sige - ejere, der har anmeldt inden for det seneste år.
Upgrade to unlock premium data.
| Fil dato | Form | Investor | Forrige Aktier |
Seneste Aktier |
Δ Aktier (Procent) |
Ejendomsret (Procent) |
Δ Ejerskab (Procent) |
|
|---|---|---|---|---|---|---|---|---|
| 2025-11-19 | Danaos Investments Ltd As Trustee Of The 883 Trust | 9,338,502 | 9,538,502 | 2.14 | 51.80 | 2.57 |
13F og NPORT arkivering
Detaljer om 13F-arkivering er gratis. Detaljer om NP-ansøgninger kræver et premium-medlemskab. Grønne rækker angiver nye positioner. Røde rækker angiver lukkede positioner. Klik på linket ikon for at se den fulde transaktionshistorik.
Opgrader
for at låse premium-data op og eksportere til Excel ![]() .
.
| Fil dato | Kilde | Investor | Type | Gennemsnitlig pris (Øst) |
Aktier | Δ Aktier (%) |
Rapporteret Værdi ($1000) |
Δ Værdi (%) |
Port Alloc (%) |
|
|---|---|---|---|---|---|---|---|---|---|---|
| 2026-02-03 | 13F | SBI Securities Co., Ltd. | 117 | -5,65 | 11 | 0,00 | ||||
| 2026-02-13 | 13F | Verition Fund Management LLC | 12.461 | -31,52 | 1.174 | -28,21 | ||||
| 2026-02-17 | 13F | XTX Topco Ltd | 21.161 | 1.993 | ||||||
| 2026-02-04 | 13F | Pacer Advisors, Inc. | 0 | -100,00 | 0 | |||||
| 2026-02-17 | 13F/A | RBF Capital, LLC | 418.015 | 0,00 | 39.369 | 4,87 | ||||
| 2026-02-17 | 13F | Jump Financial, LLC | 25.108 | 4,16 | 2.365 | 9,24 | ||||
| 2026-02-13 | 13F | MAI Capital Management | 33 | 0,00 | 3 | 50,00 | ||||
| 2026-01-23 | 13F | Assetmark, Inc | 42 | -91,03 | 4 | -92,86 | ||||
| 2026-01-29 | 13F | UBS Group AG | 49.854 | -8,44 | 4.695 | -3,99 | ||||
| 2026-02-18 | 13F | Vident Advisory, LLC | 6.408 | -16,08 | 604 | -11,97 | ||||
| 2026-02-17 | 13F | Creative Planning | 7.427 | 9,35 | 699 | 14,78 | ||||
| 2026-02-18 | 13F | State of Tennessee, Treasury Department | 3.935 | 407 | ||||||
| 2025-09-29 | NP | PRFZ - Invesco FTSE RAFI US 1500 Small-Mid ETF This fund is a listed as child fund of Invesco Ltd. and if that institution has disclosed ownership in this security, then these positions will not be double counted when calculating total shares and total value | 18.695 | -34,11 | 1.716 | -25,42 | ||||
| 2026-02-17 | 13F | Qube Research & Technologies Ltd | 29.853 | 101,72 | 2.812 | 111,51 | ||||
| 2026-02-24 | 13F | DGS Capital Management, LLC | 26.310 | 3,81 | 2.478 | 8,83 | ||||
| 2026-02-11 | 13F | O'shaughnessy Asset Management, Llc | 4.671 | 3,66 | 440 | 8,66 | ||||
| 2026-02-13 | 13F | Inspire Advisors, LLC | 0 | -100,00 | 0 | -100,00 | ||||
| 2026-02-10 | 13F | Commonwealth Of Pennsylvania Public School Empls Retrmt Sys | 12.278 | 0,00 | 1.156 | 4,90 | ||||
| 2026-02-11 | 13F | Group One Trading, L.p. | Put | 100 | -99,62 | 9 | -99,62 | |||
| 2026-02-12 | 13F | Jane Street Group, Llc | Put | 0 | -100,00 | 0 | -100,00 | |||
| 2026-02-11 | 13F | Group One Trading, L.p. | 1.493 | -60,49 | 141 | -58,70 | ||||
| 2026-02-12 | 13F | Aristides Capital LLC | 2.570 | -13,53 | 242 | -9,02 | ||||
| 2026-02-13 | 13F | Pinney & Scofield, Inc. | 255 | 0,00 | 24 | 9,09 | ||||
| 2026-02-13 | 13F | Police & Firemen's Retirement System of New Jersey | 4.072 | 384 | ||||||
| 2026-01-16 | 13F | Ronald Blue Trust, Inc. | 309 | -52,31 | 29 | -50,00 | ||||
| 2026-02-12 | 13F | Counterpoint Mutual Funds LLC | 2.534 | 239 | ||||||
| 2026-02-13 | 13F | State Street Corp | 15.761 | 2,42 | 1.484 | 7,38 | ||||
| 2026-02-17 | 13F | Mangrove Partners | 5.833 | 549 | ||||||
| 2026-02-17 | 13F | Jones Financial Companies Lllp | 48 | 0,00 | 5 | 0,00 | ||||
| 2026-02-06 | 13F | Bastion Asset Management Inc. | 0 | -100,00 | 0 | -100,00 | ||||
| 2026-02-17 | 13F | Quadrature Capital Ltd | 13.556 | 138,91 | 1.277 | 151,18 | ||||
| 2026-01-14 | 13F | Exchange Traded Concepts, Llc | 2.707 | -9,16 | 255 | -4,87 | ||||
| 2026-02-13 | 13F | SRS Capital Advisors, Inc. | 108 | 0,93 | 10 | 11,11 | ||||
| 2026-01-26 | 13F | Mirae Asset Global Investments Co., Ltd. | 5.260 | 60,22 | 495 | 68,37 | ||||
| 2026-02-12 | 13F | IFC & Insurance Marketing, Inc. | 64 | 0 | ||||||
| 2026-02-17 | 13F | Susquehanna International Group, Llp | 0 | -100,00 | 0 | |||||
| 2026-02-24 | 13F | Bell Investment Advisors, Inc | 126 | 0,00 | 12 | 0,00 | ||||
| 2026-01-15 | 13F | Founders Capital Management | 900 | 0,00 | 85 | 5,00 | ||||
| 2026-02-17 | 13F | Northern Trust Corp | 9.499 | -0,44 | 895 | 4,44 | ||||
| 2026-02-13 | 13F | Commerce Bank | 2.360 | 0,00 | 222 | 5,21 | ||||
| 2026-02-17 | 13F | Voloridge Investment Management, Llc | 36.790 | -23,11 | 3.465 | -19,39 | ||||
| 2026-02-10 | 13F | State of Wyoming | 4.297 | -21,50 | 405 | -17,72 | ||||
| 2026-02-13 | 13F | Aigen Investment Management, Lp | 0 | -100,00 | 0 | |||||
| 2026-02-17 | 13F | Bank Of America Corp /de/ | 33.300 | -51,93 | 3.136 | -49,59 | ||||
| 2026-02-13 | 13F | Kestra Advisory Services, LLC | 452 | 43 | ||||||
| 2026-02-17 | 13F | Aquatic Capital Management LLC | 8.169 | 51,56 | 769 | 58,88 | ||||
| 2025-10-23 | 13F | Spire Wealth Management | 0 | -100,00 | 0 | |||||
| 2026-02-17 | 13F | CastleKnight Management LP | 5.100 | 0,00 | 480 | 4,80 | ||||
| 2026-02-13 | 13F | Arrowstreet Capital, Limited Partnership | 72.153 | -55,25 | 6.795 | -53,07 | ||||
| 2026-02-13 | 13F | Marshall Wace, Llp | 13.644 | 1.285 | ||||||
| 2026-02-12 | 13F | CIBC Private Wealth Group, LLC | 271 | -33,25 | 26 | -30,56 | ||||
| 2026-01-27 | 13F | TD Waterhouse Canada Inc. | 0 | -100,00 | 0 | -100,00 | ||||
| 2026-02-17 | 13F | Equitable Holdings, Inc. | 3.125 | 294 | ||||||
| 2026-02-06 | 13F | Hi-Line Capital Management, LLC | 60.179 | 5,33 | 5.668 | 10,45 | ||||
| 2026-02-17 | 13F | Balyasny Asset Management Llc | 4.996 | -71,26 | 471 | -69,89 | ||||
| 2026-01-09 | 13F | SG Americas Securities, LLC | 0 | -100,00 | 0 | |||||
| 2026-02-12 | 13F | Federation des caisses Desjardins du Quebec | 330 | 0,00 | 31 | 6,90 | ||||
| 2026-02-09 | 13F | Legal & General Group Plc | 0 | -100,00 | 0 | |||||
| 2026-02-05 | 13F | Tucker Asset Management Llc | 23 | 2 | ||||||
| 2026-01-20 | 13F | Signaturefd, Llc | 975 | 10,17 | 92 | 15,19 | ||||
| 2026-02-10 | 13F | Bnp Paribas Arbitrage, Sa | 48.724 | -7,13 | 4.589 | -2,61 | ||||
| 2026-02-13 | 13F | Morgan Dempsey Capital Management Llc | 4.562 | 0,00 | 430 | 4,89 | ||||
| 2026-01-30 | 13F | R Squared Ltd | 2.824 | 12,02 | 266 | 17,26 | ||||
| 2025-10-16 | 13F | Kingstone Capital Partners Texas, LLC | 0 | -100,00 | 0 | -100,00 | ||||
| 2026-02-06 | 13F | Midwest Professional Planners, LTD. | 5.166 | 487 | ||||||
| 2026-02-12 | 13F | New York State Common Retirement Fund | 13.460 | 211,57 | 1.268 | 227,39 | ||||
| 2026-02-13 | 13F | Dynamic Technology Lab Private Ltd | 3.730 | -58,98 | 351 | -57,04 | ||||
| 2025-11-14 | 13F | Point72 Europe (London) LLP | 2 | 0 | ||||||
| 2026-01-27 | 13F | PFG Advisors | 9.275 | 21,43 | 874 | 27,45 | ||||
| 2026-02-13 | 13F | Morgan Stanley | 159.431 | -10,38 | 15.015 | -6,02 | ||||
| 2026-02-17 | 13F | No Street GP LP | 250.000 | 0,00 | 23.545 | 4,87 | ||||
| 2026-02-17 | 13F | Lazard Asset Management Llc | 5.161 | -81,76 | 486 | -80,87 | ||||
| 2026-01-27 | 13F | Clark Asset Management, LLC | 2.181 | 205 | ||||||
| 2026-01-21 | 13F | Indiana Trust & Investment Management CO | 100 | 0,00 | 9 | 12,50 | ||||
| 2026-02-06 | 13F | Leonteq Securities AG | 200 | 0,00 | 19 | 5,88 | ||||
| 2026-01-23 | 13F | Farther Finance Advisors, LLC | 779 | 164,97 | 73 | 180,77 | ||||
| 2026-02-13 | 13F | Parkside Financial Bank & Trust | 20 | 0,00 | 2 | 0,00 | ||||
| 2026-02-13 | 13F | National Bank Of Canada /fi/ | 3.661 | -4,11 | 344 | 0,88 | ||||
| 2026-01-21 | 13F | Westfuller Advisors, LLC | 70 | 0,00 | 7 | 0,00 | ||||
| 2026-02-12 | 13F | Groupe la Francaise | 0 | -100,00 | 0 | |||||
| 2026-02-17 | 13F | Two Sigma Advisers, Lp | 44.000 | 81,82 | 4.144 | 90,66 | ||||
| 2026-02-18 | 13F | GWM Advisors LLC | 2.551 | -0,35 | 240 | 4,80 | ||||
| 2025-11-13 | 13F | Chesapeake Capital Corp /il/ | 0 | -100,00 | 0 | |||||
| 2026-01-28 | 13F | U S Global Investors Inc | 2.169 | 204 | ||||||
| 2026-02-12 | 13F | Intesa Sanpaolo Wealth Management | 935 | 88 | ||||||
| 2026-02-05 | 13F | Allworth Financial LP | 1.111 | -27,48 | 105 | -24,09 | ||||
| 2026-02-12 | 13F | Campbell & CO Investment Adviser LLC | 5.971 | 109,00 | 562 | 119,53 | ||||
| 2026-02-10 | 13F | Acadian Asset Management Llc | 513.509 | 31,74 | 48 | 41,18 | ||||
| 2026-02-09 | 13F | Smithfield Trust Co | 160 | 0,00 | 0 | |||||
| 2026-03-12 | 13F/A | Peak6 Llc | Call | 12.000 | 1.130 | |||||
| 2026-02-11 | 13F | Simplex Trading, Llc | Put | 1.100 | -84,29 | 104 | ||||
| 2026-01-30 | 13F | Us Bancorp \de\ | 18 | -75,68 | 2 | -83,33 | ||||
| 2026-02-11 | 13F | Simplex Trading, Llc | 3.010 | -56,05 | 283 | |||||
| 2026-02-13 | 13F | Quarry LP | 0 | -100,00 | 0 | |||||
| 2026-02-17 | 13F | Aqr Capital Management Llc | 18.240 | -7,93 | 1.718 | -3,49 | ||||
| 2026-02-13 | 13F | Centiva Capital, LP | 0 | -100,00 | 0 | |||||
| 2026-02-17 | 13F | Public Employees Retirement System Of Ohio | 10.439 | 385,76 | 983 | 409,33 | ||||
| 2026-02-11 | 13F | LPL Financial LLC | 2.497 | 1,34 | 235 | 6,33 | ||||
| 2026-02-17 | 13F | Point72 Asset Management, L.P. | 69.221 | 278,40 | 6.519 | 297,02 | ||||
| 2026-02-17 | 13F | Millennium Management Llc | 52.631 | -60,55 | 4.957 | -58,63 | ||||
| 2026-02-11 | 13F | Jpmorgan Chase & Co | 111.750 | 13,82 | 10.525 | 19,36 | ||||
| 2026-02-17 | 13F | ExodusPoint Capital Management, LP | 0 | -100,00 | 0 | -100,00 | ||||
| 2026-02-13 | 13F | Sei Investments Co | 22.220 | 43,65 | 2.093 | 50,61 | ||||
| 2026-02-06 | 13F | Larson Financial Group LLC | 7 | 1 | ||||||
| 2026-01-27 | 13F | WealthCollab, LLC | 522 | 0,00 | 49 | 6,52 | ||||
| 2026-01-29 | 13F | UMA Financial Services, Inc. | 24 | 4,35 | 2 | 0,00 | ||||
| 2026-02-17 | 13F | Boothbay Fund Management, Llc | 2.705 | 255 | ||||||
| 2026-02-06 | 13F | IFP Advisors, Inc | 61 | 10,91 | 6 | 25,00 | ||||
| 2026-02-12 | 13F | Jane Street Group, Llc | Call | 16.900 | -3,43 | 1.592 | 1,27 | |||
| 2026-02-19 | 13F | Invesco Ltd. | 0 | -100,00 | 0 | |||||
| 2026-02-13 | 13F | Mariner, LLC | 2.309 | 217 | ||||||
| 2026-02-05 | 13F | Bessemer Group Inc | 53 | 0 | ||||||
| 2026-01-14 | 13F | Redhawk Wealth Advisors, Inc. | 13.119 | -5,20 | 1.236 | -0,56 | ||||
| 2026-02-13 | 13F | Wells Fargo & Company/mn | 6.303 | -43,69 | 594 | -41,00 | ||||
| 2026-01-15 | 13F | Victory Financial Group, Llc | 5.080 | 26,62 | 478 | 32,78 | ||||
| 2026-02-12 | 13F | Hrt Financial Lp | 30.183 | -0,20 | 3 | 0,00 | ||||
| 2026-02-13 | 13F | Caitong International Asset Management Co., Ltd | 0 | -100,00 | 0 | -100,00 | ||||
| 2026-02-06 | 13F | Gsa Capital Partners Llp | 4.524 | 18,24 | 0 | |||||
| 2026-02-12 | 13F | Commonwealth Equity Services, Llc | 0 | -100,00 | 0 | -100,00 | ||||
| 2026-02-13 | 13F | Smartleaf Asset Management LLC | 166 | 16 | ||||||
| 2026-01-30 | 13F | Westhampton Capital, LLC | 4.255 | 0,00 | 401 | 4,71 | ||||
| 2025-09-29 | NP | SHPP - Pacer Industrials and Logistics ETF | 6 | -50,00 | 1 | |||||
| 2026-02-12 | 13F | Pinnacle Holdings, LLC | 607 | -2,25 | 57 | 3,64 | ||||
| 2025-11-14 | 13F | Wolverine Trading, Llc | 2.243 | -71,75 | 202 | -71,04 | ||||
| 2025-11-14 | 13F | Wolverine Trading, Llc | Call | 19.800 | 4,76 | 1.783 | 7,80 | |||
| 2026-02-13 | 13F | JustInvest LLC | 2.925 | -9,64 | 275 | -5,17 | ||||
| 2025-11-14 | 13F | Wolverine Trading, Llc | Put | 11.700 | 317,86 | 1.054 | 331,56 | |||
| 2026-01-12 | 13F | VisionPoint Advisory Group, LLC | 4.296 | -1,01 | 405 | 3,86 | ||||
| 2026-02-10 | 13F | Goldman Sachs Group Inc | 106.089 | 58,03 | 9.991 | 65,72 | ||||
| 2026-02-13 | 13F | Toroso Investments, LLC | 7.379 | -19,34 | 695 | -15,47 | ||||
| 2026-02-11 | 13F | Parallel Advisors, LLC | 879 | 2,21 | 83 | 6,49 | ||||
| 2025-11-12 | 13F | NewSquare Capital LLC | 0 | -100,00 | 0 | |||||
| 2026-01-22 | 13F | Shikiar Asset Management Inc | 6.400 | 1 | ||||||
| 2026-02-17 | 13F | Russell Investments Group, Ltd. | 25.051 | 2.354 | ||||||
| 2025-10-31 | 13F | Y-Intercept (Hong Kong) Ltd | 0 | -100,00 | 0 | |||||
| 2026-02-17 | 13F | Schonfeld Strategic Advisors LLC | 4.931 | 464 | ||||||
| 2026-02-17 | 13F | Tower Research Capital LLC (TRC) | 149 | 1.046,15 | 14 | 1.300,00 | ||||
| 2026-02-12 | 13F | Quadrant Capital Group Llc | 8.101 | -12,71 | 763 | -8,52 | ||||
| 2026-02-17 | 13F | Citadel Advisors Llc | Call | 7.600 | -46,48 | 716 | -43,92 | |||
| 2025-10-15 | 13F | Ballew Advisors, Inc | 0 | -100,00 | 0 | |||||
| 2026-02-17 | 13F | Citadel Advisors Llc | 19.700 | -16,41 | 1.855 | -12,33 | ||||
| 2026-02-17 | 13F | Citadel Advisors Llc | Put | 13.500 | -82,00 | 1.271 | -81,13 | |||
| 2025-11-14 | 13F/A | Skopos Labs, Inc. | 0 | -100,00 | 0 | -100,00 | ||||
| 2026-02-17 | 13F | Corsair Capital Management, L.p. | 12.601 | -9,99 | 1.187 | -5,65 | ||||
| 2026-02-13 | 13F | Advisory Research Inc | 39.648 | 2,38 | 3.734 | 7,36 | ||||
| 2026-02-06 | 13F | EverSource Wealth Advisors, LLC | 180 | 2,27 | 17 | 6,67 | ||||
| 2025-11-14 | 13F | Cubist Systematic Strategies, LLC | 50.811 | 117,04 | 4.563 | 126,11 | ||||
| 2026-02-13 | 13F | Cornerstone Financial Management LLC | 7 | 1 | ||||||
| 2026-02-17 | 13F | PDT Partners, LLC | 22.590 | 18,00 | 2.128 | 23,73 | ||||
| 2026-02-17 | 13F | Advisor Group Holdings, Inc. | 28.167 | -25,87 | 2.655 | -22,67 | ||||
| 2025-11-07 | 13F | Readystate Asset Management Lp | 0 | -100,00 | 0 | -100,00 | ||||
| 2026-02-13 | 13F | Marnell Management LLC | 7.119 | 670 | ||||||
| 2026-02-12 | 13F | Jane Street Group, Llc | 13.741 | -50,50 | 1.294 | -48,09 | ||||
| 2026-02-13 | 13F | Citigroup Inc | 1.300 | 7,62 | 122 | 12,96 | ||||
| 2025-11-14 | 13F | Ion Asset Management Ltd. | 394.345 | -39,73 | 35.416 | -37,24 | ||||
| 2026-02-17 | 13F | ION Fund Management Ltd | 419.815 | 39.538 | ||||||
| 2026-02-17 | 13F | Royal Bank Of Canada | 869 | 443,12 | 82 | 446,67 | ||||
| 2026-02-17 | 13F | Susquehanna International Group, Llp | Put | 18.400 | -86,00 | 1.733 | -85,32 | |||
| 2026-02-17 | 13F | Susquehanna International Group, Llp | Call | 36.800 | 6,67 | 3.466 | 11,85 | |||
| 2026-02-17 | 13F | Two Sigma Investments, Lp | 93.891 | 162,64 | 8.843 | 175,45 | ||||
| 2026-02-17 | 13F | Hartree Partners, LP | 0 | -100,00 | 0 | |||||
| 2026-02-11 | 13F | Fiera Capital Corp | 2.485 | -84,33 | 234 | -83,57 | ||||
| 2026-02-12 | 13F | Renaissance Technologies Llc | 38.600 | 123,12 | 3.635 | 134,06 | ||||
| 2026-02-13 | 13F | Resources Investment Advisors, LLC. | 0 | -100,00 | 0 | |||||
| 2026-02-17 | 13F | Raymond James Financial Inc | 56.937 | 5.362 | ||||||
| 2026-02-13 | 13F | Walleye Capital LLC | 14.421 | -34,36 | 1.358 | -31,17 | ||||
| 2026-02-02 | 13F | Wolverine Asset Management Llc | Put | 2.500 | 235 | |||||
| 2026-02-14 | 13F | Rockefeller Capital Management L.P. | 23 | 2 | ||||||
| 2026-02-12 | 13F | BlackRock, Inc. | 65.734 | 1,22 | 6.191 | 6,14 | ||||
| 2026-02-13 | 13F | Rhumbline Advisers | 53 | 0,00 | 5 | 0,00 | ||||
| 2026-02-17 | 13F | Engineers Gate Manager LP | 0 | -100,00 | 0 |
Other Listings
| DE:DVW1 | 97,85 € |