Grundlæggende statistik
| Institutionelle ejere | 127 total, 127 long only, 0 short only, 0 long/short - change of -11,11% MRQ |
| Gennemsnitlig porteføljeallokering | 0.4501 % - change of 21,38% MRQ |
| Institutionelle aktier (lange) | 2.585.493 (ex 13D/G) - change of 0,02MM shares 0,66% MRQ |
| Institutionel værdi (lang) | $ 291.901 USD ($1000) |
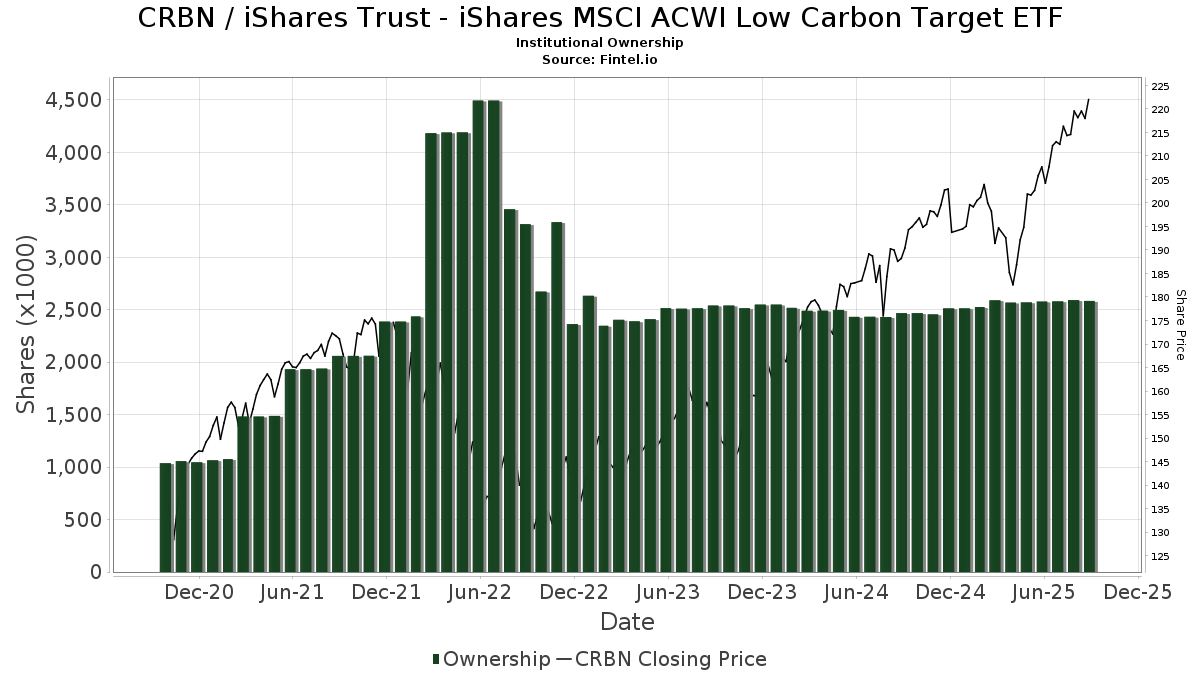
Institutionelt ejerskab og aktionærer
iShares Trust - iShares Low Carbon Optimized MSCI ACWI ETF (US:CRBN) har 127 institutionelle ejere og aktionærer, der har indsendt 13D/G- eller 13F-formularer til Securities Exchange Commission (SEC). Disse institutioner har i alt 2,585,493 aktier. Største aktionærer omfatter Betterment LLC, Morgan Stanley, Aspiriant, Llc, Allianz Se, Bank Of America Corp /de/, Investure, LLC, Jpmorgan Chase & Co, Wells Fargo & Company/mn, BSW Wealth Partners, and UBS Group AG .
iShares Trust - iShares Low Carbon Optimized MSCI ACWI ETF (ARCA:CRBN) institutionel ejerskabsstruktur viser aktuelle positioner i virksomheden efter institutioner og fonde, samt seneste ændringer i positionsstørrelse. Større aktionærer kan omfatte individuelle investorer, investeringsforeninger, hedgefonde eller institutioner. Skema 13D angiver, at investoren besidder (eller besidder) mere end 5 % af virksomheden og har til hensigt (eller har til hensigt at) aktivt at forfølge en ændring i forretningsstrategi. Skema 13G indikerer en passiv investering på over 5%.
The share price as of March 6, 2026 is 229,38 / share. Previously, on March 7, 2025, the share price was 196,41 / share. This represents an increase of 16,79% over that period.
Fondens stemningsscore
Fund Sentiment Score (fka Ownership Accumulation Score) finder de aktier, der bliver mest købt af fonde. Det er resultatet af en sofistikeret, multi-faktor kvantitativ model, der identificerer virksomheder med de højeste niveauer af institutionel akkumulering. Scoringsmodellen bruger en kombination af den samlede stigning i oplyste ejere, ændringerne i porteføljeallokeringer i disse ejere og andre målinger. Tallet går fra 0 til 100, hvor højere tal indikerer et højere niveau af akkumulering for sine jævnaldrende, og 50 er gennemsnittet.
Opdateringsfrekvens: Dagligt
Se Ownership Explorer, som giver en liste over højest rangerende virksomheder.
AI+ Ask Fintel’s AI assistant about iShares Trust - iShares Low Carbon Optimized MSCI ACWI ETF.
Select a question to share a public post with an AI-crafted answer.
Thinking of good questions…
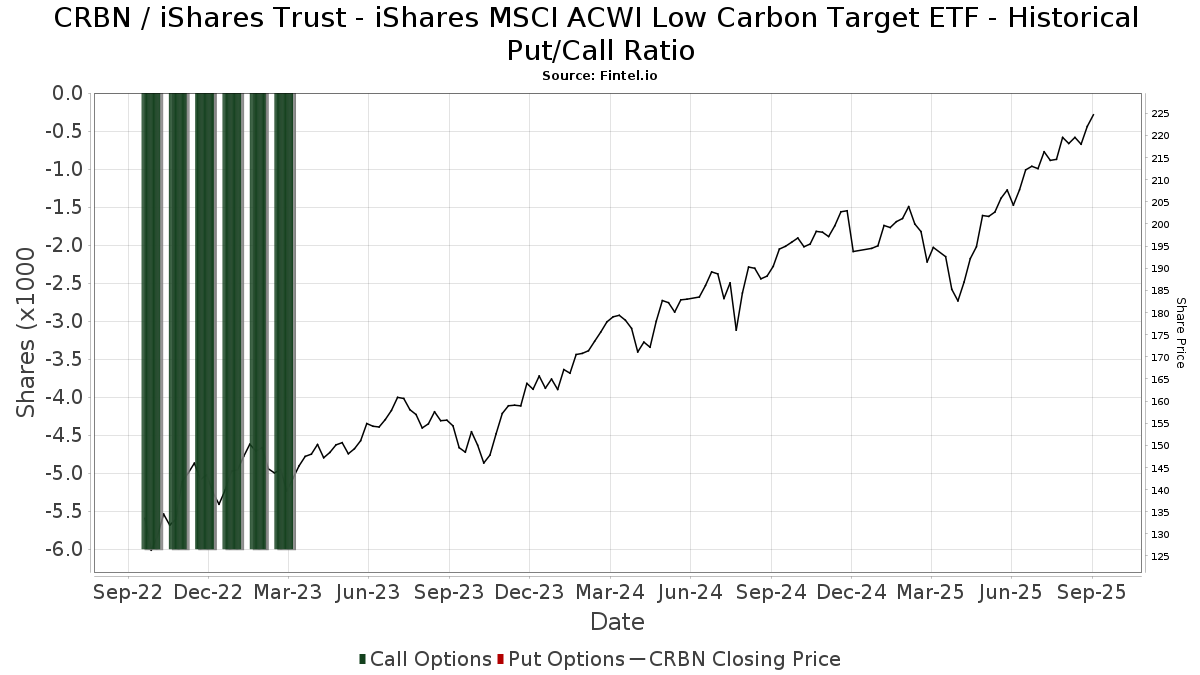
Institutionel Put/Call-forhold
Ud over at indberette standardaktie- og gældsudstedelser skal institutter med mere end 100 mill. aktiver under forvaltning også oplyse deres put- og call-optionsbeholdninger. Da salgsoptioner generelt indikerer negativ stemning, og købsoptioner indikerer positiv stemning, kan vi få en fornemmelse af den overordnede institutionelle stemning ved at plotte forholdet mellem put og kald. Diagrammet til højre viser det historiske put/call-forhold for dette instrument.
Brug af Put/Call Ratio som en indikator for investorernes stemning overvinder en af de vigtigste mangler ved at bruge totalt institutionelt ejerskab, som er, at en betydelig mængde af aktiver under forvaltning investeres passivt for at spore indekser. Passivt forvaltede fonde køber typisk ikke optioner, så indikatoren for put/call-forholdet følger mere nøje følelsen af aktivt forvaltede fonde.
13F og NPORT arkivering
Detaljer om 13F-arkivering er gratis. Detaljer om NP-ansøgninger kræver et premium-medlemskab. Grønne rækker angiver nye positioner. Røde rækker angiver lukkede positioner. Klik på linket ikon for at se den fulde transaktionshistorik.
Opgrader
for at låse premium-data op og eksportere til Excel ![]() .
.
| Fil dato | Kilde | Investor | Type | Gennemsnitlig pris (Øst) |
Aktier | Δ Aktier (%) |
Rapporteret Værdi ($1000) |
Δ Værdi (%) |
Port Alloc (%) |
|
|---|---|---|---|---|---|---|---|---|---|---|
| 2025-11-14 | 13F | Wiley Bros.-aintree Capital, Llc | 0 | -100,00 | 0 | |||||
| 2025-11-14 | 13F | SRS Capital Advisors, Inc. | 0 | -100,00 | 0 | -100,00 | ||||
| 2026-02-05 | 13F | Bessemer Group Inc | 275 | 0,00 | 0 | |||||
| 2026-02-13 | 13F | AlTi Global, Inc. | 23.200 | 23,03 | 5.348 | 25,01 | ||||
| 2026-02-02 | 13F | Miracle Mile Advisors, LLC | 3.386 | -2,51 | 781 | -1,02 | ||||
| 2026-02-04 | 13F | Community Bank, N.A. | 17 | 0,00 | 4 | 0,00 | ||||
| 2026-02-17 | 13F | United Capital Financial Advisers, Llc | 1.875 | 0,54 | 432 | 2,13 | ||||
| 2026-02-09 | 13F | Hartland & Co., LLC | 1.971 | 0,00 | 454 | 1,57 | ||||
| 2025-11-13 | 13F | Glenmede Investment Management, LP | 1.417 | -1,60 | 321 | 5,25 | ||||
| 2026-01-16 | 13F | Crewe Advisors LLC | 29 | 0,00 | 7 | 0,00 | ||||
| 2026-01-23 | 13F | Transcend Wealth Collective, Llc | 0 | -100,00 | 0 | |||||
| 2026-01-29 | 13F | Financial Life Planners | 0 | -100,00 | 0 | |||||
| 2026-02-11 | 13F | Cerity Partners LLC | 1.529 | 28,92 | 352 | 30,86 | ||||
| 2026-01-23 | 13F | Patten Group, Inc. | 1.897 | -2,47 | 437 | -0,91 | ||||
| 2026-01-21 | 13F | Westfuller Advisors, LLC | 17 | 0,00 | 4 | 0,00 | ||||
| 2026-02-11 | 13F | TruNorth Capital Management, LLC | 1.300 | 0,00 | 300 | 1,70 | ||||
| 2026-02-17 | 13F | Jones Financial Companies Lllp | 6.918 | 7,17 | 1.595 | 9,86 | ||||
| 2026-02-17 | 13F | Glenmede Trust Co Na | 1.417 | -1,60 | 327 | 18,55 | ||||
| 2026-02-13 | 13F | Citigroup Inc | 0 | -100,00 | 0 | |||||
| 2026-01-29 | 13F | Comerica Bank | 974 | -2,01 | 225 | -0,44 | ||||
| 2026-01-27 | 13F | Brighton Jones Llc | 0 | -100,00 | 0 | |||||
| 2026-02-13 | 13F | MAI Capital Management | 54 | -35,71 | 12 | -33,33 | ||||
| 2026-01-26 | 13F | Nottingham Advisors, Inc. | 0 | -100,00 | 0 | |||||
| 2026-02-13 | 13F | Flow Traders U.s. Llc | 0 | -100,00 | 0 | -100,00 | ||||
| 2025-11-05 | 13F | Concord Wealth Partners | 0 | -100,00 | 0 | |||||
| 2026-01-30 | 13F | Wealthfront Advisers Llc | 14.112 | 3,46 | 3.253 | 5,14 | ||||
| 2026-02-12 | 13F | Rossby Financial, LCC | 18 | 0,00 | 4 | 0,00 | ||||
| 2026-02-12 | 13F | Bank Of Montreal /can/ | 617 | 0,00 | 142 | 2,16 | ||||
| 2026-01-23 | 13F | Halbert Hargrove Global Advisors, Llc | 1.438 | -0,76 | 331 | 0,91 | ||||
| 2026-02-13 | 13F | Resources Management Corp /ct/ /adv | 0 | -100,00 | 0 | |||||
| 2026-02-13 | 13F | Ally Invest Advisors Inc. | 3.716 | 0,38 | 857 | 2,03 | ||||
| 2026-02-13 | 13F | Allianz Se | 109.015 | 6,34 | 25.131 | 8,06 | ||||
| 2026-01-20 | 13F | AdvisorNet Financial, Inc | 727 | 2,97 | 168 | 4,38 | ||||
| 2026-02-17 | 13F | Raymond James Financial Inc | 8.599 | 111,59 | 1.982 | 115,20 | ||||
| 2026-02-13 | 13F | Morgan Stanley | 208.394 | 1,95 | 48.041 | 3,59 | ||||
| 2026-01-23 | 13F | BSW Wealth Partners | 39.542 | 31,29 | 9.116 | 33,40 | ||||
| 2026-02-10 | 13F | Envestnet Asset Management Inc | 9.306 | 2,01 | 2.145 | 3,67 | ||||
| 2026-01-12 | 13F | Howard Financial Services, Ltd. | 907 | -12,62 | 209 | -11,06 | ||||
| 2026-01-20 | 13F | Relyea Zuckerberg Hanson LLC | 1.961 | 1,19 | 452 | 2,96 | ||||
| 2026-02-12 | 13F | Federation des caisses Desjardins du Quebec | 60 | 0,00 | 14 | 0,00 | ||||
| 2026-02-06 | 13F | HighTower Advisors, LLC | 4.970 | -1,97 | 1.146 | -0,43 | ||||
| 2026-02-17 | 13F | California State Teachers Retirement System | 523 | 0,00 | 121 | 1,69 | ||||
| 2026-02-17 | 13F | Susquehanna International Group, Llp | 26.983 | -25,38 | 6.220 | -24,17 | ||||
| 2025-10-31 | 13F | Modera Wealth Management, LLC | 0 | -100,00 | 0 | |||||
| 2026-01-14 | 13F | Wolff Wiese Magana Llc | 11 | 10,00 | 3 | 0,00 | ||||
| 2026-02-12 | 13F | CIBC Private Wealth Group, LLC | 0 | -100,00 | 0 | |||||
| 2026-01-30 | 13F | Archer Investment Corp | 21 | 0,00 | 5 | 0,00 | ||||
| 2026-02-17 | 13F | Ameriprise Financial Inc | 24.716 | -0,94 | 5.707 | 0,81 | ||||
| 2026-01-29 | 13F | Nbc Securities, Inc. | 262 | 0,00 | 60 | 1,69 | ||||
| 2026-02-13 | 13F | Barclays Plc | 0 | -100,00 | 0 | |||||
| 2026-02-04 | 13F | Mascoma Wealth Management LLC | 10 | 0,00 | 2 | 0,00 | ||||
| 2026-02-11 | 13F | Prudential Plc | 1.700 | 0,00 | 392 | 1,56 | ||||
| 2026-02-09 | 13F | Harbour Investments, Inc. | 542 | 1.907,41 | 125 | 1.983,33 | ||||
| 2026-01-26 | 13F | Whittier Trust Co Of Nevada Inc | 391 | 0,00 | 92 | 2,25 | ||||
| 2026-01-14 | 13F | Kraft, Davis & Associates, LLC | 931 | 0,00 | 219 | 2,82 | ||||
| 2026-02-11 | 13F | Simplex Trading, Llc | 0 | -100,00 | 0 | |||||
| 2026-02-13 | 13F | Wells Fargo & Company/mn | 48.123 | 8,93 | 11.094 | 10,69 | ||||
| 2026-01-06 | 13F | Investors Research Corp | 362 | 0,00 | 83 | 1,22 | ||||
| 2026-02-10 | 13F | Meramec Financial Planners, LLC | 441 | 105 | ||||||
| 2026-01-21 | 13F | Albion Financial Group /ut | 7.283 | -8,38 | 1.679 | -6,93 | ||||
| 2026-02-17 | 13F | Fmr Llc | 3.979 | 5,35 | 917 | 7,13 | ||||
| 2026-02-06 | 13F | Midwest Financial Partners Investments, Inc. | 10.989 | 2.533 | ||||||
| 2026-02-13 | 13F | Gould Asset Management Llc /ca/ | 9.410 | -1,16 | 2.169 | 0,46 | ||||
| 2026-02-11 | 13F | LPL Financial LLC | 15.699 | -1,94 | 3.619 | -0,36 | ||||
| 2025-11-05 | 13F | Plante Moran Financial Advisors, LLC | 0 | -100,00 | 0 | |||||
| 2026-02-17 | 13F | Citadel Advisors Llc | 0 | -100,00 | 0 | |||||
| 2026-02-12 | 13F | Betterment LLC | 1.303.736 | 0,89 | 301 | 2,39 | ||||
| 2026-01-29 | 13F | Dunhill Financial, LLC | 15 | 0,00 | 3 | 0,00 | ||||
| 2026-01-26 | 13F | Harbor Asset Planning, Inc. | 101 | 1,00 | 23 | 4,55 | ||||
| 2026-02-12 | 13F | BlackRock, Inc. | 20.973 | 64,35 | 4.835 | 66,98 | ||||
| 2026-02-13 | 13F | Kestra Advisory Services, LLC | 0 | -100,00 | 0 | |||||
| 2026-01-23 | 13F | Assetmark, Inc | 165 | 38 | ||||||
| 2026-02-13 | 13F | Ubs Asset Management Americas Inc | 1.300 | 300 | ||||||
| 2025-10-30 | 13F | Twin Peaks Wealth Advisors, LLC | 0 | -100,00 | 0 | |||||
| 2026-02-17 | 13F | Signature Equity Partners, LLC | 132 | 30 | ||||||
| 2026-02-13 | 13F | Plum Street Advisors, LLC | 4.724 | -3,53 | 1.089 | -1,89 | ||||
| 2026-02-12 | 13F | Jane Street Group, Llc | 0 | -100,00 | 0 | |||||
| 2026-02-13 | 13F | Parkside Financial Bank & Trust | 760 | 0,00 | 175 | 1,74 | ||||
| 2026-01-23 | 13F | Financial Connections Group, Inc. | 0 | -100,00 | 0 | |||||
| 2026-01-23 | 13F | Ritholtz Wealth Management | 3.299 | -1,90 | 761 | -0,39 | ||||
| 2026-01-27 | 13F | Belpointe Asset Management LLC | 1.833 | 0,00 | 423 | 1,69 | ||||
| 2026-02-02 | 13F | CX Institutional | 50 | 2,04 | 0 | |||||
| 2025-10-28 | 13F | BRYN MAWR TRUST Co | 225 | 0,00 | 51 | 8,51 | ||||
| 2026-01-29 | 13F | Dougherty Wealth Advisers LLC | 682 | -2,01 | 157 | 0,00 | ||||
| 2026-02-17 | 13F | Royal Bank Of Canada | 21.070 | 85,41 | 4.857 | 88,40 | ||||
| 2026-01-20 | 13F | Aspiriant, Llc | 116.572 | 1,66 | 26.873 | 3,31 | ||||
| 2026-01-29 | 13F | University of Maryland Foundation, Inc. | 10.000 | 0,00 | 2 | 0,00 | ||||
| 2026-02-13 | 13F | KilterHowling LLC | 1.258 | -4,04 | 290 | -2,69 | ||||
| 2026-02-13 | 13F | Golden State Wealth Management, LLC | 1.892 | 11,23 | 436 | 13,25 | ||||
| 2026-01-27 | 13F | Retirement Income Solutions, Inc | 0 | -100,00 | 0 | |||||
| 2026-02-06 | 13F | Global Retirement Partners, LLC | 2 | 0,00 | 0 | |||||
| 2026-01-27 | 13F | Proffitt & Goodson Inc | 391 | 0,51 | 90 | 2,27 | ||||
| 2026-02-05 | 13F | Rossmore Private Capital | 0 | -100,00 | 0 | |||||
| 2026-02-13 | 13F | Mml Investors Services, Llc | 2.200 | -7,52 | 507 | -5,94 | ||||
| 2026-02-14 | 13F | Rockefeller Capital Management L.P. | 4.689 | 50,05 | 1.081 | 52,47 | ||||
| 2026-01-14 | 13F | Bond & Devick Financial Network, Inc. | 5.137 | -0,54 | 1.184 | 1,11 | ||||
| 2026-02-12 | 13F | Wealthspire Advisors, LLC | 0 | -100,00 | 0 | |||||
| 2026-02-13 | 13F | Creekside Partners | 915 | 0,99 | 211 | 2,44 | ||||
| 2026-01-22 | 13F | Bartlett & Co. Wealth Management Llc | 440 | 0,00 | 101 | 2,02 | ||||
| 2026-01-30 | 13F | Camden Capital, LLC | 1.743 | -17,28 | 402 | -16,11 | ||||
| 2026-02-02 | 13F | Long Run Wealth Advisors, LLC | 4.553 | 0,29 | 1.050 | 1,94 | ||||
| 2026-02-06 | 13F | Van Hulzen Asset Management, LLC | 11.757 | 39,73 | 2.710 | 42,03 | ||||
| 2025-11-10 | 13F | Longview Financial Advisors LLC | 0 | -100,00 | 0 | |||||
| 2026-02-10 | 13F/A | Northwestern Mutual Wealth Management Co | 2.285 | -8,71 | 527 | -7,23 | ||||
| 2025-11-10 | 13F | Choate Investment Advisors | 0 | -100,00 | 0 | |||||
| 2026-02-11 | 13F | Investure, LLC | 104.151 | 24.010 | ||||||
| 2026-01-29 | 13F | 4Thought Financial Group Inc. | 57 | 1,79 | 13 | 8,33 | ||||
| 2026-02-17 | 13F | Bank Of America Corp /de/ | 105.790 | -2,91 | 24.388 | -1,35 | ||||
| 2026-02-05 | 13F | Td Private Client Wealth Llc | 2.217 | -3,52 | 511 | -1,92 | ||||
| 2026-02-09 | 13F | Huntington National Bank | 0 | |||||||
| 2026-01-29 | 13F | UMA Financial Services, Inc. | 161 | 1,26 | 37 | 2,78 | ||||
| 2026-01-23 | 13F | Financial Futures Ltd Liability Co. | 1.313 | 12,22 | 303 | 13,96 | ||||
| 2026-02-11 | 13F | Jpmorgan Chase & Co | 62.162 | -6,72 | 14.330 | -5,22 | ||||
| 2026-01-29 | 13F | UBS Group AG | 37.280 | -5,96 | 8.594 | -4,44 | ||||
| 2026-01-08 | 13F | Gradient Investments LLC | 7.942 | 5,60 | 1.831 | 7,27 | ||||
| 2026-02-17 | 13F | Northern Trust Corp | 4.995 | 0,00 | 1.151 | 1,59 | ||||
| 2026-02-20 | 13F | Kovitz Investment Group Partners, LLC | 0 | -100,00 | 0 | |||||
| 2026-02-17 | 13F | Laird Norton Trust Company, Llc | 2.008 | 463 | ||||||
| 2025-11-07 | 13F | Morris Retirement Advisors, LLC | 0 | -100,00 | 0 | |||||
| 2026-02-12 | 13F | Steward Partners Investment Advisory, Llc | 5.163 | 0,00 | 1.190 | 1,62 | ||||
| 2026-02-13 | 13F | Colony Group, LLC | 3.047 | 90,80 | 702 | 93,92 | ||||
| 2026-02-10 | 13F | Goldman Sachs Group Inc | 971 | 224 | ||||||
| 2026-02-17 | 13F | Creative Planning | 8.743 | 4,42 | 2.015 | 6,11 | ||||
| 2026-02-09 | 13F | Cary Street Partners Financial Llc | 1.617 | 373 | ||||||
| 2026-02-05 | 13F | Cambridge Investment Research Advisors, Inc. | 6.023 | 13,24 | 1 | 0,00 | ||||
| 2026-02-12 | 13F | Front Row Advisors LLC | 45 | 0,00 | 10 | 0,00 | ||||
| 2026-01-23 | 13F | Farther Finance Advisors, LLC | 1.998 | 18,72 | 461 | 20,73 | ||||
| 2026-02-17 | 13F | Advisor Group Holdings, Inc. | 11.103 | 92,09 | 2.560 | 101,97 | ||||
| 2026-01-13 | 13F | Stonehearth Capital Management, LLC | 15.041 | -0,55 | 3.467 | 1,05 | ||||
| 2026-01-30 | 13F | Us Bancorp \de\ | 960 | 0,00 | 221 | 1,84 | ||||
| 2026-02-12 | 13F | Commonwealth Equity Services, Llc | 3.460 | 5,58 | 798 | |||||
| 2026-02-17 | 13F | Mercer Global Advisors Inc /adv | 8.695 | 2,77 | 2.004 | 4,43 | ||||
| 2026-01-27 | 13F | Evergreen Capital Management Llc | 3.566 | 0,00 | 822 | 1,61 | ||||
| 2026-02-17 | 13F | Cetera Investment Advisers | 4.328 | -2,61 | 998 | -1,09 | ||||
| 2026-02-04 | 13F | Ameritas Advisory Services, LLC | 878 | 202 | ||||||
| 2026-02-13 | 13F | Smartleaf Asset Management LLC | 2.181 | -6,91 | 506 | -4,35 | ||||
| 2026-02-10 | 13F | North Berkeley Wealth Management, LLC | 3.382 | -5,05 | 780 | -3,59 | ||||
| 2026-01-23 | 13F | Westside Investment Management, Inc. | 300 | 0,00 | 69 | 1,47 | ||||
| 2026-02-10 | 13F | Root Financial Partners, LLC | 0 | -100,00 | 0 | |||||
| 2026-02-17 | 13F | Widmann Financial Services, Inc. | 1.145 | 3,15 | 264 | 4,78 | ||||
| 2026-02-17 | 13F | Aqr Capital Management Llc | 7.344 | 0,00 | 1.693 | 1,62 | ||||
| 2026-02-11 | 13F | Ackerman Capital Advisors, LLC | 2.849 | 0,00 | 657 | 1,55 | ||||
| 2026-02-11 | 13F | Mandatum Life Insurance Co Ltd | 925 | 0,00 | 213 | 1,91 | ||||
| 2026-01-26 | 13F | Merit Financial Group, LLC | 1.303 | -1,73 | 300 | 0,00 | ||||
| 2026-02-06 | 13F | Pnc Financial Services Group, Inc. | 309 | 0,98 | 71 | 2,90 | ||||
| 2026-02-09 | 13F | Coldstream Capital Management Inc | 18.105 | -0,20 | 4.174 | 1,41 | ||||
| 2026-01-15 | 13F | Bernard Wealth Management Corp. | 7 | 0,00 | 2 | 0,00 | ||||
| 2025-10-14 | 13F | Dohj, Llc | 0 | -100,00 | 0 | |||||
| 2026-02-13 | 13F | Baird Financial Group, Inc. | 2.643 | 3,53 | 609 | 5,18 | ||||
| 2026-02-06 | 13F | IFP Advisors, Inc | 0 | -100,00 | 0 | -100,00 | ||||
| 2026-02-06 | 13F | Larson Financial Group LLC | 114 | 0,88 | 26 | 4,00 | ||||
| 2026-02-18 | 13F | EP Wealth Advisors, Inc. | 1.194 | -13,10 | 275 | -5,50 | ||||
| 2026-02-10 | 13F | One Capital Management, LLC | 1.374 | 14,98 | 317 | 16,61 | ||||
| 2026-01-15 | 13F | Westmount Partners, LLC | 4.208 | 3,49 | 970 | 4,75 | ||||
| 2026-02-05 | 13F | Cardinal Point Capital Management, ULC | 6.998 | -1,19 | 1.613 | 0,81 | ||||
| 2026-02-17 | 13F | Advisory Services Network, LLC | 0 | -100,00 | 0 | |||||
| 2026-01-28 | 13F | Migdal Insurance & Financial Holdings Ltd. | 40 | 0 | ||||||
| 2026-02-06 | 13F | GPS Wealth Strategies Group, LLC | 0 | -100,00 | 0 | |||||
| 2026-02-13 | 13F | National Bank Of Canada /fi/ | 0 | -100,00 | 0 | |||||
| 2026-01-26 | 13F | Cwm, Llc | 297 | 0,00 | 0 | |||||
| 2026-01-28 | 13F | Geneos Wealth Management Inc. | 2.128 | 0,00 | 490 | 1,66 |