Grundlæggende statistik
| Institutionelle aktier (lange) | 226.476.026 - 46,79% (ex 13D/G) - change of -12,95MM shares -5,41% MRQ |
| Institutionel værdi (lang) | $ 12.113.457 USD ($1000) |
Institutionelt ejerskab og aktionærer
Cheniere Energy Partners, L.P. - Limited Partnership (US:CQP) har 183 institutionelle ejere og aktionærer, der har indsendt 13D/G- eller 13F-formularer til Securities Exchange Commission (SEC). Disse institutioner har i alt 226,476,026 aktier. Største aktionærer omfatter Blackstone Group Inc, Brookfield Asset Management Inc., Alps Advisors Inc, MIRAE ASSET GLOBAL ETFS HOLDINGS Ltd., Energy Income Partners, LLC, Goldman Sachs Group Inc, Tortoise Capital Advisors, L.l.c., Morgan Stanley, Jpmorgan Chase & Co, and Clearbridge Investments, LLC .
Cheniere Energy Partners, L.P. - Limited Partnership (NYSE:CQP) institutionel ejerskabsstruktur viser aktuelle positioner i virksomheden efter institutioner og fonde, samt seneste ændringer i positionsstørrelse. Større aktionærer kan omfatte individuelle investorer, investeringsforeninger, hedgefonde eller institutioner. Skema 13D angiver, at investoren besidder (eller besidder) mere end 5 % af virksomheden og har til hensigt (eller har til hensigt at) aktivt at forfølge en ændring i forretningsstrategi. Skema 13G indikerer en passiv investering på over 5%.
The share price as of March 30, 2026 is 67,12 / share. Previously, on March 31, 2025, the share price was 66,04 / share. This represents an increase of 1,64% over that period.

Fondens stemningsscore
Fund Sentiment Score (fka Ownership Accumulation Score) finder de aktier, der bliver mest købt af fonde. Det er resultatet af en sofistikeret, multi-faktor kvantitativ model, der identificerer virksomheder med de højeste niveauer af institutionel akkumulering. Scoringsmodellen bruger en kombination af den samlede stigning i oplyste ejere, ændringerne i porteføljeallokeringer i disse ejere og andre målinger. Tallet går fra 0 til 100, hvor højere tal indikerer et højere niveau af akkumulering for sine jævnaldrende, og 50 er gennemsnittet.
Opdateringsfrekvens: Dagligt
Se Ownership Explorer, som giver en liste over højest rangerende virksomheder.
AI+ Ask Fintel’s AI assistant about Cheniere Energy Partners, L.P. - Limited Partnership.
Select a question to share a public post with an AI-crafted answer.
Thinking of good questions…
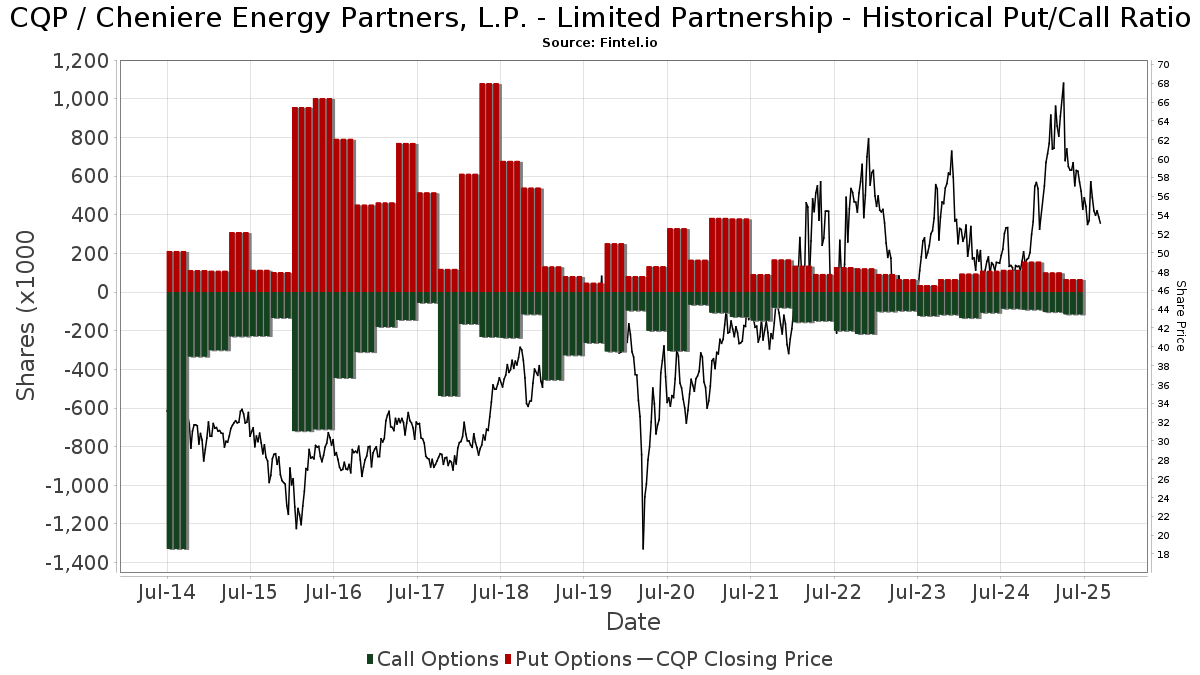
Institutionel Put/Call-forhold
Ud over at indberette standardaktie- og gældsudstedelser skal institutter med mere end 100 mill. aktiver under forvaltning også oplyse deres put- og call-optionsbeholdninger. Da salgsoptioner generelt indikerer negativ stemning, og købsoptioner indikerer positiv stemning, kan vi få en fornemmelse af den overordnede institutionelle stemning ved at plotte forholdet mellem put og kald. Diagrammet til højre viser det historiske put/call-forhold for dette instrument.
Brug af Put/Call Ratio som en indikator for investorernes stemning overvinder en af de vigtigste mangler ved at bruge totalt institutionelt ejerskab, som er, at en betydelig mængde af aktiver under forvaltning investeres passivt for at spore indekser. Passivt forvaltede fonde køber typisk ikke optioner, så indikatoren for put/call-forholdet følger mere nøje følelsen af aktivt forvaltede fonde.
13F og NPORT arkivering
Detaljer om 13F-arkivering er gratis. Detaljer om NP-ansøgninger kræver et premium-medlemskab. Grønne rækker angiver nye positioner. Røde rækker angiver lukkede positioner. Klik på linket ikon for at se den fulde transaktionshistorik.
Opgrader
for at låse premium-data op og eksportere til Excel ![]() .
.
| Fil dato | Kilde | Investor | Type | Gennemsnitlig pris (Øst) |
Aktier | Δ Aktier (%) |
Rapporteret Værdi ($1000) |
Δ Værdi (%) |
Port Alloc (%) |
|
|---|---|---|---|---|---|---|---|---|---|---|
| 2026-02-11 | 13F | Clearbridge Investments, LLC | 611.873 | 24,09 | 32.723 | 23,30 | ||||
| 2026-01-30 | 13F | Sigma Planning Corp | 4.219 | 1,69 | 226 | 0,90 | ||||
| 2026-02-17 | 13F | MIRAE ASSET GLOBAL ETFS HOLDINGS Ltd. | 2.753.008 | -1,15 | 147.231 | -1,77 | ||||
| 2026-01-08 | 13F | Gryphon Financial Partners LLC | 14.948 | 0,00 | 799 | -0,62 | ||||
| 2026-02-17 | 13F | Wiley Bros.-aintree Capital, Llc | 10.007 | 13,36 | 535 | 12,63 | ||||
| 2026-02-13 | 13F | Glen Eagle Advisors, LLC | 614 | 0,99 | 33 | 0,00 | ||||
| 2026-02-12 | 13F | DRW Securities, LLC | 0 | -100,00 | 0 | |||||
| 2026-01-26 | 13F | PFG Investments, LLC | 22.721 | -0,68 | 1.215 | -1,30 | ||||
| 2026-01-29 | 13F | Calamos Advisors LLC | 16.365 | 0,00 | 875 | -0,57 | ||||
| 2026-02-13 | 13F | Parkside Financial Bank & Trust | 1.053 | 0,00 | 56 | 0,00 | ||||
| 2026-01-09 | 13F | Diversified Trust Co | 6.571 | 351 | ||||||
| 2026-02-10 | 13F | Bank of New York Mellon Corp | 3.803 | -15,68 | 203 | -16,12 | ||||
| 2026-02-11 | 13F | Strategic Advocates LLC | 3 | 0,00 | 0 | |||||
| 2026-02-12 | 13F | Commonwealth Equity Services, Llc | 18.178 | 2,39 | 972 | |||||
| 2026-02-12 | 13F | BlackRock, Inc. | 11 | 0,00 | 1 | |||||
| 2026-01-14 | 13F | Spire Wealth Management | 5.613 | -5,87 | 300 | -6,25 | ||||
| 2026-02-13 | 13F | Barclays Plc | 240.996 | -63,37 | 12.888 | -59,80 | ||||
| 2026-02-11 | 13F | Prestige Wealth Management Group LLC | 200 | 0,00 | 11 | 0,00 | ||||
| 2025-11-07 | 13F | Beacon Capital Management, LLC | 0 | -100,00 | 0 | |||||
| 2026-02-12 | 13F | Brown Brothers Harriman & Co | 3.000 | 160 | ||||||
| 2026-02-03 | 13F | Bokf, Na | 0 | -100,00 | 0 | |||||
| 2026-02-17 | 13F | Bramshill Investments, LLC | 30.922 | 0,69 | 1.654 | 0,06 | ||||
| 2026-02-13 | 13F | Citigroup Inc | 410 | -2,61 | 22 | -4,55 | ||||
| 2025-11-05 | 13F | J.w. Cole Advisors, Inc. | 0 | -100,00 | 0 | |||||
| 2026-02-17 | 13F | RMB Capital Management, LLC | 12.468 | -0,10 | 667 | -0,75 | ||||
| 2026-02-17 | 13F | Mercer Global Advisors Inc /adv | 7.876 | -0,63 | 421 | -1,17 | ||||
| 2026-02-06 | 13F | Cullen/frost Bankers, Inc. | 200 | 11 | ||||||
| 2026-02-12 | 13F | Federation des caisses Desjardins du Quebec | 100 | 0,00 | 5 | 0,00 | ||||
| 2026-02-05 | 13F | Cornerstone Wealth Management, LLC | 5.659 | 0,00 | 303 | -0,66 | ||||
| 2026-01-29 | 13F | Wealth Alliance Advisory Group, LLC | 4.300 | 0,00 | 230 | -0,87 | ||||
| 2026-01-27 | 13F | Fractal Investments LLC | 194.126 | 0,00 | 10.382 | -0,63 | ||||
| 2025-11-14 | 13F | Skopos Labs, Inc. | 0 | -100,00 | 0 | |||||
| 2026-02-12 | 13F | CIBC Private Wealth Group, LLC | 0 | -100,00 | 0 | |||||
| 2026-02-17 | 13F | Captrust Financial Advisors | 8.630 | -4,52 | 462 | -5,14 | ||||
| 2026-02-13 | 13F | Colony Group, LLC | 12.938 | 692 | ||||||
| 2026-02-17 | 13F | Asset One Wealth Management LLC | 10.075 | 564 | ||||||
| 2026-02-13 | 13F | Fayez Sarofim & Co | 0 | -100,00 | 0 | |||||
| 2026-02-04 | 13F | Heronetta Management, L.P. | 5.810 | 0,00 | 311 | -0,64 | ||||
| 2026-02-12 | 13F | Dividend Asset Capital, Llc | 8.390 | -45,48 | 449 | -45,89 | ||||
| 2026-02-18 | 13F | GWM Advisors LLC | 8.487 | -3,33 | 454 | -4,03 | ||||
| 2026-01-12 | 13F | Kozak & Associates, Inc. | 215 | -66,35 | 12 | -66,67 | ||||
| 2026-01-27 | 13F | Belpointe Asset Management LLC | 5.841 | -6,90 | 312 | -7,42 | ||||
| 2026-02-13 | 13F | MorganRosel Wealth Management, LLC | 19.500 | 0,00 | 1.043 | -0,67 | ||||
| 2026-02-17 | 13F | ArrowMark Colorado Holdings LLC | 17.338 | -18,32 | 927 | -18,83 | ||||
| 2026-02-13 | 13F | Ubs Asset Management Americas Inc | 958 | 51 | ||||||
| 2026-02-27 | 13F | Compass Financial Services Inc | 0 | -100,00 | 0 | |||||
| 2026-02-02 | 13F | Montag A & Associates Inc | 801 | 0,00 | 43 | -2,33 | ||||
| 2026-02-20 | 13F | Kovitz Investment Group Partners, LLC | 0 | -100,00 | 0 | |||||
| 2026-02-17 | 13F | Jones Financial Companies Lllp | 1.452 | -1,02 | 78 | -2,53 | ||||
| 2026-01-29 | 13F | Nbc Securities, Inc. | 1.321 | -0,15 | 71 | -1,41 | ||||
| 2026-01-21 | 13F | SJS Investment Consulting Inc. | 83 | 2,47 | 4 | 0,00 | ||||
| 2026-02-17 | 13F | Blackstone Group Inc | 102.346.331 | 0,00 | 5.473.482 | -0,63 | ||||
| 2026-02-17 | 13F | Infrastructure Capital Advisors, Llc | 158.175 | -30,30 | 8.459 | -28,54 | ||||
| 2026-01-13 | 13F | CoreCap Advisors, LLC | 10 | 0,00 | 1 | |||||
| 2026-01-30 | 13F | Caldwell Trust Co | 535 | 29 | ||||||
| 2026-02-11 | 13F | Group One Trading, L.p. | Call | 200 | -93,94 | 11 | -94,35 | |||
| 2026-02-11 | 13F | Group One Trading, L.p. | Put | 1.800 | -35,71 | 96 | -36,00 | |||
| 2026-02-02 | 13F | Hussman Strategic Advisors, Inc. | 42.000 | 100,00 | 2.246 | 98,76 | ||||
| 2025-11-10 | 13F | Tableaux Llc | 0 | -100,00 | 0 | -100,00 | ||||
| 2026-02-13 | 13F | First Trust Advisors Lp | 43.511 | -9,28 | 2.327 | -9,88 | ||||
| 2026-02-17 | 13F | Bank Of America Corp /de/ | 162.975 | -32,32 | 8.716 | -32,75 | ||||
| 2026-02-05 | 13F | Cambridge Investment Research Advisors, Inc. | 19.494 | 18,04 | 1 | |||||
| 2026-02-17 | 13F | Raymond James Financial Inc | 33.219 | 2,52 | 1.777 | 1,89 | ||||
| 2026-02-17 | 13F | Virtus Investment Advisers, Inc. | 0 | -100,00 | 0 | |||||
| 2026-02-12 | 13F | Wedbush Securities Inc | 4.635 | 0,00 | 0 | |||||
| 2026-02-13 | 13F | Corps Capital Advisors, LLC | 10.452 | 0,00 | 559 | -0,71 | ||||
| 2025-10-27 | 13F | First Horizon Corp | 0 | -100,00 | 0 | |||||
| 2026-02-17 | 13F | Energy Income Partners, LLC | 1.613.522 | 54,19 | 86.291 | 53,22 | ||||
| 2025-11-17 | 13F | Castleark Management Llc | 0 | -100,00 | 0 | |||||
| 2026-02-17 | 13F | Evolve Private Wealth, Llc | 4.000 | 214 | ||||||
| 2026-02-04 | 13F | Naples Global Advisors, Llc | 19.989 | 0,00 | 1.069 | -0,56 | ||||
| 2026-02-11 | 13F | Horizon Kinetics Asset Management Llc | 4.000 | 0,00 | 214 | -0,93 | ||||
| 2026-02-17 | 13F | Quest Investment Management Llc | 5.698 | -2,01 | 305 | -2,56 | ||||
| 2026-02-02 | 13F | Truist Financial Corp | 4.283 | -80,42 | 229 | -80,54 | ||||
| 2026-01-12 | 13F | Chickasaw Capital Management Llc | 12.613 | -15,47 | 1 | |||||
| 2026-01-15 | 13F | Spirit Of America Management Corp/ny | 2.993 | 0,00 | 160 | -0,62 | ||||
| 2026-02-17 | 13F | Cetera Investment Advisers | 34.444 | -21,46 | 1.842 | -21,95 | ||||
| 2026-02-12 | 13F | JPL Wealth Management, LLC | 0 | -100,00 | 0 | |||||
| 2025-11-04 | 13F | Garrison Bradford & Associates Inc | 0 | -100,00 | 0 | |||||
| 2026-02-06 | 13F | Motco | 0 | -100,00 | 0 | |||||
| 2026-02-11 | 13F | Empowered Funds, LLC | 34.862 | 0,48 | 1.864 | -0,16 | ||||
| 2026-02-13 | 13F | Searle & Co. | 0 | -100,00 | 0 | |||||
| 2026-02-06 | 13F | Creative Financial Designs Inc /adv | 1.000 | 0,00 | 53 | 0,00 | ||||
| 2026-01-08 | 13F | Chesapeake Asset Management Llc | 1.000 | 0,00 | 53 | 0,00 | ||||
| 2026-02-06 | 13F | Harmony Asset Management Llc | 8.700 | 0,00 | 465 | -0,64 | ||||
| 2026-02-11 | 13F | Group One Trading, L.p. | 499 | 152,02 | 27 | 160,00 | ||||
| 2026-02-12 | 13F | Principal Securities, Inc. | 0 | -100,00 | 0 | |||||
| 2026-02-13 | 13F | Neuberger Berman Group LLC | 80.741 | -0,43 | 4.318 | -1,05 | ||||
| 2026-02-04 | 13F | MADDEN SECURITIES Corp | 8.900 | -46,71 | 476 | -47,10 | ||||
| 2026-02-06 | 13F | HighTower Advisors, LLC | 15.589 | -0,12 | 834 | -0,83 | ||||
| 2026-02-09 | 13F | Hartland & Co., LLC | 1.321 | -23,46 | 71 | -23,91 | ||||
| 2026-02-11 | 13F | Janney Montgomery Scott LLC | 11.236 | 1,23 | 1 | |||||
| 2026-02-20 | 13F | Sunbelt Securities, Inc. | 2.056 | -19,53 | 110 | -20,44 | ||||
| 2026-02-06 | 13F | Gables Capital Management Inc. | 600 | 0,00 | 32 | 0,00 | ||||
| 2026-02-13 | 13F | MAI Capital Management | 1.612 | 0,00 | 86 | 0,00 | ||||
| 2026-01-29 | 13F | IMC-Chicago, LLC | Call | 0 | -100,00 | 0 | ||||
| 2026-02-14 | 13F | Rockefeller Capital Management L.P. | 22.552 | 30,49 | 1.206 | 29,68 | ||||
| 2026-01-20 | 13F | Stratos Wealth Partners, LTD. | 4.759 | -9,76 | 255 | -10,25 | ||||
| 2026-02-17 | 13F | Westwood Holdings Group Inc | 11.245 | 0,00 | 601 | -0,66 | ||||
| 2026-02-11 | 13F | Cerity Partners LLC | 45.616 | 2,43 | 2.440 | 1,79 | ||||
| 2026-02-09 | 13F | Powell Investment Advisors, LLC | 17.800 | 1,55 | 952 | 0,85 | ||||
| 2026-02-17 | 13F | Blair William & Co/il | 4.600 | 0,00 | 246 | -0,40 | ||||
| 2026-02-12 | 13F | Hrt Financial Lp | 37.505 | -7,97 | 2 | 0,00 | ||||
| 2026-01-22 | 13F | Apollon Wealth Management, LLC | 9.263 | -2,29 | 495 | -2,94 | ||||
| 2026-01-28 | 13F | Geneos Wealth Management Inc. | 2.325 | 0,00 | 124 | -0,80 | ||||
| 2025-10-24 | 13F | We Are One Seven, LLC | 0 | -100,00 | 0 | -100,00 | ||||
| 2026-02-17 | 13F | Royal Bank Of Canada | 40.639 | -2,45 | 2.173 | -3,08 | ||||
| 2026-02-19 | 13F | CI Private Wealth, LLC | 6.527 | 0,00 | 349 | -0,57 | ||||
| 2026-01-23 | 13F | Farther Finance Advisors, LLC | 504 | 0,00 | 27 | -3,70 | ||||
| 2026-01-30 | 13F | Bogart Wealth, LLC | 200 | 0,00 | 11 | 0,00 | ||||
| 2025-11-07 | 13F | Gsa Capital Partners Llp | 0 | -100,00 | 0 | |||||
| 2025-11-13 | 13F | Glenmede Investment Management, LP | 41.993 | 10,53 | 2.260 | 6,15 | ||||
| 2026-01-29 | 13F | UBS Group AG | 594.594 | 5,22 | 31.799 | 4,56 | ||||
| 2026-02-13 | 13F | Wells Fargo & Company/mn | 32.714 | -27,38 | 1.750 | -27,85 | ||||
| 2026-02-11 | 13F | Jpmorgan Chase & Co | 874.268 | -10,16 | 46.756 | -10,73 | ||||
| 2026-01-08 | 13F | Armstrong Advisory Group, Inc | 200 | 0,00 | 11 | 0,00 | ||||
| 2026-02-17 | 13F | Maryland State Retirement & Pension System | 36.386 | 1,37 | 1.946 | 0,73 | ||||
| 2026-02-17 | 13F | NEOS Investment Management LLC | 20.740 | 1.109 | ||||||
| 2025-11-14 | 13F | Equitable Holdings, Inc. | 0 | -100,00 | 0 | |||||
| 2026-02-17 | 13F | Advisor Group Holdings, Inc. | 9.861 | -43,79 | 528 | -44,58 | ||||
| 2026-01-14 | 13F | Wallington Asset Management, LLC | 4.166 | 0,00 | 223 | -0,89 | ||||
| 2026-02-14 | 13F | Militia Capital Partners, LP | 14.000 | 11,11 | 2.721 | -8,07 | ||||
| 2026-02-17 | 13F | Fmr Llc | 13.890 | 0,73 | 743 | 0,00 | ||||
| 2026-02-03 | 13F | Birch Capital Management, LLC | 16.099 | 15,10 | 861 | 14,36 | ||||
| 2026-02-17 | 13F | Advisory Services Network, LLC | 0 | -100,00 | 0 | |||||
| 2026-01-27 | 13F | Miller Howard Investments Inc /ny | 103.786 | -0,70 | 5.550 | -1,33 | ||||
| 2026-02-23 | 13F | Virtu Financial LLC | 8.955 | 16,37 | 0 | |||||
| 2026-02-17 | 13F | Ameriprise Financial Inc | 3.860 | -14,07 | 206 | -14,52 | ||||
| 2025-10-30 | 13F | Ridgewood Investments LLC | 0 | -100,00 | 0 | |||||
| 2026-01-30 | 13F | Pekin Hardy Strauss, Inc. | 3.800 | 0,00 | 203 | -0,49 | ||||
| 2026-02-13 | 13F | Brookfield Asset Management Inc. | 101.620.376 | 0,00 | 5.434.658 | -0,63 | ||||
| 2026-02-06 | 13F | GPS Wealth Strategies Group, LLC | 0 | -100,00 | 0 | |||||
| 2026-02-17 | 13F | Fairview Capital Investment Management, Llc | 234.140 | -9,20 | 12.522 | -9,78 | ||||
| 2026-01-14 | 13F | Wolff Wiese Magana Llc | 0 | -100,00 | 0 | |||||
| 2026-02-10 | 13F | Envestnet Asset Management Inc | 22.279 | 53,12 | 1.191 | 52,11 | ||||
| 2025-11-06 | 13F | Ameritas Advisory Services, LLC | 0 | -100,00 | 0 | -100,00 | ||||
| 2026-02-17 | 13F | Glenmede Trust Co Na | 41.993 | 2,44 | 2.246 | -17,07 | ||||
| 2026-02-06 | 13F | Van Hulzen Asset Management, LLC | 11.668 | -4,11 | 624 | -4,59 | ||||
| 2026-01-20 | 13F | Toth Financial Advisory Corp | 835 | 0,00 | 45 | 0,00 | ||||
| 2026-02-06 | 13F | Global Retirement Partners, LLC | 1.981 | 139,54 | 106 | 138,64 | ||||
| 2026-02-17 | 13F | Susquehanna International Group, Llp | 7.037 | -78,63 | 376 | -78,78 | ||||
| 2026-02-17 | 13F | Citadel Advisors Llc | 37.717 | 14,95 | 2.017 | 14,28 | ||||
| 2026-02-17 | 13F | Citadel Advisors Llc | Call | 9.100 | -60,43 | 487 | -60,71 | |||
| 2026-02-17 | 13F | Susquehanna International Group, Llp | Put | 23.000 | -57,72 | 1.230 | -57,98 | |||
| 2026-01-23 | 13F | U.S. Capital Wealth Advisors, LLC | 18.312 | 0,08 | 979 | -0,51 | ||||
| 2026-02-17 | 13F | Susquehanna International Group, Llp | Call | 23.000 | 152,75 | 1.230 | 151,53 | |||
| 2026-02-12 | 13F | Alps Advisors Inc | 9.338.942 | 3,74 | 499.447 | 3,09 | ||||
| 2026-02-17 | 13F | Creative Planning | 3.858 | -4,72 | 206 | -5,07 | ||||
| 2026-02-10 | 13F | Linscomb & Williams, Inc. | 25.000 | 0,00 | 1.337 | -0,59 | ||||
| 2026-02-11 | 13F | Longfellow Investment Management Co Llc | 131.752 | 0,00 | 7.046 | -0,62 | ||||
| 2026-01-26 | 13F | Cwm, Llc | 14.779 | 61,43 | 1 | |||||
| 2026-02-12 | 13F | Hm Payson & Co | 300 | -68,09 | 16 | -68,00 | ||||
| 2026-02-06 | 13F | IFP Advisors, Inc | 471 | -5,80 | 25 | -3,85 | ||||
| 2026-02-10 | 13F | Bnp Paribas Arbitrage, Sa | 3.564 | 191 | ||||||
| 2026-02-06 | 13F | Larson Financial Group LLC | 300 | -40,59 | 16 | -40,74 | ||||
| 2026-02-10 | 13F | REAP Financial Group, LLC | 853 | 1,67 | 46 | 0,00 | ||||
| 2026-02-06 | 13F | Americana Partners, LLC | 12.904 | 19,16 | 690 | 18,56 | ||||
| 2026-02-13 | 13F | Integrated Wealth Concepts LLC | 0 | -100,00 | 0 | |||||
| 2026-02-17 | 13F | Citadel Advisors Llc | Put | 7.300 | -18,89 | 390 | -19,42 | |||
| 2026-01-21 | 13F | Flagship Harbor Advisors, Llc | 2.125 | 114 | ||||||
| 2026-02-13 | 13F | Van Eck Associates Corp | 11.498 | 6,14 | 1 | |||||
| 2026-01-29 | 13F | Kestra Private Wealth Services, Llc | 4.320 | -0,30 | 231 | -0,86 | ||||
| 2026-03-13 | 13F/A | Pensionmark Financial Group, Llc | 4.169 | 223 | ||||||
| 2026-01-27 | 13F | Regions Financial Corp | 7.758 | -6,62 | 415 | -7,38 | ||||
| 2026-01-29 | 13F | McGowan Group Asset Management, Inc. | 240.859 | 0,51 | 12.881 | -0,12 | ||||
| 2026-02-02 | 13F | Your Advocates Ltd., LLP | 145 | 0,00 | 28 | -17,65 | ||||
| 2026-01-09 | 13F | Charles Schwab Trust Co | 4.000 | 0,00 | 214 | -0,93 | ||||
| 2026-02-09 | 13F | Smithfield Trust Co | 1.323 | 0,00 | 0 | |||||
| 2026-01-14 | 13F | Exchange Traded Concepts, Llc | 76.218 | 103,61 | 4.076 | 102,38 | ||||
| 2025-11-12 | 13F | CIBC Bancorp USA Inc. | 136.703 | 7.357 | ||||||
| 2026-02-02 | 13F | CENTRAL TRUST Co | 1.864 | 0,00 | 100 | -1,00 | ||||
| 2026-02-11 | 13F | SOUTH STATE Corp | 169 | 0,00 | 9 | 0,00 | ||||
| 2026-02-10 | 13F/A | Northwestern Mutual Wealth Management Co | 2.042 | 328,99 | 109 | 336,00 | ||||
| 2026-02-11 | 13F | Capital Analysts, Inc. | 1.000 | 0,00 | 0 | |||||
| 2026-02-02 | 13F | Chung Wu Investment Group, LLC | 1.000 | 0,00 | 53 | 0,00 | ||||
| 2026-02-10 | 13F | Texas Yale Capital Corp. | 29.275 | -1,18 | 1.566 | -1,82 | ||||
| 2026-02-13 | 13F | Aviso Wealth Management | 4.235 | -0,02 | 227 | -0,44 | ||||
| 2026-01-23 | 13F | Valley National Advisers Inc | 1.341 | 0,00 | 0 | |||||
| 2026-02-13 | 13F | Morgan Stanley | 957.686 | -5,81 | 51.217 | -6,41 | ||||
| 2025-11-14 | 13F | Susquehanna Portfolio Strategies, LLC | 0 | -100,00 | 0 | -100,00 | ||||
| 2026-02-09 | 13F | MTM Investment Management, LLC | 1.700 | 0,00 | 91 | -1,10 | ||||
| 2026-02-11 | 13F | LPL Financial LLC | 121.108 | -12,73 | 6.477 | -13,29 | ||||
| 2025-11-14 | 13F | Strategic Wealth Partners, Ltd. | 1.751 | 0,00 | 94 | -4,08 | ||||
| 2026-02-13 | 13F | Stifel Financial Corp | 31.837 | 4,96 | 1.703 | 4,29 | ||||
| 2026-02-12 | 13F | Penserra Capital Management LLC | 30 | 0,00 | 0 | |||||
| 2026-02-13 | 13F | Valueworks Llc | 0 | -100,00 | 0 | |||||
| 2025-11-14 | 13F | Strategic Wealth Partners, Ltd. | Call | 9.000 | 0,00 | 484 | -3,97 | |||
| 2026-01-30 | 13F | Covenant Asset Management, LLC | 7.295 | 0,00 | 390 | -0,51 | ||||
| 2026-02-09 | 13F | Mediolanum International Funds Ltd | 44.133 | 29,05 | 8.537 | 6,02 | ||||
| 2026-02-13 | 13F | Kestra Advisory Services, LLC | 0 | -100,00 | 0 | |||||
| 2026-01-30 | 13F/A | M&t Bank Corp | 12.050 | 0,00 | 644 | -0,62 | ||||
| 2026-01-22 | 13F | Evermay Wealth Management Llc | 485 | 0,00 | 26 | -3,85 | ||||
| 2026-01-08 | 13F | Wealth Enhancement Advisory Services, Llc | 7.677 | 5,66 | 405 | 3,05 | ||||
| 2026-02-05 | 13F | Requisite Capital Management, LLC | 34.068 | -18,70 | 1.822 | -19,25 | ||||
| 2026-01-15 | 13F | Founders Capital Management | 30.817 | -26,16 | 1.648 | -26,63 | ||||
| 2026-02-12 | 13F | Jane Street Group, Llc | 0 | -100,00 | 0 | -100,00 | ||||
| 2026-02-17 | 13F | Russell Investments Group, Ltd. | 399 | -5,67 | 21 | -4,55 | ||||
| 2026-02-10 | 13F | Disciplined Investors, L.L.C. | 8.440 | -2,64 | 451 | -3,22 | ||||
| 2026-02-13 | 13F | Mariner, LLC | 45.802 | 35,57 | 2.450 | 34,71 | ||||
| 2026-02-06 | 13F | Pnc Financial Services Group, Inc. | 1.000 | -9,09 | 53 | -10,17 | ||||
| 2026-02-18 | 13F | Beacon Pointe Advisors, LLC | 3.893 | 0,00 | 208 | -0,48 | ||||
| 2026-01-29 | 13F | Sanctuary Advisors, LLC | 35.920 | -4,35 | 1.921 | -4,95 | ||||
| 2026-02-11 | 13F | Simplex Trading, Llc | Call | 900 | 50,00 | 48 | ||||
| 2026-02-11 | 13F | Simplex Trading, Llc | Put | 6.000 | -7,69 | 321 | ||||
| 2026-02-11 | 13F | Simplex Trading, Llc | 527 | -67,08 | 28 | |||||
| 2026-02-17 | 13F | Tortoise Capital Advisors, L.l.c. | 1.092.866 | 37,59 | 58.446 | 36,72 | ||||
| 2026-02-17 | 13F | Tower Research Capital LLC (TRC) | 0 | -100,00 | 0 | |||||
| 2026-01-22 | 13F | Lee Financial Co | 4.570 | 244 | ||||||
| 2026-02-13 | 13F | Southport Management, L.l.c. | 19.409 | 0,00 | 1.038 | -0,67 | ||||
| 2026-02-12 | 13F | Jane Street Group, Llc | Call | 8.200 | -63,23 | 439 | -63,50 | |||
| 2026-01-21 | 13F | BIP Wealth, LLC | 5.000 | 0,00 | 267 | -0,74 | ||||
| 2026-01-05 | 13F | GAMMA Investing LLC | 70 | 0,00 | 4 | 0,00 | ||||
| 2026-02-12 | 13F | Jane Street Group, Llc | Put | 6.700 | -31,63 | 358 | -32,07 | |||
| 2026-01-27 | 13F | Davidson Trust Co | 4.000 | 0,00 | 214 | -0,93 | ||||
| 2026-01-29 | 13F | St Germain D J Co Inc | 9 | 0 | ||||||
| 2026-02-10 | 13F | Goldman Sachs Group Inc | 1.097.854 | -0,12 | 58.713 | -0,75 | ||||
| 2026-02-26 | 13F | Oak Grove Capital LLC | 4.900 | 0,00 | 262 | -0,38 | ||||
| 2026-01-30 | 13F | Us Bancorp \de\ | 19.000 | 80,95 | 1.016 | 79,82 | ||||
| 2026-01-14 | 13F | ORG Wealth Partners, LLC | 7.517 | -34,26 | 402 | -34,63 | ||||
| 2026-02-17 | 13F | Hilltop Holdings Inc. | 6.804 | 7,08 | 364 | 6,45 | ||||
| 2026-02-17 | 13F | Fred Alger Management, Llc | 52.401 | -0,10 | 2.802 | -0,74 | ||||
| 2026-02-11 | 13F | Vermillion Wealth Management, Inc. | 552 | 0,55 | 30 | 0,00 | ||||
| 2026-01-26 | 13F | Whittier Trust Co | 350 | 0,00 | 18 | 0,00 | ||||
| 2026-01-29 | 13F | Quent Capital, LLC | 225 | 0,00 | 12 | 0,00 | ||||
| 2026-02-10 | 13F | State of Wyoming | 0 | -100,00 | 0 | |||||
| 2026-02-12 | 13F | Steward Partners Investment Advisory, Llc | 4.793 | 27,44 | 256 | 26,73 | ||||
| 2026-01-13 | 13F | Granite Group Advisors, LLC | 5.058 | 0,04 | 271 | -0,74 |