Grundlæggende statistik
| Institutionelle aktier (lange) | 107.915.023 - 83,98% (ex 13D/G) - change of -34,05MM shares -23,99% MRQ |
| Institutionel værdi (lang) | $ 1.702.653 USD ($1000) |
Institutionelt ejerskab og aktionærer
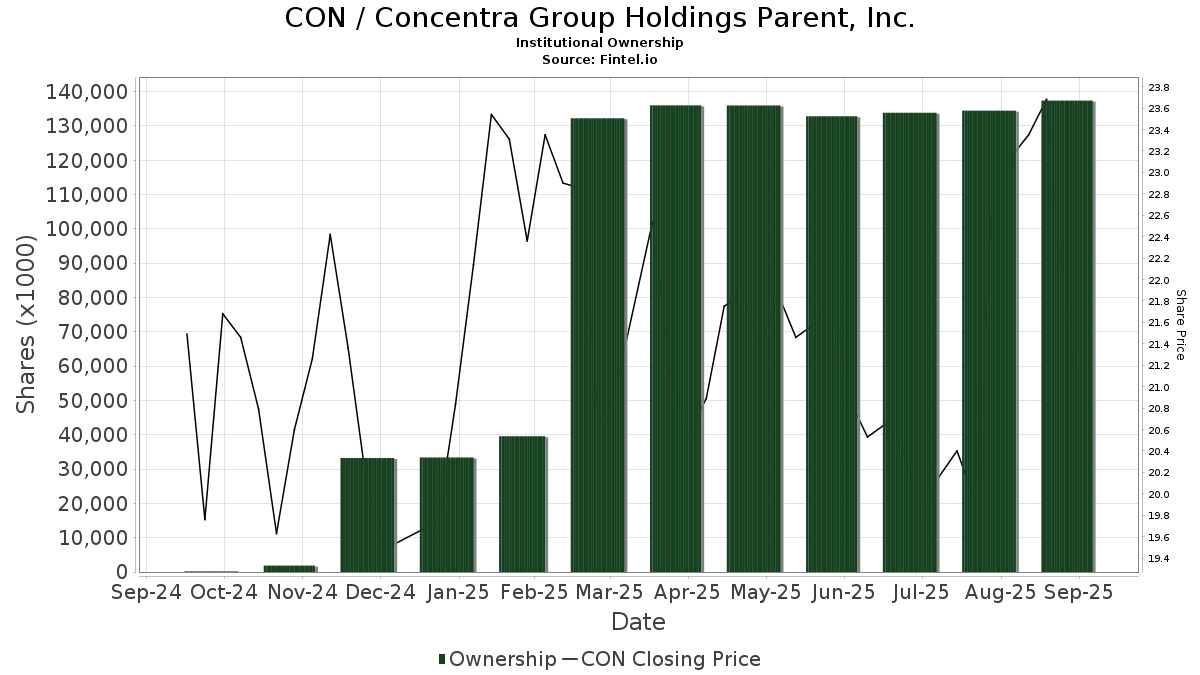
Concentra Group Holdings Parent, Inc. (US:CON) har 269 institutionelle ejere og aktionærer, der har indsendt 13D/G- eller 13F-formularer til Securities Exchange Commission (SEC). Disse institutioner har i alt 107,915,023 aktier. Største aktionærer omfatter BlackRock, Inc., Price T Rowe Associates Inc /md/, Vanguard Group Inc, State Street Corp, Jpmorgan Chase & Co, Dimensional Fund Advisors Lp, Geode Capital Management, Llc, Thrivent Financial For Lutherans, Principal Financial Group Inc, and Citadel Advisors Llc .
Concentra Group Holdings Parent, Inc. (NYSE:CON) institutionel ejerskabsstruktur viser aktuelle positioner i virksomheden efter institutioner og fonde, samt seneste ændringer i positionsstørrelse. Større aktionærer kan omfatte individuelle investorer, investeringsforeninger, hedgefonde eller institutioner. Skema 13D angiver, at investoren besidder (eller besidder) mere end 5 % af virksomheden og har til hensigt (eller har til hensigt at) aktivt at forfølge en ændring i forretningsstrategi. Skema 13G indikerer en passiv investering på over 5%.
The share price as of April 24, 2026 is 22,82 / share. Previously, on April 28, 2025, the share price was 21,61 / share. This represents an increase of 5,60% over that period.
Fondens stemningsscore
Fund Sentiment Score (fka Ownership Accumulation Score) finder de aktier, der bliver mest købt af fonde. Det er resultatet af en sofistikeret, multi-faktor kvantitativ model, der identificerer virksomheder med de højeste niveauer af institutionel akkumulering. Scoringsmodellen bruger en kombination af den samlede stigning i oplyste ejere, ændringerne i porteføljeallokeringer i disse ejere og andre målinger. Tallet går fra 0 til 100, hvor højere tal indikerer et højere niveau af akkumulering for sine jævnaldrende, og 50 er gennemsnittet.
Opdateringsfrekvens: Dagligt
Se Ownership Explorer, som giver en liste over højest rangerende virksomheder.
AI+ Ask Fintel’s AI assistant about Concentra Group Holdings Parent, Inc..
Select a question to share a public post with an AI-crafted answer.
Thinking of good questions…
Institutionel Put/Call-forhold
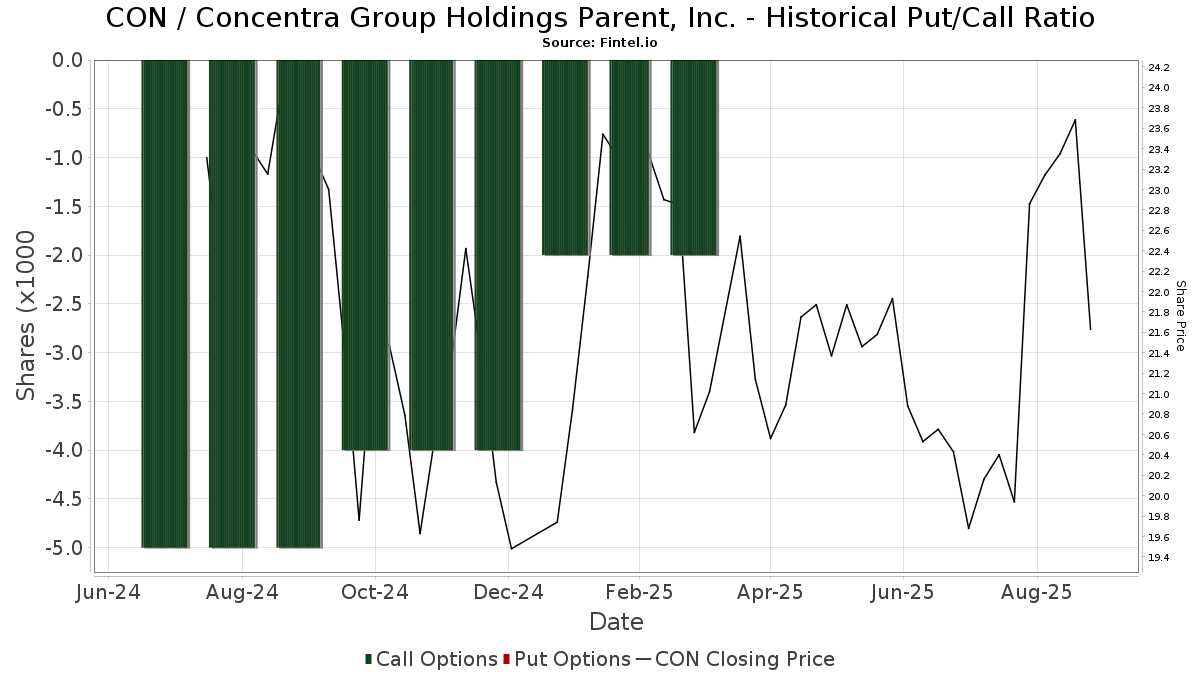
Ud over at indberette standardaktie- og gældsudstedelser skal institutter med mere end 100 mill. aktiver under forvaltning også oplyse deres put- og call-optionsbeholdninger. Da salgsoptioner generelt indikerer negativ stemning, og købsoptioner indikerer positiv stemning, kan vi få en fornemmelse af den overordnede institutionelle stemning ved at plotte forholdet mellem put og kald. Diagrammet til højre viser det historiske put/call-forhold for dette instrument.
Brug af Put/Call Ratio som en indikator for investorernes stemning overvinder en af de vigtigste mangler ved at bruge totalt institutionelt ejerskab, som er, at en betydelig mængde af aktiver under forvaltning investeres passivt for at spore indekser. Passivt forvaltede fonde køber typisk ikke optioner, så indikatoren for put/call-forholdet følger mere nøje følelsen af aktivt forvaltede fonde.
13D/G-arkivering
Vi præsenterer 13D/G ansøgninger separat fra 13F ansøgninger på grund af den forskellige behandling af SEC. 13D/G-ansøgninger kan indgives af grupper af investorer (med én ledende), hvorimod 13F-ansøgninger ikke kan. Dette resulterer i situationer, hvor en investor kan indsende en 13D/G, der rapporterer én værdi for de samlede aktier (der repræsenterer alle de aktier, der ejes af investorgruppen), men derefter indsender en 13F, der rapporterer en anden værdi for de samlede aktier (der udelukkende repræsenterer deres egne) ejendomsret). Det betyder, at aktieejerskab af 13D/G-arkiver og 13F-arkiveringer ofte ikke er direkte sammenlignelige, så vi præsenterer dem separat.
Bemærk: Fra den 16. maj 2021 viser vi ikke længere ejere, der ikke har indsendt en 13D/G inden for det seneste år. Tidligere viste vi den fulde historie af 13D/G-arkiver. Generelt skal enheder, der er forpligtet til at indgive 13D/G-ansøgninger, indgive mindst årligt, før de indsender en afsluttende ansøgning. Dog forlader fonde nogle gange positioner uden at indsende en afsluttende ansøgning (dvs. de afvikler), så visning af den fulde historie resulterede nogle gange i forvirring om det nuværende ejerskab. For at undgå forvirring viser vi nu kun 'aktuelle' ejere - det vil sige - ejere, der har anmeldt inden for det seneste år.
Upgrade to unlock premium data.
| Fil dato | Form | Investor | Forrige Aktier |
Seneste Aktier |
Δ Aktier (Procent) |
Ejendomsret (Procent) |
Δ Ejerskab (Procent) |
|
|---|---|---|---|---|---|---|---|---|
| 2026-02-17 | PRICE T ROWE ASSOCIATES INC /MD/ | 17,166,753 | 16,843,425 | -1.88 | 13.10 | -2.24 | ||
| 2025-11-26 | ORTENZIO ROBERT A | 8,247,482 | 8,168,222 | -0.96 | 6.40 | 0.00 | ||
| 2025-11-14 | T. Rowe Price Investment Management, Inc. | 8,610,562 | 6,267,949 | -27.21 | 4.90 | -27.94 | ||
| 2025-07-07 | VANGUARD GROUP INC | 12,322,623 | 13,177,363 | 6.94 | 10.28 | 6.31 | ||
| 2025-04-21 | BlackRock, Inc. | 17,803,729 | 16,126,825 | -9.42 | 12.60 | -10.00 |
13F og NPORT arkivering
Detaljer om 13F-arkivering er gratis. Detaljer om NP-ansøgninger kræver et premium-medlemskab. Grønne rækker angiver nye positioner. Røde rækker angiver lukkede positioner. Klik på linket ikon for at se den fulde transaktionshistorik.
Opgrader
for at låse premium-data op og eksportere til Excel ![]() .
.
| Fil dato | Kilde | Investor | Type | Gennemsnitlig pris (Øst) |
Aktier | Δ Aktier (%) |
Rapporteret Værdi ($1000) |
Δ Værdi (%) |
Port Alloc (%) |
|
|---|---|---|---|---|---|---|---|---|---|---|
| 2026-04-13 | 13F | Massmutual Trust Co Fsb/adv | 208 | 52,94 | 4 | 100,00 | ||||
| 2026-02-09 | 13F | Legal & General Group Plc | 290.336 | -9,28 | 5.714 | -14,71 | ||||
| 2026-02-13 | 13F | Public Sector Pension Investment Board | 0 | -100,00 | 0 | |||||
| 2026-02-17 | 13F | Northern Trust Corp | 1.235.401 | -8,85 | 24.313 | -14,29 | ||||
| 2026-02-17 | 13F | Mercer Global Advisors Inc /adv | 10.810 | 213 | ||||||
| 2026-04-16 | 13F | SG Americas Securities, LLC | 41.845 | -31,08 | 1 | -100,00 | ||||
| 2026-02-10 | 13F | Mutual Of America Capital Management Llc | 301.134 | 2.155,35 | 5.926 | 2.024,01 | ||||
| 2026-02-17 | 13F | Dark Forest Capital Management Lp | 80.541 | -44,95 | 1.585 | -47,32 | ||||
| 2026-02-17 | 13F | Adage Capital Partners Gp, L.l.c. | 149.421 | 2.941 | ||||||
| 2026-01-27 | 13F | Zurcher Kantonalbank (Zurich Cantonalbank) | 26.391 | -21,91 | 519 | -26,59 | ||||
| 2026-02-17 | 13F | California State Teachers Retirement System | 111.030 | -0,09 | 2.185 | -6,02 | ||||
| 2026-02-17 | 13F | SageView Advisory Group, LLC | 2.330 | 46 | ||||||
| 2026-04-10 | 13F | Abound Wealth Management | 7 | 0,00 | 0 | |||||
| 2026-02-03 | 13F | Everence Capital Management Inc | 15.838 | 16,55 | 0 | |||||
| 2026-02-10 | 13F | State of Wyoming | 20.981 | 48,08 | 413 | 39,19 | ||||
| 2026-02-12 | 13F | Quadrant Capital Group Llc | 6.907 | -0,73 | 136 | -6,90 | ||||
| 2025-10-28 | 13F | BRYN MAWR TRUST Co | 289 | 0,00 | 6 | 20,00 | ||||
| 2026-01-26 | 13F | Private Trust Co Na | 594 | 117,58 | 12 | 120,00 | ||||
| 2026-02-02 | 13F | Principal Financial Group Inc | 2.626.621 | -5,50 | 51.691 | -11,14 | ||||
| 2026-02-13 | 13F | Ubs Asset Management Americas Inc | 154.571 | -29,84 | 3.042 | -34,05 | ||||
| 2026-01-29 | 13F | UBS Group AG | 237.807 | -4,62 | 4.680 | -10,31 | ||||
| 2026-02-17 | 13F | Public Employees Retirement System Of Ohio | 2.118 | 32,04 | 42 | 24,24 | ||||
| 2026-02-04 | 13F | Versor Investments LP | 25.200 | 1,61 | 496 | -4,62 | ||||
| 2026-02-05 | 13F | Dana Investment Advisors, Inc. | 212.070 | -0,62 | 4.174 | -6,56 | ||||
| 2026-02-17 | 13F | Jones Financial Companies Lllp | 204 | 1.469,23 | 4 | |||||
| 2026-02-12 | 13F | MetLife Investment Management, LLC | 67.630 | -3,46 | 1.331 | -9,28 | ||||
| 2026-01-29 | 13F | Teachers Retirement System Of The State Of Kentucky | 28.032 | 0,00 | 1 | |||||
| 2026-02-13 | 13F | Victory Capital Management Inc | 52.105 | 23,19 | 1.025 | 15,82 | ||||
| 2026-01-20 | 13F | Harbor Capital Advisors, Inc. | 71.040 | 24,53 | 1 | 0,00 | ||||
| 2026-02-11 | 13F | Deutsche Bank Ag\ | 93.399 | -69,63 | 1.838 | -71,44 | ||||
| 2026-04-08 | 13F | DiNuzzo Private Wealth, Inc. | 17 | 0,00 | 0 | |||||
| 2026-02-17 | 13F | D. E. Shaw & Co., Inc. | 466.118 | 4,11 | 9.173 | -2,10 | ||||
| 2026-04-22 | 13F | Pictet Asset Management Holding SA | 17.910 | 0,00 | 384 | 9,09 | ||||
| 2026-02-10 | 13F | Natixis Advisors, L.p. | 78.501 | 29,64 | 2 | 0,00 | ||||
| 2025-11-14 | 13F | WealthTrak Capital Management LLC | 0 | -100,00 | 0 | |||||
| 2026-02-11 | 13F | Franklin Resources Inc | 22.824 | -83,79 | 449 | -84,76 | ||||
| 2026-02-11 | 13F | Jpmorgan Chase & Co | 3.749.208 | -3,23 | 73.784 | -9,01 | ||||
| 2025-11-21 | 13F/A | CIBC Bancorp USA Inc. | 12.458 | 261 | ||||||
| 2026-02-13 | 13F | Caitong International Asset Management Co., Ltd | 340 | -76,42 | 7 | -80,00 | ||||
| 2026-02-13 | 13F | Y-Intercept (Hong Kong) Ltd | 0 | -100,00 | 0 | |||||
| 2026-04-17 | 13F | Bell Investment Advisors, Inc | 24 | 0,00 | 1 | |||||
| 2026-02-06 | 13F | Global Retirement Partners, LLC | 646 | 2,54 | 13 | -7,69 | ||||
| 2026-02-17 | 13F | Raymond James Financial Inc | 352.554 | -0,06 | 6.938 | -6,03 | ||||
| 2026-02-20 | 13F | Sunbelt Securities, Inc. | 117 | 0,00 | 2 | 0,00 | ||||
| 2026-04-24 | 13F | Yousif Capital Management, Llc | 32.284 | -1,09 | 692 | -3,22 | ||||
| 2026-02-04 | 13F | First Eagle Investment Management, LLC | 383.206 | 18,38 | 7.541 | 11,31 | ||||
| 2026-02-09 | 13F | Atlantic Trust, LLC | 0 | -100,00 | 0 | |||||
| 2026-02-13 | 13F | Wells Fargo & Company/mn | 449.203 | 11,65 | 8.840 | 4,99 | ||||
| 2026-02-17 | 13F | Gotham Asset Management, LLC | 12.207 | -6,96 | 240 | -12,41 | ||||
| 2026-02-09 | 13F | Keating Financial Advisory Services, Inc. | 239 | 5 | ||||||
| 2026-02-13 | 13F | Transamerica Financial Advisors, Inc. | 3 | 0 | ||||||
| 2026-04-06 | 13F | GAMMA Investing LLC | 2.892 | 11,66 | 62 | 24,00 | ||||
| 2026-04-21 | 13F | Wesbanco Bank Inc | 66.449 | 0,00 | 1.425 | 9,03 | ||||
| 2026-02-13 | 13F | Manufacturers Life Insurance Company, The | 0 | -100,00 | 0 | |||||
| 2026-04-24 | 13F | Bayban | 59 | 1 | ||||||
| 2025-11-12 | 13F | Elo Mutual Pension Insurance Co | 0 | -100,00 | 0 | |||||
| 2026-04-02 | 13F | Ares Financial Consulting, LLC | 49 | 0,00 | 1 | |||||
| 2026-02-06 | 13F | EverSource Wealth Advisors, LLC | 399 | -62,71 | 8 | -68,18 | ||||
| 2026-02-09 | 13F | Royce & Associates Lp | 457.132 | 8,44 | 8.996 | 1,96 | ||||
| 2026-02-13 | 13F | Rhumbline Advisers | 314.726 | -6,26 | 6.194 | -11,86 | ||||
| 2026-02-13 | 13F | Walleye Capital LLC | 260.455 | 1.914,03 | 5.126 | 1.798,15 | ||||
| 2026-02-13 | 13F | First Trust Advisors Lp | 127.543 | 246,39 | 2.510 | 225,97 | ||||
| 2026-02-09 | 13F | Quest Partners LLC | 15.826 | 0,00 | 311 | -6,04 | ||||
| 2026-02-10 | 13F | Kesler, Norman & Wride, LLC | 0 | -100,00 | 0 | |||||
| 2026-02-06 | 13F | Bare Financial Services, Inc | 35 | 40,00 | 1 | |||||
| 2026-02-19 | 13F | Invesco Ltd. | 553.118 | 6,29 | 10.885 | -0,06 | ||||
| 2026-02-05 | 13F | Gamco Investors, Inc. Et Al | 28.720 | -6,49 | 565 | -11,99 | ||||
| 2025-11-14 | 13F | Weiss Asset Management LP | 0 | -100,00 | 0 | -100,00 | ||||
| 2026-02-13 | 13F | MAI Capital Management | 1.940 | 0,00 | 38 | -5,00 | ||||
| 2026-01-28 | 13F | Arizona State Retirement System | 32.101 | -5,96 | 632 | -11,62 | ||||
| 2026-04-23 | 13F | Marquette Asset Management, LLC | 67 | 1 | ||||||
| 2026-01-12 | 13F | Rialto Wealth Management, LLC | 26 | 1 | ||||||
| 2026-02-14 | 13F | Rockefeller Capital Management L.P. | 806 | 65,84 | 16 | 50,00 | ||||
| 2026-02-12 | 13F | Federated Hermes, Inc. | 0 | -100,00 | 0 | |||||
| 2026-04-15 | 13F | Exchange Traded Concepts, Llc | 3.345 | -14,54 | 72 | -7,79 | ||||
| 2026-02-09 | 13F | CBIZ Investment Advisory Services, LLC | 138 | 3 | ||||||
| 2026-02-17 | 13F | Woodline Partners LP | 1.529.453 | -44,31 | 30.100 | -47,64 | ||||
| 2026-01-29 | 13F | Vanguard Group Inc | 12.603.981 | -4,55 | 248.046 | -10,25 | ||||
| 2026-02-17 | 13F | Susquehanna Portfolio Strategies, LLC | 28.951 | -84,31 | 570 | -85,27 | ||||
| 2026-02-13 | 13F | American Century Companies Inc | 259.327 | 6,62 | 5.104 | 0,26 | ||||
| 2026-02-13 | 13F | Sei Investments Co | 113.766 | 7,19 | 2.239 | 0,77 | ||||
| 2026-02-13 | 13F | Morgan Stanley | 1.357.741 | 3,72 | 26.720 | -2,47 | ||||
| 2026-02-05 | 13F | Gabelli Funds Llc | 167.115 | 3,01 | 3.289 | -3,15 | ||||
| 2026-02-13 | 13F | Arrowstreet Capital, Limited Partnership | 706.632 | 1,49 | 13.907 | -4,58 | ||||
| 2025-11-13 | 13F | Jump Financial, LLC | 0 | -100,00 | 0 | |||||
| 2026-02-13 | 13F | Umb Bank N A/mo | 1.230 | 18,73 | 24 | 14,29 | ||||
| 2026-02-10 | 13F | Td Asset Management Inc | 0 | -100,00 | 0 | |||||
| 2026-02-13 | 13F | Pinnacle Wealth Planning Services, Inc. | 2.195 | 43 | ||||||
| 2026-02-06 | 13F | Covestor Ltd | 7.180 | 33,83 | 0 | |||||
| 2026-04-22 | 13F | Romano Brothers And Company | 60.511 | -0,57 | 1.298 | 8,35 | ||||
| 2026-02-17 | 13F | Capstone Investment Advisors, Llc | 27.365 | 142,77 | 539 | 128,94 | ||||
| 2026-02-10 | 13F | Envestnet Asset Management Inc | 235.554 | -19,27 | 4.636 | -24,10 | ||||
| 2026-02-11 | 13F | CSM Advisors, LLC | 17.403 | -7,13 | 0 | |||||
| 2026-02-11 | 13F | Barrow Hanley Mewhinney & Strauss Llc | 1.791.484 | 6,75 | 35.256 | 0,38 | ||||
| 2025-11-14 | 13F | Point72 Hong Kong Ltd | 0 | -100,00 | 0 | |||||
| 2026-04-17 | 13F | Webster Bank, N. A. | 75 | 0,00 | 2 | 0,00 | ||||
| 2026-02-02 | 13F | Fifth Third Bancorp | 734 | 11,04 | 14 | 7,69 | ||||
| 2026-04-22 | 13F | Sterling Capital Management LLC | 942 | -15,59 | 20 | -4,76 | ||||
| 2026-02-11 | 13F | Sunrise Financial Services, LLC | 67 | 1 | ||||||
| 2026-02-11 | 13F | Los Angeles Capital Management Llc | 633 | 13 | ||||||
| 2026-01-23 | 13F | Rsm Us Wealth Management Llc | 30.440 | 608 | ||||||
| 2026-04-16 | 13F | Capital Advisors, Ltd. LLC | 485 | -0,21 | 0 | |||||
| 2026-04-24 | 13F | Root Financial Partners, LLC | 162 | 3.950,00 | 3 | |||||
| 2026-02-02 | 13F | Cornerstone Planning Group LLC | 58 | 1,75 | 1 | 0,00 | ||||
| 2026-02-12 | 13F | Jane Street Group, Llc | 128.680 | -39,17 | 2.532 | -42,81 | ||||
| 2026-04-07 | 13F | Central Pacific Bank - Trust Division | 25.814 | 89,89 | 554 | 107,12 | ||||
| 2026-01-26 | 13F | Cwm, Llc | 1.996 | -57,27 | 0 | |||||
| 2026-02-02 | 13F | Horizon Investments, LLC | 51.487 | 24,37 | 1.013 | 16,97 | ||||
| 2026-01-28 | 13F | Salomon & Ludwin, LLC | 1.050 | 604,70 | 20 | 566,67 | ||||
| 2026-02-02 | 13F | Hussman Strategic Advisors, Inc. | 63.000 | 1.240 | ||||||
| 2025-11-13 | 13F | Fuller & Thaler Asset Management, Inc. | 0 | -100,00 | 0 | |||||
| 2026-02-05 | 13F | Amalgamated Bank | 34.560 | 0,91 | 1 | |||||
| 2026-04-07 | 13F | Farther Finance Advisors, LLC | 959 | 16,10 | 20 | 25,00 | ||||
| 2026-02-10 | 13F | Nomura Asset Management Co Ltd | 1.000 | 0,00 | 20 | -5,00 | ||||
| 2026-02-12 | 13F | Bank Of Montreal /can/ | 13.995 | -2,08 | 275 | -8,03 | ||||
| 2026-02-17 | 13F | Aster Capital Management (DIFC) Ltd | 181 | 4 | ||||||
| 2026-02-17 | 13F | Fmr Llc | 11.717 | -19,86 | 231 | -24,84 | ||||
| 2026-02-18 | 13F | Mackenzie Financial Corp | 32.803 | 5,29 | 653 | 0,15 | ||||
| 2026-04-17 | 13F | Sovereign Financial Group, Inc. | 20.045 | -1,40 | 430 | 7,25 | ||||
| 2025-11-14 | 13F | Point72 Asset Management, L.P. | 0 | -100,00 | 0 | -100,00 | ||||
| 2026-02-06 | 13F | ProShare Advisors LLC | 22.750 | 3,13 | 448 | -3,04 | ||||
| 2026-02-11 | 13F | Empowered Funds, LLC | 17.591 | 20,91 | 346 | 13,82 | ||||
| 2026-02-17 | 13F | Maryland State Retirement & Pension System | 17.372 | 1,38 | 342 | -4,75 | ||||
| 2026-04-21 | 13F | Gilpin Wealth Management, Llc | 29 | 190,00 | 1 | |||||
| 2026-02-05 | 13F | Elyxium Wealth, LLC | 36 | 1 | ||||||
| 2026-02-17 | 13F | Algert Global Llc | 0 | -100,00 | 0 | |||||
| 2026-04-06 | 13F | Versant Capital Management, Inc | 659 | 0,00 | 14 | 16,67 | ||||
| 2026-01-05 | 13F | Argent Capital Management Llc | 33.725 | -5,25 | 664 | -10,89 | ||||
| 2026-02-06 | 13F | Handelsbanken Fonder AB | 37.172 | 6,29 | 1 | |||||
| 2026-02-10 | 13F/A | Northwestern Mutual Wealth Management Co | 51 | -45,16 | 1 | 0,00 | ||||
| 2025-11-14 | 13F | Graham Capital Management, L.P. | 0 | -100,00 | 0 | -100,00 | ||||
| 2026-02-12 | 13F | Renaissance Technologies Llc | 0 | -100,00 | 0 | |||||
| 2026-02-17 | 13F | Advisor Group Holdings, Inc. | 1.976 | -84,75 | 39 | -86,13 | ||||
| 2026-02-17 | 13F | Wellington Management Group Llp | 281.013 | 4,16 | 5.530 | -2,05 | ||||
| 2026-02-09 | 13F | Harbour Investments, Inc. | 40 | 0,00 | 1 | |||||
| 2026-02-17 | 13F | Ancora Advisors, LLC | 326.540 | 1.914,44 | 6.426 | 1.795,58 | ||||
| 2026-02-12 | 13F | Wealthspire Advisors, LLC | 0 | -100,00 | 0 | |||||
| 2026-01-30 | 13F | New York State Teachers Retirement System | 45.104 | 0,00 | 1 | |||||
| 2026-01-28 | 13F | Klp Kapitalforvaltning As | 24.223 | 0,00 | 477 | -5,93 | ||||
| 2026-02-17 | 13F | Ameriprise Financial Inc | 265.357 | -0,73 | 5.222 | -6,65 | ||||
| 2026-02-13 | 13F | Police & Firemen's Retirement System of New Jersey | 32.432 | 0,26 | 638 | -5,76 | ||||
| 2026-02-13 | 13F | Kestra Advisory Services, LLC | 1.787 | 35 | ||||||
| 2026-02-17 | 13F | Price T Rowe Associates Inc /md/ | 16.843.370 | -1,88 | 331 | -7,80 | ||||
| 2026-02-17 | 13F | Voleon Capital Management Lp | 13.122 | -38,63 | 258 | -42,28 | ||||
| 2026-04-13 | 13F | Salem Investment Counselors Inc | 263 | 6 | ||||||
| 2025-11-14 | 13F | Squarepoint Ops LLC | 0 | -100,00 | 0 | |||||
| 2026-02-13 | 13F | Charles Schwab Investment Management Inc | 2.075.604 | 8,51 | 40.848 | 2,03 | ||||
| 2026-02-12 | 13F | Marex Group plc | 0 | -100,00 | 0 | |||||
| 2026-02-10 | 13F | Bnp Paribas Arbitrage, Sa | 27.973 | -23,79 | 551 | -28,39 | ||||
| 2026-02-13 | 13F | Toroso Investments, LLC | 14.207 | 15,57 | 280 | 8,56 | ||||
| 2026-01-21 | 13F | Sound Income Strategies, LLC | 277 | 6 | ||||||
| 2026-02-17 | 13F | Ghisallo Capital Management LLC | 0 | -100,00 | 0 | |||||
| 2026-02-06 | 13F | Larson Financial Group LLC | 27.001 | -28,46 | 531 | -32,70 | ||||
| 2025-11-13 | 13F | Summit X, LLC | 0 | -100,00 | 0 | -100,00 | ||||
| 2026-01-29 | 13F | Comerica Bank | 36.857 | -15,28 | 725 | -20,33 | ||||
| 2026-02-17 | 13F | Canada Pension Plan Investment Board | 86.300 | 0,00 | 1.698 | -5,98 | ||||
| 2026-04-06 | 13F | CX Institutional | 1.811 | -17,27 | 0 | |||||
| 2026-02-12 | 13F | Ensign Peak Advisors, Inc | 8.282 | -72,00 | 163 | -73,83 | ||||
| 2026-02-12 | 13F | South Dakota Investment Council | 65.068 | 4,50 | 1 | 0,00 | ||||
| 2026-02-11 | 13F | LPL Financial LLC | 94.282 | 7,37 | 1.855 | 0,98 | ||||
| 2026-02-17 | 13F | Tower Research Capital LLC (TRC) | 7.672 | 26,06 | 151 | 18,11 | ||||
| 2026-04-23 | 13F | iA Global Asset Management Inc. | 856 | 0 | ||||||
| 2026-02-11 | 13F | Group One Trading, L.p. | 300 | 6 | ||||||
| 2026-02-17 | 13F | Alliancebernstein L.p. | 141.802 | 8,45 | 2.791 | 1,97 | ||||
| 2026-02-17 | 13F | Mirabella Financial Services Llp | 10.986 | 216 | ||||||
| 2026-02-17 | 13F | State Of Wisconsin Investment Board | 71.105 | -36,80 | 1.399 | -40,57 | ||||
| 2026-02-13 | 13F | Cramer Rosenthal Mcglynn Llc | 1.977.617 | -5,44 | 38.920 | -11,09 | ||||
| 2026-02-17 | 13F | Hbk Investments L P | 862.750 | -0,90 | 16.979 | -6,82 | ||||
| 2026-04-08 | 13F | Wealth Enhancement Advisory Services, Llc | 12.622 | -6,59 | 264 | -2,59 | ||||
| 2026-02-17 | 13F | Janus Henderson Group Plc | 51.011 | -57,50 | 1.004 | -60,02 | ||||
| 2026-02-17 | 13F | Twinbeech Capital Lp | 35.900 | -15,52 | 707 | -20,58 | ||||
| 2026-01-15 | 13F | Fortitude Family Office, LLC | 0 | -100,00 | 0 | |||||
| 2026-01-21 | 13F | Flagship Harbor Advisors, Llc | 28 | 1 | ||||||
| 2026-02-13 | 13F | Prosight Management, LP | 891.030 | 46,07 | 17.535 | 37,35 | ||||
| 2026-02-10 | 13F | Goldman Sachs Group Inc | 896.930 | -22,23 | 17.652 | -26,88 | ||||
| 2026-02-10 | 13F | Godfrey Financial Associates, Inc. | 56 | 1 | ||||||
| 2026-02-12 | 13F | Cibc World Markets Corp | 0 | -100,00 | 0 | |||||
| 2026-02-13 | 13F | Entropy Technologies, LP | 25.475 | 501 | ||||||
| 2026-04-15 | 13F | Trust Point Inc. | 13.970 | 300 | ||||||
| 2026-04-23 | 13F | SJS Investment Consulting Inc. | 12 | 0,00 | 0 | |||||
| 2025-10-29 | 13F | Harel Insurance Investments & Financial Services Ltd. | 0 | -100,00 | 0 | |||||
| 2025-11-14 | 13F | Schonfeld Strategic Advisors LLC | 0 | -100,00 | 0 | |||||
| 2026-02-13 | 13F | Baird Financial Group, Inc. | 22.507 | 0,89 | 443 | -5,15 | ||||
| 2026-02-17 | 13F | Millennium Management Llc | 1.367.148 | 44,53 | 26.905 | 35,90 | ||||
| 2026-02-13 | 13F/A | Alberta Investment Management Corp | 0 | -100,00 | 0 | |||||
| 2026-02-17 | 13F | Holocene Advisors, LP | 81.768 | 29,34 | 1.609 | 21,62 | ||||
| 2026-01-29 | 13F | Dunhill Financial, LLC | 3 | 0 | ||||||
| 2026-02-12 | 13F | Hohimer Wealth Management, Llc | 0 | -100,00 | 0 | |||||
| 2026-02-11 | 13F | Illinois Municipal Retirement Fund | 67.550 | 8,20 | 1.329 | 1,76 | ||||
| 2026-02-13 | 13F | Acumen Wealth Advisors, LLC | 183 | 4 | ||||||
| 2026-02-09 | 13F | Hartland & Co., LLC | 0 | -100,00 | 0 | |||||
| 2026-02-12 | 13F | Loomis Sayles & Co L P | 833.508 | 2,31 | 16.403 | -3,79 | ||||
| 2026-02-13 | 13F | Public Employees Retirement Association Of Colorado | 10.701 | 0,00 | 0 | |||||
| 2026-02-02 | 13F | Equitable Trust Co | 223.881 | 0,00 | 4.406 | -5,98 | ||||
| 2026-02-10 | 13F | Norges Bank | 2.205.467 | 43.404 | ||||||
| 2026-02-06 | 13F | Pnc Financial Services Group, Inc. | 11.137 | 33,83 | 219 | 25,86 | ||||
| 2025-10-28 | 13F | Arlington Trust Co LLC | 0 | -100,00 | 0 | |||||
| 2026-02-11 | 13F | Rise Advisors, LLC | 0 | -100,00 | 0 | |||||
| 2026-02-17 | 13F | Creative Planning | 29.883 | -26,19 | 588 | -30,58 | ||||
| 2026-01-21 | 13F | Clayton Financial Group LLC | 0 | -100,00 | 0 | |||||
| 2026-02-05 | 13F | Allworth Financial LP | 379 | 15,90 | 7 | 16,67 | ||||
| 2026-02-11 | 13F | Hughes Financial Services, LLC | 3 | 0 | ||||||
| 2025-10-30 | 13F | Twin Peaks Wealth Advisors, LLC | 0 | -100,00 | 0 | |||||
| 2025-11-14 | 13F | Balyasny Asset Management Llc | 0 | -100,00 | 0 | |||||
| 2026-04-08 | 13F | Community Financial Services Group, LLC | 161 | 3 | ||||||
| 2026-02-09 | 13F | Huntington National Bank | 0 | -100,00 | 0 | |||||
| 2026-02-12 | 13F | BlackRock, Inc. | 17.236.061 | -0,57 | 339.206 | -6,51 | ||||
| 2026-02-13 | 13F | Cohen & Steers, Inc. | 25.420 | 0,00 | 0 | |||||
| 2026-02-12 | 13F | Dimensional Fund Advisors Lp | 2.962.875 | -4,55 | 58.311 | -10,25 | ||||
| 2026-02-18 | 13F | State of Tennessee, Treasury Department | 21.417 | -7,33 | 475 | -1,66 | ||||
| 2026-02-09 | 13F | Geode Capital Management, Llc | 2.851.717 | 0,68 | 56.130 | -5,34 | ||||
| 2026-04-13 | 13F | IFP Advisors, Inc | 56 | -16,42 | 1 | 0,00 | ||||
| 2025-11-13 | 13F | Marshall Wace, Llp | 0 | -100,00 | 0 | |||||
| 2026-02-13 | 13F | Essex Investment Management Co Llc | 160.645 | -1,79 | 3.161 | -7,65 | ||||
| 2026-02-13 | 13F | Prudential Financial Inc | 111.422 | -6,56 | 2.193 | -12,14 | ||||
| 2026-02-17 | 13F | XTX Topco Ltd | 26.090 | 513 | ||||||
| 2026-02-17 | 13F | Susquehanna Fundamental Investments, Llc | 0 | -100,00 | 0 | |||||
| 2026-02-10 | 13F | Commonwealth Of Pennsylvania Public School Empls Retrmt Sys | 29.509 | -2,79 | 581 | -8,66 | ||||
| 2026-02-13 | 13F | First National Bank Of Omaha | 19.013 | 20,26 | 374 | 13,33 | ||||
| 2026-02-13 | 13F | Colony Group, LLC | 0 | -100,00 | 0 | |||||
| 2026-02-10 | 13F | Rothschild Investment Llc | 70 | -59,54 | 1 | -66,67 | ||||
| 2026-02-17 | 13F | Russell Investments Group, Ltd. | 249.191 | 121,13 | 4.904 | 107,97 | ||||
| 2026-02-13 | 13F | JustInvest LLC | 0 | -100,00 | 0 | |||||
| 2026-02-04 | 13F | Oregon Public Employees Retirement Fund | 27.308 | 1,87 | 537 | -4,28 | ||||
| 2026-02-09 | 13F | MQS Management LLC | 0 | -100,00 | 0 | |||||
| 2026-04-23 | 13F | Oppenheimer Asset Management Inc. | 32.163 | -9,45 | 690 | -1,43 | ||||
| 2026-02-13 | 13F | Healthcare Of Ontario Pension Plan Trust Fund | 204.424 | 4.023 | ||||||
| 2026-02-17 | 13F | Watershed Asset Management, L.L.C. | 22.585 | 444 | ||||||
| 2026-04-22 | 13F | Motco | 1.613 | 0,00 | 35 | 9,68 | ||||
| 2026-01-26 | 13F | KBC Group NV | 4.335 | 0,00 | 0 | |||||
| 2026-02-13 | 13F | Citigroup Inc | 116.116 | 73,74 | 2.285 | 63,45 | ||||
| 2026-02-17 | 13F | Qube Research & Technologies Ltd | 615.779 | 11,08 | 12.119 | 4,45 | ||||
| 2026-02-13 | 13F | Brant Point Investment Management Llc | 266.022 | 5.235 | ||||||
| 2025-11-14 | 13F | Texas Permanent School Fund | 0 | -100,00 | 0 | |||||
| 2026-02-17 | 13F | Royal Bank Of Canada | 210.907 | 6,72 | 4.151 | 0,36 | ||||
| 2025-11-14 | 13F | ISAM Funds (UK) Ltd | 0 | -100,00 | 0 | -100,00 | ||||
| 2026-02-12 | 13F | Ankerstar Wealth, LLC | 12 | 0 | ||||||
| 2025-11-14 | 13F | Oxford Asset Management Llp | 0 | -100,00 | 0 | -100,00 | ||||
| 2026-01-26 | 13F/A | Phocas Financial Corp. | 190.328 | 20,40 | 3.746 | 13,21 | ||||
| 2026-01-30 | 13F/A | M&t Bank Corp | 40.561 | 6,18 | 798 | -0,25 | ||||
| 2026-02-12 | 13F | Pitcairn Co | 0 | -100,00 | 0 | |||||
| 2026-01-29 | 13F | Sanctuary Advisors, LLC | 24.994 | 1,52 | 492 | -4,66 | ||||
| 2026-02-11 | 13F | Ameritas Investment Partners, Inc. | 9.487 | 187 | ||||||
| 2026-02-11 | 13F | Capital Analysts, Inc. | 94 | 0,00 | 0 | |||||
| 2026-02-10 | 13F | Intech Investment Management Llc | 45.667 | 12,88 | 899 | 6,15 | ||||
| 2026-02-12 | 13F | Mount Yale Investment Advisors, LLC | 0 | -100,00 | 0 | |||||
| 2026-04-23 | 13F | Farmers & Merchants Investments Inc | 56 | 0,00 | 1 | 0,00 | ||||
| 2026-02-03 | 13F | Mitsubishi UFJ Kokusai Asset Management Co., Ltd. | 419 | 0,00 | 8 | 0,00 | ||||
| 2026-02-11 | 13F | Vestcor Inc | 0 | -100,00 | 0 | |||||
| 2026-02-12 | 13F | Voya Investment Management Llc | 20.963 | 0,00 | 413 | -5,94 | ||||
| 2026-02-23 | 13F | Wealth Preservation Advisors, LLC | 86 | 0,00 | 2 | 0,00 | ||||
| 2026-02-17 | 13F | Quantinno Capital Management LP | 22.651 | 35,72 | 446 | 27,51 | ||||
| 2026-02-12 | 13F | Principal Securities, Inc. | 0 | -100,00 | 0 | |||||
| 2026-02-12 | 13F | Nuveen, LLC | 719.021 | -2,82 | 14.150 | -8,62 | ||||
| 2026-02-06 | 13F | Vestmark Advisory Solutions, Inc. | 36.116 | -0,07 | 711 | -6,08 | ||||
| 2026-02-13 | 13F | Mariner, LLC | 11.559 | 7,92 | 228 | 1,34 | ||||
| 2026-02-13 | 13F | Quarry LP | 327 | -46,13 | 6 | -50,00 | ||||
| 2026-02-13 | 13F | Barclays Plc | 182.318 | 9,40 | 3.588 | 2,87 | ||||
| 2026-02-12 | 13F | New York State Common Retirement Fund | 60.297 | -21,12 | 1.187 | -25,83 | ||||
| 2025-11-14 | 13F | Two Sigma Investments, Lp | 0 | -100,00 | 0 | |||||
| 2026-04-21 | 13F | Financial Consulate, Inc | 15 | 0 | ||||||
| 2026-04-14 | 13F | Nbc Securities, Inc. | 403 | 0,00 | 9 | 14,29 | ||||
| 2026-04-20 | 13F | Louisiana State Employees Retirement System | 52.900 | -3,11 | 1.135 | 5,59 | ||||
| 2026-02-11 | 13F | Parallel Advisors, LLC | 86 | 1.333,33 | 2 | |||||
| 2026-02-13 | 13F | Kilter Group LLC | 37 | 1 | ||||||
| 2026-03-06 | 13F | Hsbc Holdings Plc | 42.927 | 848 | ||||||
| 2026-02-12 | 13F | Swiss National Bank | 227.435 | 1,70 | 4.476 | -4,38 | ||||
| 2026-01-27 | 13F | Tributary Capital Management, LLC | 566.839 | 12,41 | 11.155 | 5,69 | ||||
| 2026-01-30 | 13F | Us Bancorp \de\ | 4.214 | -22,04 | 83 | -27,43 | ||||
| 2025-11-13 | 13F | Quadrature Capital Ltd | 0 | -100,00 | 0 | |||||
| 2026-04-24 | 13F | Keybank National Association/oh | 14.080 | -3,11 | 302 | 5,96 | ||||
| 2026-01-28 | 13F | Universal- Beteiligungs- und Servicegesellschaft mbH | 83.897 | 145,50 | 1.667 | 133,15 | ||||
| 2026-02-12 | 13F | Steward Partners Investment Advisory, Llc | 9 | 0,00 | 0 | |||||
| 2026-02-13 | 13F | Smartleaf Asset Management LLC | 2.773 | 4,56 | 55 | 0,00 | ||||
| 2025-11-07 | 13F | Shell Asset Management Co | 568 | -72,77 | 0 | |||||
| 2026-02-10 | 13F | Bank of New York Mellon Corp | 933.743 | 33,94 | 18.376 | 25,95 | ||||
| 2026-01-26 | 13F | AE Wealth Management LLC | 10.954 | 216 | ||||||
| 2026-02-13 | 13F | State Street Corp | 4.446.551 | 0,51 | 87.508 | -5,49 | ||||
| 2026-04-20 | 13F | State of Alaska, Department of Revenue | 66.458 | -2,67 | 1 | 0,00 | ||||
| 2026-02-17 | 13F | Atom Investors LP | 105.549 | 534,27 | 2.077 | 496,84 | ||||
| 2026-01-28 | 13F | Teacher Retirement System Of Texas | 24.806 | -28,26 | 488 | -32,50 | ||||
| 2026-01-23 | 13F | Assetmark, Inc | 19 | 533,33 | 0 | |||||
| 2026-02-13 | 13F | BNP Paribas Asset Management Holding S.A. | 1.205 | 28,33 | 0 | |||||
| 2026-02-17 | 13F | Lazard Asset Management Llc | 16.995 | 0,00 | 334 | -5,92 | ||||
| 2026-02-13 | 13F | Parkside Financial Bank & Trust | 628 | -9,25 | 12 | -14,29 | ||||
| 2026-02-13 | 13F | Pathstone Holdings, LLC | 0 | -100,00 | 0 | |||||
| 2026-01-30 | 13F | Jennison Associates Llc | 734.379 | 6,07 | 14.453 | -0,27 | ||||
| 2026-02-05 | 13F | Thrivent Financial For Lutherans | 2.848.366 | -12,24 | 56 | -16,42 | ||||
| 2025-11-14 | 13F | Cubist Systematic Strategies, LLC | 0 | -100,00 | 0 | |||||
| 2026-01-15 | 13F | Nisa Investment Advisors, Llc | 3.263 | -10,70 | 64 | -15,79 | ||||
| 2026-02-12 | 13F | Brinker Capital Investments, LLC | 10.717 | -9,58 | 211 | -15,32 | ||||
| 2026-02-17 | 13F | MIRAE ASSET GLOBAL ETFS HOLDINGS Ltd. | 54.269 | -0,05 | 1.068 | -5,99 | ||||
| 2026-04-22 | 13F | Janney Montgomery Scott LLC | 12.048 | 20,17 | 0 | |||||
| 2026-02-13 | 13F | SRS Capital Advisors, Inc. | 10.933 | -6,28 | 215 | -11,89 | ||||
| 2025-11-04 | 13F | Jackson Creek Investment Advisors LLC | 0 | -100,00 | 0 | |||||
| 2026-04-21 | 13F | Vise Technologies, Inc. | 12.600 | 0,00 | 248 | 0,00 | ||||
| 2025-11-14 | 13F | SummitTX Capital, L.P. | 0 | -100,00 | 0 | |||||
| 2026-02-12 | 13F | Granite Investment Partners, LLC | 0 | -100,00 | 0 | |||||
| 2026-02-10 | 13F | Axq Capital, Lp | 10.203 | 201 | ||||||
| 2026-01-30 | 13F | State of New Jersey Common Pension Fund D | 112.103 | 21,27 | 2.206 | 14,06 | ||||
| 2026-02-09 | 13F | Annis Gardner Whiting Capital Advisors, LLC | 0 | -100,00 | 0 | |||||
| 2025-11-14 | 13F | Jain Global LLC | 0 | -100,00 | 0 | |||||
| 2026-02-13 | 13F | OMERS ADMINISTRATION Corp | 0 | -100,00 | 0 | |||||
| 2025-11-14 | 13F | Susquehanna International Group, Llp | 0 | -100,00 | 0 | |||||
| 2026-02-03 | 13F | Sageworth Trust Co | 31.844 | 33,83 | 627 | 25,70 | ||||
| 2026-02-13 | 13F | Ceredex Value Advisors LLC | 576.100 | 55,58 | 11.338 | 46,28 | ||||
| 2026-02-05 | 13F | Financial Strategies Group, Inc. | 13.291 | 9,67 | 266 | 11,76 | ||||
| 2026-04-24 | 13F | UMA Financial Services, Inc. | 443 | -1,12 | 10 | 12,50 | ||||
| 2026-04-06 | 13F | Highline Wealth Partners Llc | 168 | 0,00 | 4 | 0,00 | ||||
| 2026-01-26 | 13F | Whittier Trust Co Of Nevada Inc | 702 | 0,00 | 14 | 0,00 | ||||
| 2026-02-17 | 13F | Engineers Gate Manager LP | 157.982 | 207,77 | 3.109 | 189,48 | ||||
| 2026-02-12 | 13F | CIBC Private Wealth Group, LLC | 31 | 1 | ||||||
| 2026-01-22 | 13F | Massachusetts Financial Services Co /ma/ | 1.827.096 | -1,96 | 35.957 | -7,82 | ||||
| 2026-02-17 | 13F | T. Rowe Price Investment Management, Inc. | 1.191.125 | -80,97 | 23 | -82,31 | ||||
| 2026-04-07 | 13F | Signaturefd, Llc | 20 | -68,25 | 0 | -100,00 | ||||
| 2026-01-22 | 13F | Advantage Alpha Capital Partners LP | 0 | -100,00 | 0 | |||||
| 2026-02-17 | 13F | Citadel Advisors Llc | 2.250.729 | 89,27 | 44.294 | 77,97 | ||||
| 2025-10-28 | 13F | Syquant Capital Sas | 0 | -100,00 | 0 | -100,00 | ||||
| 2026-02-05 | 13F | Bessemer Group Inc | 1.154 | -1,37 | 0 | |||||
| 2026-02-17 | 13F | Aqr Capital Management Llc | 33.752 | -54,29 | 664 | -57,02 | ||||
| 2026-02-17 | 13F | Expect Equity LLC | 118.830 | 12,19 | 2.339 | 5,51 | ||||
| 2026-02-23 | 13F | Monetary Solutions, Ltd | 1.080 | 21 | ||||||
| 2026-02-17 | 13F | Wiley Bros.-aintree Capital, Llc | 18.903 | -8,32 | 372 | -13,69 | ||||
| 2026-02-17 | 13F | Hotchkis & Wiley Capital Management Llc | 458.503 | 8,65 | 9.023 | 2,16 | ||||
| 2026-02-17 | 13F | Advisory Services Network, LLC | 0 | -100,00 | 0 | |||||
| 2026-02-10 | 13F | Quantbot Technologies LP | 14.895 | 293 | ||||||
| 2026-02-11 | 13F | Fox Run Management, L.l.c. | 55.314 | 1.089 | ||||||
| 2026-02-17 | 13F | Bank Of America Corp /de/ | 1.271.451 | 32,56 | 25.022 | 24,64 | ||||
| 2026-02-12 | 13F | State Board Of Administration Of Florida Retirement System | 23.953 | 0,00 | 471 | -5,99 |