Grundlæggende statistik
| Institutionelle ejere | 143 total, 142 long only, 0 short only, 1 long/short - change of -3,36% MRQ |
| Gennemsnitlig porteføljeallokering | 0.1496 % - change of -29,22% MRQ |
| Institutionelle aktier (lange) | 9.763.713 (ex 13D/G) - change of -1,35MM shares -12,17% MRQ |
| Institutionel værdi (lang) | $ 248.502 USD ($1000) |
Institutionelt ejerskab og aktionærer
iShares U.S. ETF Trust - iShares GSCI Commodity Dynamic Roll Strategy ETF (US:COMT) har 143 institutionelle ejere og aktionærer, der har indsendt 13D/G- eller 13F-formularer til Securities Exchange Commission (SEC). Disse institutioner har i alt 9,763,713 aktier. Største aktionærer omfatter Bank Of America Corp /de/, Alliancebernstein L.p., TRUE Private Wealth Advisors, Truist Financial Corp, Colony Group, LLC, Atomi Financial Group, Inc., Morgan Stanley, Quadrature Capital Ltd, Vontobel Holding Ltd., and VCI Wealth Management LLC .
iShares U.S. ETF Trust - iShares GSCI Commodity Dynamic Roll Strategy ETF (NasdaqGM:COMT) institutionel ejerskabsstruktur viser aktuelle positioner i virksomheden efter institutioner og fonde, samt seneste ændringer i positionsstørrelse. Større aktionærer kan omfatte individuelle investorer, investeringsforeninger, hedgefonde eller institutioner. Skema 13D angiver, at investoren besidder (eller besidder) mere end 5 % af virksomheden og har til hensigt (eller har til hensigt at) aktivt at forfølge en ændring i forretningsstrategi. Skema 13G indikerer en passiv investering på over 5%.
The share price as of September 12, 2025 is 26,62 / share. Previously, on September 13, 2024, the share price was 25,28 / share. This represents an increase of 5,32% over that period.

Fondens stemningsscore
Fund Sentiment Score (fka Ownership Accumulation Score) finder de aktier, der bliver mest købt af fonde. Det er resultatet af en sofistikeret, multi-faktor kvantitativ model, der identificerer virksomheder med de højeste niveauer af institutionel akkumulering. Scoringsmodellen bruger en kombination af den samlede stigning i oplyste ejere, ændringerne i porteføljeallokeringer i disse ejere og andre målinger. Tallet går fra 0 til 100, hvor højere tal indikerer et højere niveau af akkumulering for sine jævnaldrende, og 50 er gennemsnittet.
Opdateringsfrekvens: Dagligt
Se Ownership Explorer, som giver en liste over højest rangerende virksomheder.
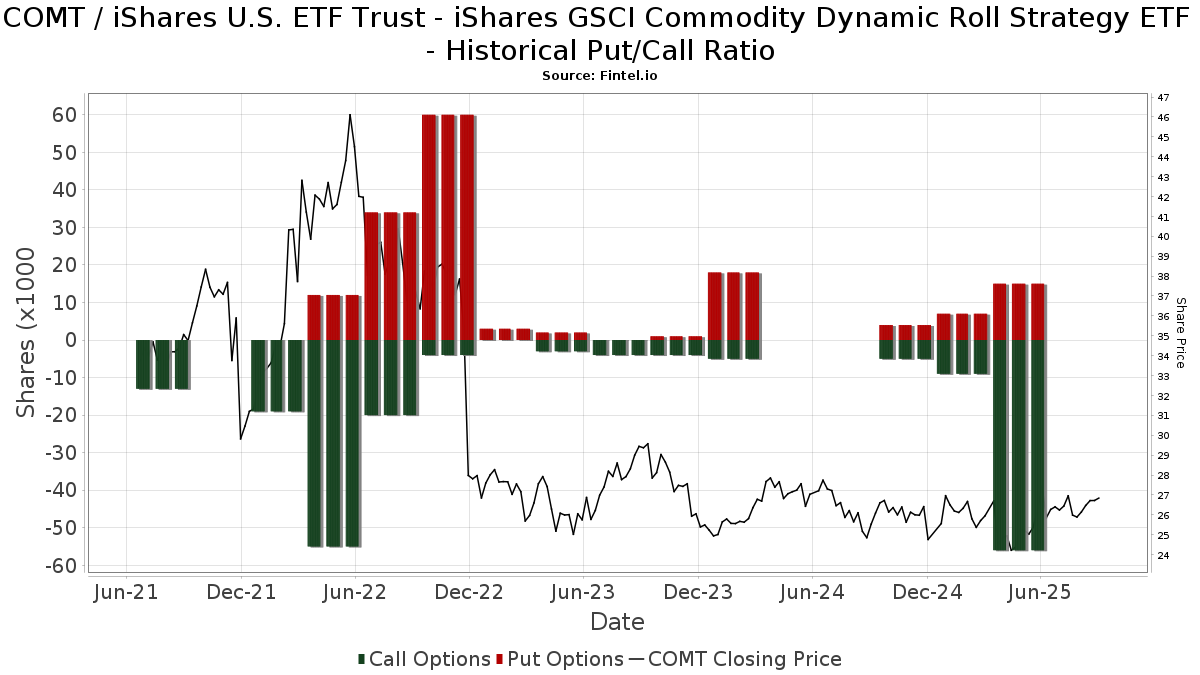
Institutionel Put/Call-forhold
Ud over at indberette standardaktie- og gældsudstedelser skal institutter med mere end 100 mill. aktiver under forvaltning også oplyse deres put- og call-optionsbeholdninger. Da salgsoptioner generelt indikerer negativ stemning, og købsoptioner indikerer positiv stemning, kan vi få en fornemmelse af den overordnede institutionelle stemning ved at plotte forholdet mellem put og kald. Diagrammet til højre viser det historiske put/call-forhold for dette instrument.
Brug af Put/Call Ratio som en indikator for investorernes stemning overvinder en af de vigtigste mangler ved at bruge totalt institutionelt ejerskab, som er, at en betydelig mængde af aktiver under forvaltning investeres passivt for at spore indekser. Passivt forvaltede fonde køber typisk ikke optioner, så indikatoren for put/call-forholdet følger mere nøje følelsen af aktivt forvaltede fonde.
13D/G-arkivering
Vi præsenterer 13D/G ansøgninger separat fra 13F ansøgninger på grund af den forskellige behandling af SEC. 13D/G-ansøgninger kan indgives af grupper af investorer (med én ledende), hvorimod 13F-ansøgninger ikke kan. Dette resulterer i situationer, hvor en investor kan indsende en 13D/G, der rapporterer én værdi for de samlede aktier (der repræsenterer alle de aktier, der ejes af investorgruppen), men derefter indsender en 13F, der rapporterer en anden værdi for de samlede aktier (der udelukkende repræsenterer deres egne) ejendomsret). Det betyder, at aktieejerskab af 13D/G-arkiver og 13F-arkiveringer ofte ikke er direkte sammenlignelige, så vi præsenterer dem separat.
Bemærk: Fra den 16. maj 2021 viser vi ikke længere ejere, der ikke har indsendt en 13D/G inden for det seneste år. Tidligere viste vi den fulde historie af 13D/G-arkiver. Generelt skal enheder, der er forpligtet til at indgive 13D/G-ansøgninger, indgive mindst årligt, før de indsender en afsluttende ansøgning. Dog forlader fonde nogle gange positioner uden at indsende en afsluttende ansøgning (dvs. de afvikler), så visning af den fulde historie resulterede nogle gange i forvirring om det nuværende ejerskab. For at undgå forvirring viser vi nu kun 'aktuelle' ejere - det vil sige - ejere, der har anmeldt inden for det seneste år.
Upgrade to unlock premium data.
| Fil dato | Form | Investor | Forrige Aktier |
Seneste Aktier |
Δ Aktier (Procent) |
Ejendomsret (Procent) |
Δ Ejerskab (Procent) |
|
|---|---|---|---|---|---|---|---|---|
| 2025-07-16 | TRUIST FINANCIAL CORP | 510,726 | 2,677,638 | 424.28 | 7.20 | 278.95 |
13F og NPORT arkivering
Detaljer om 13F-arkivering er gratis. Detaljer om NP-ansøgninger kræver et premium-medlemskab. Grønne rækker angiver nye positioner. Røde rækker angiver lukkede positioner. Klik på linket ikon for at se den fulde transaktionshistorik.
Opgrader
for at låse premium-data op og eksportere til Excel ![]() .
.
| Fil dato | Kilde | Investor | Type | Gennemsnitlig pris (Øst) |
Aktier | Δ Aktier (%) |
Rapporteret Værdi ($1000) |
Δ Værdi (%) |
Port Alloc (%) |
|
|---|---|---|---|---|---|---|---|---|---|---|
| 2025-08-15 | 13F | CI Private Wealth, LLC | 17.586 | -3,17 | 468 | -2,50 | ||||
| 2025-08-04 | 13F | Assetmark, Inc | 18.944 | 69,90 | 490 | 65,76 | ||||
| 2025-08-13 | 13F | EverSource Wealth Advisors, LLC | 4 | 0,00 | 0 | |||||
| 2025-08-14 | 13F | Smartleaf Asset Management LLC | 8 | -99,81 | 0 | -100,00 | ||||
| 2025-08-12 | 13F | Steward Partners Investment Advisory, Llc | 203 | -33,00 | 5 | -37,50 | ||||
| 2025-08-13 | 13F | Quadrature Capital Ltd | 234.889 | 200,94 | 6.072 | 193,85 | ||||
| 2025-07-31 | 13F | GenTrust, LLC | 42.760 | 1.105 | ||||||
| 2025-08-12 | 13F | Fca Corp /tx | 11.193 | 8,88 | 289 | 6,25 | ||||
| 2025-08-13 | 13F | Northwestern Mutual Wealth Management Co | 98.947 | -65,19 | 2.558 | -66,02 | ||||
| 2025-08-14 | 13F | Citadel Advisors Llc | 0 | -100,00 | 0 | |||||
| 2025-06-30 | NP | PFSMX - RiskPro® PFG 30+ Fund Class R | 168.650 | -7,69 | 4.085 | -14,54 | ||||
| 2025-08-12 | 13F | Proequities, Inc. | 0 | 0 | ||||||
| 2025-07-15 | 13F | Fifth Third Bancorp | 1.186 | 0,00 | 31 | -3,23 | ||||
| 2025-08-06 | 13F | Wedbush Securities Inc | 13.421 | -17,27 | 0 | |||||
| 2025-07-07 | 13F | Horizons Wealth Management | 555 | 0,00 | 14 | 0,00 | ||||
| 2025-07-30 | 13F | Crewe Advisors LLC | 1.205 | 0,00 | 31 | 0,00 | ||||
| 2025-05-01 | 13F | Quest 10 Wealth Builders, Inc. | 75 | 0,00 | 2 | 0,00 | ||||
| 2025-07-08 | 13F | Arlington Trust Co LLC | 52 | 0,00 | 1 | 0,00 | ||||
| 2025-08-11 | 13F | Aptus Capital Advisors, LLC | 3.610 | 93 | ||||||
| 2025-08-13 | 13F | Cerity Partners LLC | 51.156 | 30,82 | 1.322 | 27,73 | ||||
| 2025-08-11 | 13F | TRUE Private Wealth Advisors | 647.638 | 16.741 | ||||||
| 2025-04-29 | 13F | 44 Wealth Management Llc | 0 | -100,00 | 0 | |||||
| 2025-05-09 | 13F | GeoWealth Management, LLC | 0 | -100,00 | 0 | |||||
| 2025-07-15 | 13F | Alhambra Investment Partners LLC | 79.965 | 2,54 | 2.067 | 0,15 | ||||
| 2025-07-16 | 13F | Cabana Llc | 0 | -100,00 | 0 | |||||
| 2025-05-15 | 13F | Tower Research Capital LLC (TRC) | 0 | -100,00 | 0 | |||||
| 2025-07-16 | 13F | Arkansas Financial Group, Inc. | 71.318 | 1,63 | 1.881 | 10,98 | ||||
| 2025-07-18 | 13F | Bartlett & Co. Wealth Management Llc | 468 | 12 | ||||||
| 2025-07-30 | 13F | Brookstone Capital Management | 22.180 | 28,93 | 573 | 25,93 | ||||
| 2025-07-14 | 13F | Painted Porch Advisors LLC | 0 | -100,00 | 0 | -100,00 | ||||
| 2025-08-01 | 13F | Belvedere Trading LLC | Call | 0 | -100,00 | 0 | ||||
| 2025-07-07 | 13F | Retirement Wealth Solutions LLC | 11 | 0,00 | 0 | |||||
| 2025-07-30 | 13F | VCI Wealth Management LLC | 195.133 | 8,35 | 5.044 | 5,81 | ||||
| 2025-08-13 | 13F | Transce3nd, LLC | 868 | -6,06 | 23 | -4,35 | ||||
| 2025-08-14 | 13F | Bnp Paribas Arbitrage, Sa | 0 | -100,00 | 0 | |||||
| 2025-04-21 | 13F | ORG Partners LLC | 0 | -100,00 | 0 | |||||
| 2025-07-16 | 13F | Perigon Wealth Management, LLC | 22.781 | 0,00 | 589 | -2,49 | ||||
| 2025-08-14 | 13F | Mpwm Advisory Solutions, Llc | 60 | 0,00 | 2 | 0,00 | ||||
| 2025-08-01 | 13F | Belvedere Trading LLC | Put | 0 | -100,00 | 0 | ||||
| 2025-07-17 | 13F | Independence Bank of Kentucky | 262 | 0,00 | 7 | 0,00 | ||||
| 2025-08-15 | 13F | Morgan Stanley | 240.214 | 2,21 | 6.210 | -0,18 | ||||
| 2025-04-11 | 13F | Davis Capital Management | 64 | 0,00 | 2 | 0,00 | ||||
| 2025-07-09 | 13F | Pines Wealth Management, LLC | 34.265 | -0,14 | 898 | 11,28 | ||||
| 2025-08-14 | 13F | Citadel Advisors Llc | Call | 56.100 | 509,78 | 1.450 | 496,71 | |||
| 2025-08-14 | 13F | Citadel Advisors Llc | Put | 15.100 | 357,58 | 390 | 348,28 | |||
| 2025-08-12 | 13F | MAI Capital Management | 41 | -96,96 | 1 | -97,14 | ||||
| 2025-08-14 | 13F | Fmr Llc | 0 | -100,00 | 0 | |||||
| 2025-08-14 | 13F | Raymond James Financial Inc | 8.366 | 216 | ||||||
| 2025-08-12 | 13F | Jpmorgan Chase & Co | 7.394 | -21,67 | 191 | -23,29 | ||||
| 2025-08-14 | 13F | Atomi Financial Group, Inc. | 271.061 | 1,71 | 7.007 | -0,68 | ||||
| 2025-08-13 | 13F | Hsbc Holdings Plc | 26.168 | 40,86 | 676 | 37,68 | ||||
| 2025-05-09 | 13F | Comprehensive Financial Planning, Inc./PA | 0 | -100,00 | 0 | |||||
| 2025-04-16 | 13F | Lam Group, Inc. | 0 | -100,00 | 0 | |||||
| 2025-07-23 | 13F | Peak Financial Management, Inc. | 65.102 | -73,32 | 1.683 | -73,96 | ||||
| 2025-07-24 | 13F | JNBA Financial Advisors | 0 | -100,00 | 0 | |||||
| 2025-07-21 | 13F | Ameritas Advisory Services, LLC | 1.161 | 30 | ||||||
| 2025-08-01 | 13F | Envestnet Asset Management Inc | 92.223 | 0,14 | 2.384 | -2,22 | ||||
| 2025-08-01 | 13F | New York Life Investment Management Llc | 0 | -100,00 | 0 | |||||
| 2025-08-11 | 13F | Private Advisor Group, LLC | 0 | -100,00 | 0 | |||||
| 2025-08-14 | 13F | Wells Fargo & Company/mn | 450 | -84,07 | 12 | -85,14 | ||||
| 2025-08-08 | 13F | Evolution Wealth Advisors, LLC | 155.053 | -6,22 | 4.008 | -8,41 | ||||
| 2025-07-31 | 13F | Buckingham Strategic Partners | 20.119 | -25,59 | 520 | -27,27 | ||||
| 2025-08-14 | 13F | Bank Of America Corp /de/ | 2.810.380 | -6,66 | 72.648 | -8,85 | ||||
| 2025-08-13 | 13F | Cresset Asset Management, LLC | 16.023 | -40,43 | 414 | -41,85 | ||||
| 2025-08-04 | 13F | Creative Financial Designs Inc /adv | 216 | -25,00 | 6 | -28,57 | ||||
| 2025-08-14 | 13F | Hancock Whitney Corp | 47.013 | -65,11 | 1.215 | -65,93 | ||||
| 2025-08-11 | 13F | Principal Securities, Inc. | 8.161 | -10,18 | 211 | -8,30 | ||||
| 2025-07-15 | 13F | EWG Elevate Inc. | 20.818 | -2,06 | 538 | -4,27 | ||||
| 2025-07-31 | 13F | Cambridge Investment Research Advisors, Inc. | 19.236 | -16,61 | 0 | |||||
| 2025-08-11 | 13F | HighTower Advisors, LLC | 9.791 | -1,57 | 253 | -3,80 | ||||
| 2025-08-08 | 13F | Kingsview Wealth Management, LLC | 17.313 | -3,40 | 448 | -5,70 | ||||
| 2025-07-23 | 13F | Sachetta, LLC | 1.100 | 0,00 | 28 | -3,45 | ||||
| 2025-08-06 | 13F | O'Brien Greene & Co. Inc | 9.810 | 0,00 | 254 | -2,32 | ||||
| 2025-07-23 | 13F | Columbus Macro, LLC | 48.574 | 0,00 | 1.256 | -2,33 | ||||
| 2025-07-22 | 13F | Mascoma Wealth Management LLC | 810 | 0,00 | 21 | -4,76 | ||||
| 2025-08-11 | 13F | Cornerstone Planning Group LLC | 91 | 0,00 | 2 | 0,00 | ||||
| 2025-08-11 | 13F | Citigroup Inc | 5.920 | -1,92 | 153 | -3,77 | ||||
| 2025-07-18 | 13F | Union Bancaire Privee, UBP SA | 1.530 | 34 | ||||||
| 2025-08-08 | 13F | Wealth Alliance | 99.059 | 2.561 | ||||||
| 2025-04-16 | 13F | Wealth Enhancement Advisory Services, Llc | 0 | -100,00 | 0 | |||||
| 2025-04-21 | 13F | Bay Colony Advisory Group, Inc d/b/a Bay Colony Advisors | 0 | -100,00 | 0 | -100,00 | ||||
| 2025-08-05 | 13F | Marion Wealth Management | 16.047 | -33,73 | 415 | -35,31 | ||||
| 2025-05-16 | 13F | Coppell Advisory Solutions LLC | 0 | -100,00 | 0 | |||||
| 2025-07-31 | 13F | Brinker Capital Investments, LLC | 0 | -100,00 | 0 | |||||
| 2025-07-08 | 13F | Parallel Advisors, LLC | 1.137 | 0,00 | 29 | -3,33 | ||||
| 2025-05-15 | 13F | Activest Wealth Management | 0 | 0 | ||||||
| 2025-08-13 | 13F | IAG Wealth Partners, LLC | 0 | -100,00 | 0 | |||||
| 2025-07-29 | 13F | Tradewinds Capital Management, LLC | 7.556 | -99,28 | 195 | -99,30 | ||||
| 2025-08-14 | 13F | Ancora Advisors, LLC | 5.437 | -19,45 | 141 | -21,35 | ||||
| 2025-07-25 | 13F | Cwm, Llc | 17.171 | -1,41 | 0 | |||||
| 2025-08-14 | 13F | Sunbelt Securities, Inc. | 133.848 | 0,62 | 3.388 | -3,78 | ||||
| 2025-07-14 | 13F | U.S. Capital Wealth Advisors, LLC | 8.413 | 0,00 | 217 | -2,25 | ||||
| 2025-05-15 | 13F | Two Sigma Securities, Llc | 0 | -100,00 | 0 | |||||
| 2025-07-22 | 13F | Hubbell Strickland Wealth Management, LLC | 13.674 | 0,00 | 353 | -2,22 | ||||
| 2025-07-17 | 13F | Sound Income Strategies, LLC | 442 | 3.057,14 | 11 | |||||
| 2025-07-31 | 13F | Carrera Capital Advisors | 66.827 | -6,66 | 1.727 | -8,87 | ||||
| 2025-08-13 | 13F | Baird Financial Group, Inc. | 53.265 | 6,87 | 1.377 | 4,32 | ||||
| 2025-05-14 | 13F | Capital Analysts, Inc. | 0 | -100,00 | 0 | |||||
| 2025-08-13 | 13F | Continuum Advisory, LLC | 0 | -100,00 | 0 | -100,00 | ||||
| 2025-05-01 | 13F | Coastal Investment Advisors, Inc. | 0 | -100,00 | 0 | |||||
| 2025-08-14 | 13F | GWM Advisors LLC | 115.519 | -55,05 | 2.986 | -56,11 | ||||
| 2025-08-14 | 13F | Ameriprise Financial Inc | 127.630 | 22,41 | 3.300 | 19,75 | ||||
| 2025-08-12 | 13F | SRS Capital Advisors, Inc. | 661 | -50,67 | 17 | -51,43 | ||||
| 2025-08-14 | 13F | Gen-Wealth Partners Inc | 3.396 | 2,04 | 88 | -1,14 | ||||
| 2025-08-12 | 13F | Founders Financial Alliance, LLC | 330 | -52,17 | 9 | -55,56 | ||||
| 2025-08-14 | 13F | CoreCap Advisors, LLC | 10.182 | 7,01 | 263 | 4,78 | ||||
| 2025-08-14 | 13F | Mml Investors Services, Llc | 58.033 | -21,48 | 2 | 0,00 | ||||
| 2025-08-14 | 13F | UBS Group AG | 151.099 | -4,73 | 3.906 | -6,98 | ||||
| 2025-08-13 | 13F | Flow Traders U.s. Llc | 0 | -100,00 | 0 | |||||
| 2025-07-08 | 13F/A | Salem Investment Counselors Inc | 511 | 0,00 | 13 | 0,00 | ||||
| 2025-07-29 | 13F | Madison Wealth Partners, Inc | 9.570 | -30,44 | 247 | -32,14 | ||||
| 2025-07-11 | 13F | Farther Finance Advisors, LLC | 2.831 | 4,16 | 73 | 1,39 | ||||
| 2025-07-23 | 13F | Nbt Bank N A /ny | 950 | -1,96 | 25 | -4,00 | ||||
| 2025-08-12 | 13F | LPL Financial LLC | 67.662 | -8,98 | 1.749 | -11,08 | ||||
| 2025-07-21 | 13F | Empirical Financial Services, LLC d.b.a. Empirical Wealth Management | 11.974 | 31,48 | 310 | 28,22 | ||||
| 2025-07-18 | 13F | SOA Wealth Advisors, LLC. | 282 | 1,81 | 7 | 0,00 | ||||
| 2025-08-13 | 13F | BCJ Capital Management, LLC | 59.486 | 22,27 | 1.538 | 19,43 | ||||
| 2025-07-25 | 13F | Northwest Capital Management Inc | 7 | -92,93 | 0 | -100,00 | ||||
| 2025-08-01 | 13F | Belvedere Trading LLC | 0 | -100,00 | 0 | |||||
| 2025-08-12 | 13F | Twin Focus Capital Partners, Llc | 7.745 | -59,33 | 200 | -60,32 | ||||
| 2025-08-11 | 13F | Dorsey & Whitney Trust CO LLC | 8.729 | 0,00 | 226 | -2,60 | ||||
| 2025-08-12 | 13F | Wayfinding Financial, LLC | 0 | -100,00 | 0 | |||||
| 2025-05-02 | 13F | Leo Wealth, LLC | 0 | -100,00 | 0 | |||||
| 2025-05-06 | 13F | Venturi Wealth Management, LLC | 0 | -100,00 | 0 | |||||
| 2025-08-05 | 13F | Simplex Trading, Llc | 132 | -95,42 | 0 | |||||
| 2025-08-14 | 13F | Sand Hill Global Advisors, LLC | 0 | -100,00 | 0 | |||||
| 2025-04-24 | 13F | Fulcrum Asset Management LLP | Put | 0 | 2.213 | |||||
| 2025-07-17 | 13F | Northwest Wealth Management, Llc | 9.571 | -2,90 | 247 | -5,00 | ||||
| 2025-07-25 | 13F | Concord Wealth Partners | 0 | -100,00 | 0 | |||||
| 2025-08-12 | 13F | CIBC Private Wealth Group, LLC | 495 | 13 | ||||||
| 2025-06-27 | NP | DAAVX - Dunham Dynamic Macro Fund Class A | 113.800 | 11.280,00 | 2.756 | 10.500,00 | ||||
| 2025-08-14 | 13F | Mariner, LLC | 9.269 | 240 | ||||||
| 2025-07-14 | 13F | UMA Financial Services, Inc. | 566 | 2,54 | 15 | 0,00 | ||||
| 2025-08-14 | 13F | Fairview Capital Investment Management, Llc | 168.007 | 100,79 | 4.343 | 96,12 | ||||
| 2025-08-08 | 13F | Creative Planning | 12.502 | 323 | ||||||
| 2025-08-14 | 13F | Gotham Asset Management, LLC | 14.391 | 13,31 | 296 | 7,64 | ||||
| 2025-08-08 | 13F | Cetera Investment Advisers | 22.894 | -1,67 | 592 | -4,06 | ||||
| 2025-05-12 | 13F | Sandy Spring Bank | 0 | -100,00 | 0 | |||||
| 2025-07-07 | 13F | Aletheian Wealth Advisors LLC | 59.518 | 30,51 | 1.539 | 27,42 | ||||
| 2025-07-23 | 13F | Godsey & Gibb Associates | 0 | -100,00 | 0 | |||||
| 2025-08-04 | 13F | Spire Wealth Management | 167 | 0,00 | 4 | 0,00 | ||||
| 2025-08-12 | 13F | BlackRock, Inc. | 36.809 | 17,96 | 952 | 15,27 | ||||
| 2025-05-27 | NP | MAINSTAY VP FUNDS TRUST - MainStay VP IQ Hedge Multi-Strategy Portfolio Initial Class | 19.752 | -35,06 | 523 | -32,12 | ||||
| 2025-08-14 | 13F | Susquehanna International Group, Llp | 0 | -100,00 | 0 | |||||
| 2025-07-10 | 13F | Global Financial Private Client, LLC | 0 | -100,00 | 0 | |||||
| 2025-08-12 | 13F | WealthTrak Capital Management LLC | 1.400 | 0,00 | 36 | -2,70 | ||||
| 2025-07-28 | 13F | Harbour Investments, Inc. | 285 | -5,32 | 7 | 0,00 | ||||
| 2025-08-13 | 13F | Vermillion & White Wealth Management Group, LLC | 100 | 0,00 | 3 | 0,00 | ||||
| 2025-07-21 | 13F | Cliftonlarsonallen Wealth Advisors, Llc | 10.033 | -3,18 | 259 | -5,47 | ||||
| 2025-08-13 | 13F | Northern Trust Corp | 12.748 | -9,28 | 330 | -11,32 | ||||
| 2025-08-15 | 13F | Kestra Advisory Services, LLC | 28.955 | -38,35 | 748 | -39,82 | ||||
| 2025-07-15 | 13F | Spectrum Planning & Advisory Services Inc. | 14.088 | 364 | ||||||
| 2025-07-23 | 13F | Vontobel Holding Ltd. | 202.000 | -37,52 | 5.222 | -38,99 | ||||
| 2025-08-13 | 13F | Jones Financial Companies Lllp | 51 | 1 | ||||||
| 2025-08-14 | 13F | Royal Bank Of Canada | 42.781 | 136,20 | 1.106 | 130,42 | ||||
| 2025-08-08 | 13F | Security Financial Services, INC. | 7.777 | -1,62 | 201 | -3,83 | ||||
| 2025-07-21 | 13F | Mirae Asset Global Investments Co., Ltd. | 62.100 | 314,00 | 1.605 | 310,49 | ||||
| 2025-08-14 | 13F | Note Advisors, LLC | 66.886 | 14,89 | 1.729 | 12,27 | ||||
| 2025-08-05 | 13F | Bank Of Montreal /can/ | 138 | -94,02 | 4 | -95,08 | ||||
| 2025-08-14 | 13F | Alliancebernstein L.p. | 781.060 | -0,01 | 20.190 | -2,36 | ||||
| 2025-08-14 | 13F | Jane Street Group, Llc | 0 | -100,00 | 0 | |||||
| 2025-09-04 | 13F/A | Advisor Group Holdings, Inc. | 37.202 | -15,00 | 962 | -16,93 | ||||
| 2025-05-15 | 13F | StoneX Group Inc. | 0 | -100,00 | 0 | -100,00 | ||||
| 2025-07-18 | 13F | Truist Financial Corp | 400.194 | -10,69 | 10.345 | -12,78 | ||||
| 2025-07-30 | 13F | Financial Perspectives, Inc | 2.140 | 0,00 | 55 | -1,79 | ||||
| 2025-08-05 | 13F | Lord & Richards Wealth Management, LLC | 0 | -100,00 | 0 | |||||
| 2025-07-14 | 13F | AdvisorNet Financial, Inc | 1.050 | -23,30 | 27 | -25,00 | ||||
| 2025-08-14 | 13F | Colony Group, LLC | 273.814 | -0,21 | 7.078 | -2,55 | ||||
| 2025-05-06 | 13F | AllSquare Wealth Management LLC | 0 | -100,00 | 0 | |||||
| 2025-07-17 | 13F | Nelson, Van Denburg & Campbell Wealth Management Group, LLC | 85.659 | -2,41 | 2.214 | -4,69 | ||||
| 2025-06-27 | NP | PASIX - PACE Alternative Strategies Investments Class A | 90.720 | 8,03 | 2.197 | 0,05 | ||||
| 2025-07-11 | 13F | Prosperity Planning, Inc. | 22.085 | 0,56 | 571 | -1,89 | ||||
| 2025-08-12 | 13F | Global Retirement Partners, LLC | 1.593 | -32,61 | 41 | -30,51 | ||||
| 2025-08-06 | 13F | AE Wealth Management LLC | 12.936 | 17,48 | 334 | 14,78 | ||||
| 2025-08-18 | 13F/A | National Bank Of Canada /fi/ | 21.112 | 546 | ||||||
| 2025-05-08 | 13F | Us Bancorp \de\ | 0 | -100,00 | 0 | |||||
| 2025-07-28 | 13F | Pettinga Financial Advisors, LLC | 60.388 | 8,31 | 1.561 | 5,83 | ||||
| 2025-07-28 | 13F | Rosenberg Matthew Hamilton | 4 | 0,00 | 0 | |||||
| 2025-03-28 | NP | QAI - IQ Hedge Multi-Strategy Tracker ETF | 61.759 | -23,44 | 1.616 | -23,78 | ||||
| 2025-08-11 | 13F | Strategic Wealth Partners, Ltd. | 372 | 10 | ||||||
| 2025-08-06 | 13F | Commonwealth Equity Services, Llc | 14.459 | -37,66 | 0 | |||||
| 2025-08-07 | 13F | Allworth Financial LP | 224 | 0,00 | 6 | 0,00 | ||||
| 2025-08-08 | 13F | Avantax Advisory Services, Inc. | 12.985 | -3,82 | 336 | -6,16 | ||||
| 2025-08-13 | 13F | Consultiva Wealth Management, Corp. | 77 | 0,00 | 2 | -50,00 | ||||
| 2025-07-23 | 13F | Tcfg Wealth Management, Llc | 8.166 | 211 | ||||||
| 2025-08-14 | 13F | Comerica Bank | 72 | 0,00 | 2 | 0,00 | ||||
| 2025-08-07 | 13F | Nwam Llc | 158.066 | -0,23 | 4.086 | -2,55 | ||||
| 2025-07-31 | 13F | Sumitomo Mitsui Trust Holdings, Inc. | 97.293 | -27,01 | 2.515 | -28,71 | ||||
| 2025-07-22 | 13F | Inlight Wealth Management, LLC | 0 | -100,00 | 0 |
Other Listings
| MX:COMT |