Grundlæggende statistik
| Institutionelle ejere | 82 total, 82 long only, 0 short only, 0 long/short - change of 84,09% MRQ |
| Gennemsnitlig porteføljeallokering | 0.2691 % - change of 82,10% MRQ |
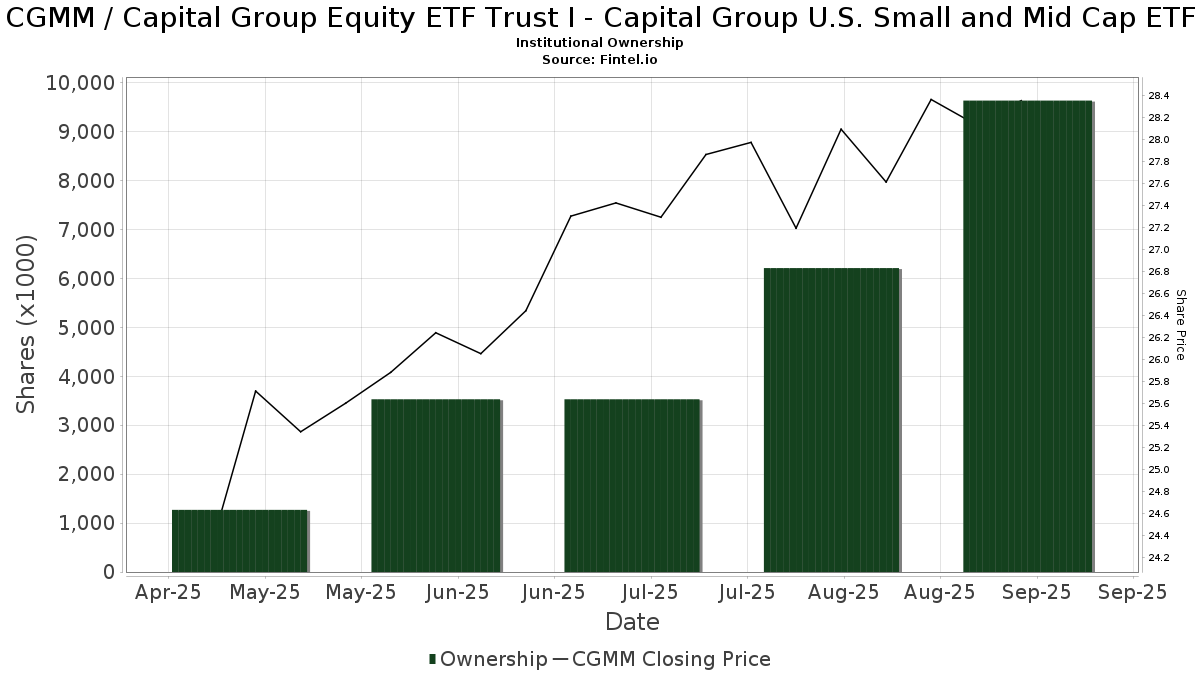
| Institutionelle aktier (lange) | 9.634.411 (ex 13D/G) - change of 6,07MM shares 171,93% MRQ |
| Institutionel værdi (lang) | $ 231.376 USD ($1000) |
Institutionelt ejerskab og aktionærer
Capital Group Equity ETF Trust I - Capital Group U.S. Small and Mid Cap ETF (US:CGMM) har 82 institutionelle ejere og aktionærer, der har indsendt 13D/G- eller 13F-formularer til Securities Exchange Commission (SEC). Disse institutioner har i alt 9,634,411 aktier. Største aktionærer omfatter Envestnet Asset Management Inc, Captrust Financial Advisors, Commonwealth Equity Services, Llc, GWM Advisors LLC, Main Line Retirement Advisors, LLC, Advisor Group Holdings, Inc., Strategic Blueprint, LLC, LPL Financial LLC, Cetera Investment Advisers, and Beta Wealth Group, Inc. .
Capital Group Equity ETF Trust I - Capital Group U.S. Small and Mid Cap ETF (ARCA:CGMM) institutionel ejerskabsstruktur viser aktuelle positioner i virksomheden efter institutioner og fonde, samt seneste ændringer i positionsstørrelse. Større aktionærer kan omfatte individuelle investorer, investeringsforeninger, hedgefonde eller institutioner. Skema 13D angiver, at investoren besidder (eller besidder) mere end 5 % af virksomheden og har til hensigt (eller har til hensigt at) aktivt at forfølge en ændring i forretningsstrategi. Skema 13G indikerer en passiv investering på over 5%.
The share price as of September 8, 2025 is 28,58 / share. Previously, on January 16, 2025, the share price was 25,98 / share. This represents an increase of 10,01% over that period.
Fondens stemningsscore
Fund Sentiment Score (fka Ownership Accumulation Score) finder de aktier, der bliver mest købt af fonde. Det er resultatet af en sofistikeret, multi-faktor kvantitativ model, der identificerer virksomheder med de højeste niveauer af institutionel akkumulering. Scoringsmodellen bruger en kombination af den samlede stigning i oplyste ejere, ændringerne i porteføljeallokeringer i disse ejere og andre målinger. Tallet går fra 0 til 100, hvor højere tal indikerer et højere niveau af akkumulering for sine jævnaldrende, og 50 er gennemsnittet.
Opdateringsfrekvens: Dagligt
Se Ownership Explorer, som giver en liste over højest rangerende virksomheder.
Institutionel Put/Call-forhold
Ud over at indberette standardaktie- og gældsudstedelser skal institutter med mere end 100 mill. aktiver under forvaltning også oplyse deres put- og call-optionsbeholdninger. Da salgsoptioner generelt indikerer negativ stemning, og købsoptioner indikerer positiv stemning, kan vi få en fornemmelse af den overordnede institutionelle stemning ved at plotte forholdet mellem put og kald. Diagrammet til højre viser det historiske put/call-forhold for dette instrument.
Brug af Put/Call Ratio som en indikator for investorernes stemning overvinder en af de vigtigste mangler ved at bruge totalt institutionelt ejerskab, som er, at en betydelig mængde af aktiver under forvaltning investeres passivt for at spore indekser. Passivt forvaltede fonde køber typisk ikke optioner, så indikatoren for put/call-forholdet følger mere nøje følelsen af aktivt forvaltede fonde.
13F og NPORT arkivering
Detaljer om 13F-arkivering er gratis. Detaljer om NP-ansøgninger kræver et premium-medlemskab. Grønne rækker angiver nye positioner. Røde rækker angiver lukkede positioner. Klik på linket ikon for at se den fulde transaktionshistorik.
Opgrader
for at låse premium-data op og eksportere til Excel ![]() .
.
| Fil dato | Kilde | Investor | Type | Gennemsnitlig pris (Øst) |
Aktier | Δ Aktier (%) |
Rapporteret Værdi ($1000) |
Δ Værdi (%) |
Port Alloc (%) |
|
|---|---|---|---|---|---|---|---|---|---|---|
| 2025-07-30 | 13F | Cullen/frost Bankers, Inc. | 37.685 | 33,39 | 1.013 | 50,15 | ||||
| 2025-07-23 | 13F | Wise Wealth Partners | 59.905 | 1.610 | ||||||
| 2025-08-06 | 13F | Souders Financial Advisors | 9.724 | 261 | ||||||
| 2025-09-09 | 13F | NWF Advisory Services Inc. | 33.572 | 902 | ||||||
| 2025-07-10 | 13F | Sovran Advisors, LLC | 22.424 | 611 | ||||||
| 2025-07-22 | 13F | Merit Financial Group, LLC | 39.691 | 73,57 | 1.067 | 95,24 | ||||
| 2025-08-14 | 13F | Raymond James Financial Inc | 1.107 | 30 | ||||||
| 2025-07-31 | 13F | Moloney Securities Asset Management, LLC | 22.560 | 43,42 | 606 | 61,60 | ||||
| 2025-08-01 | 13F | Envestnet Asset Management Inc | 1.846.515 | 138,99 | 49.634 | 168,92 | ||||
| 2025-08-13 | 13F | Summit Wealth Group Llc / Co | 7.994 | 215 | ||||||
| 2025-08-12 | 13F | OneAscent Financial Services LLC | 23.506 | 100,32 | 1 | |||||
| 2025-08-27 | 13F/A | Brinker Capital Investments, LLC | 31.651 | 851 | ||||||
| 2025-08-13 | 13F | Capital International Investors | 174.909 | -82,59 | 4.702 | -80,42 | ||||
| 2025-09-04 | 13F/A | Advisor Group Holdings, Inc. | 414.909 | 1.090,90 | 11.153 | 1.240,38 | ||||
| 2025-08-01 | 13F | Gwn Securities Inc. | 0 | -100,00 | 0 | |||||
| 2025-08-06 | 13F | Founders Financial Securities Llc | 12.889 | 13,92 | 346 | 31,06 | ||||
| 2025-07-28 | 13F | JGP Wealth Management, LLC | 7.770 | 209 | ||||||
| 2025-08-14 | 13F | Susquehanna International Group, Llp | 21.754 | 118,63 | 585 | 146,41 | ||||
| 2025-08-04 | 13F | Pensionmark Financial Group, Llc | 10.812 | 18,16 | 291 | 33,03 | ||||
| 2025-07-10 | 13F | Wealth Enhancement Advisory Services, Llc | 83.792 | 35,04 | 2.302 | 55,26 | ||||
| 2025-08-14 | 13F | Mariner, LLC | 24.050 | 0,00 | 646 | 12,54 | ||||
| 2025-08-08 | 13F | Security Financial Services, INC. | 12.405 | 333 | ||||||
| 2025-07-29 | 13F | Balboa Wealth Partners | 10.102 | 272 | ||||||
| 2025-07-14 | 13F | AdvisorNet Financial, Inc | 295 | 8 | ||||||
| 2025-08-08 | 13F | Cetera Investment Advisers | 281.832 | 7.576 | ||||||
| 2025-08-15 | 13F | Morgan Stanley | 1.748 | 47 | ||||||
| 2025-08-11 | 13F | Private Advisor Group, LLC | 19.830 | 533 | ||||||
| 2025-08-14 | 13F | Mml Investors Services, Llc | 229.187 | 37,19 | 6 | 100,00 | ||||
| 2025-05-02 | 13F | Capital A Wealth Management, LLC | 520 | 12 | ||||||
| 2025-07-09 | 13F | Pines Wealth Management, LLC | 34.618 | 6,44 | 951 | 39,30 | ||||
| 2025-07-28 | 13F | Sagespring Wealth Partners, Llc | 25.750 | 692 | ||||||
| 2025-08-06 | 13F | Legacy Investment Solutions, LLC | 14 | 0 | ||||||
| 2025-08-04 | 13F | Assetmark, Inc | 37.334 | 1.004 | ||||||
| 2025-08-15 | 13F | Kestra Advisory Services, LLC | 12.630 | 339 | ||||||
| 2025-08-06 | 13F | Commonwealth Equity Services, Llc | 654.161 | 170,50 | 18 | 240,00 | ||||
| 2025-08-14 | 13F | Sei Investments Co | 242.983 | 1.613,32 | 6.531 | 1.832,25 | ||||
| 2025-08-11 | 13F | Rothschild Investment Llc | 27.690 | 744 | ||||||
| 2025-08-14 | 13F | Citadel Advisors Llc | 8.969 | 241 | ||||||
| 2025-07-30 | 13F | Smith Thornton Advisors LLC | 113.644 | 0,47 | 3.055 | 13,03 | ||||
| 2025-08-14 | 13F | Wiley Bros.-aintree Capital, Llc | 102.637 | 106,48 | 2.778 | 133,36 | ||||
| 2025-07-28 | 13F | Harbour Investments, Inc. | 21.010 | 143,79 | 565 | 175,12 | ||||
| 2025-08-14 | 13F | Stifel Financial Corp | 247.324 | 6.648 | ||||||
| 2025-07-16 | 13F | Essex Financial Services, Inc. | 23.334 | 131,14 | 627 | 160,17 | ||||
| 2025-07-29 | 13F | Latitude Advisors, LLC | 15.399 | 24,75 | 414 | 40,48 | ||||
| 2025-07-29 | 13F | Stephens Inc /ar/ | 260.608 | 7.005 | ||||||
| 2025-07-11 | 13F | Trinity Wealth Management, LLC | 19.473 | 523 | ||||||
| 2025-08-06 | 13F | Legacy Wealth Managment, LLC/ID | 14 | 0 | ||||||
| 2025-08-14 | 13F | GWM Advisors LLC | 505.750 | 13.595 | ||||||
| 2025-07-15 | 13F | StoneCrest Wealth Management, Inc. | 118.935 | 3.197 | ||||||
| 2025-07-18 | 13F | Truist Financial Corp | 21.242 | 6,19 | 571 | 19,50 | ||||
| 2025-08-13 | 13F | Capital Analysts, Inc. | 115 | 0,00 | 0 | |||||
| 2025-07-22 | 13F | Ergawealth Advisors, Inc. | 96.732 | 2.600 | ||||||
| 2025-07-17 | 13F | Janney Montgomery Scott LLC | 33.124 | 1 | ||||||
| 2025-08-06 | 13F | Mark Sheptoff Financial Planning, Llc | 390 | 0,00 | 10 | 11,11 | ||||
| 2025-07-24 | 13F | NavPoint Financial, Inc. | 50.983 | 195,38 | 1.370 | 232,52 | ||||
| 2025-07-31 | 13F | Cambridge Investment Research Advisors, Inc. | 89.344 | 767,67 | 2 | |||||
| 2025-07-14 | 13F | Main Line Retirement Advisors, LLC | 488.907 | 4.132,96 | 13.142 | 4.678,55 | ||||
| 2025-07-11 | 13F | LongView Wealth Management | 16.861 | 453 | ||||||
| 2025-07-30 | 13F | D.a. Davidson & Co. | 16.720 | 449 | ||||||
| 2025-07-14 | 13F | Ai Financial Services Llc | 52.617 | -4,16 | 1.414 | 7,86 | ||||
| 2025-08-13 | 13F | Capital Group Private Client Services, Inc. | 255.947 | 224,46 | 6.880 | 265,13 | ||||
| 2025-08-15 | 13F | Captrust Financial Advisors | 923.440 | 2.813,80 | 24.822 | 3.179,00 | ||||
| 2025-07-25 | 13F | Envestnet Portfolio Solutions, Inc. | 24.999 | -16,89 | 672 | -6,55 | ||||
| 2025-08-08 | 13F | Kingsview Wealth Management, LLC | 49.984 | 1.344 | ||||||
| 2025-07-23 | 13F | Valmark Advisers, Inc. | 12.610 | 339 | ||||||
| 2025-08-13 | 13F | Cary Street Partners Financial Llc | 193.673 | 5.206 | ||||||
| 2025-08-12 | 13F | LPL Financial LLC | 335.707 | 9.024 | ||||||
| 2025-08-08 | 13F | Avantax Advisory Services, Inc. | 64.937 | 1.746 | ||||||
| 2025-07-28 | 13F | RFG Advisory, LLC | 23.504 | 632 | ||||||
| 2025-08-05 | 13F | Sigma Planning Corp | 20.281 | 1,41 | 545 | 14,26 | ||||
| 2025-07-21 | 13F | Barrett & Company, Inc. | 5.675 | 10,73 | 153 | 24,59 | ||||
| 2025-08-14 | 13F | Benjamin Edwards Inc | 96.264 | 134,13 | 2.588 | 163,44 | ||||
| 2025-07-25 | 13F | Concurrent Investment Advisors, LLC | 96.946 | 139,00 | 2.606 | 168,83 | ||||
| 2025-07-16 | 13F | Midwest Heritage Bank, FSB | 13.574 | 365 | ||||||
| 2025-08-12 | 13F | Steward Partners Investment Advisory, Llc | 209 | 37,50 | 6 | 66,67 | ||||
| 2025-08-14 | 13F | Royal Bank Of Canada | 19.315 | 302,90 | 519 | 351,30 | ||||
| 2025-08-11 | 13F | HighTower Advisors, LLC | 31.636 | 850 | ||||||
| 2025-08-11 | 13F | Beta Wealth Group, Inc. | 267.824 | -1,09 | 7.199 | 11,30 | ||||
| 2025-07-24 | 13F | IFP Advisors, Inc | 1.242 | 0,00 | 33 | 13,79 | ||||
| 2025-08-12 | 13F | Tradition Wealth Management, LLC | 50.990 | 319,67 | 1.371 | 372,41 | ||||
| 2025-07-30 | 13F | Strategic Blueprint, LLC | 352.716 | 68,88 | 9.481 | 90,04 | ||||
| 2025-07-25 | 13F | Cwm, Llc | 299 | 0 | ||||||
| 2025-08-12 | 13F | Proequities, Inc. | 0 | 0 | ||||||
| 2025-07-16 | 13F | ORG Partners LLC | 10.189 | 1.071,15 | 276 | 1.280,00 |