Grundlæggende statistik
| Institutionelle ejere | 149 total, 149 long only, 0 short only, 0 long/short - change of 30,43% MRQ |
| Gennemsnitlig porteføljeallokering | 0.1998 % - change of 51,70% MRQ |
| Institutionelle aktier (lange) | 94.641.938 (ex 13D/G) - change of 9,24MM shares 10,82% MRQ |
| Institutionel værdi (lang) | $ 2.331.837 USD ($1000) |
Institutionelt ejerskab og aktionærer
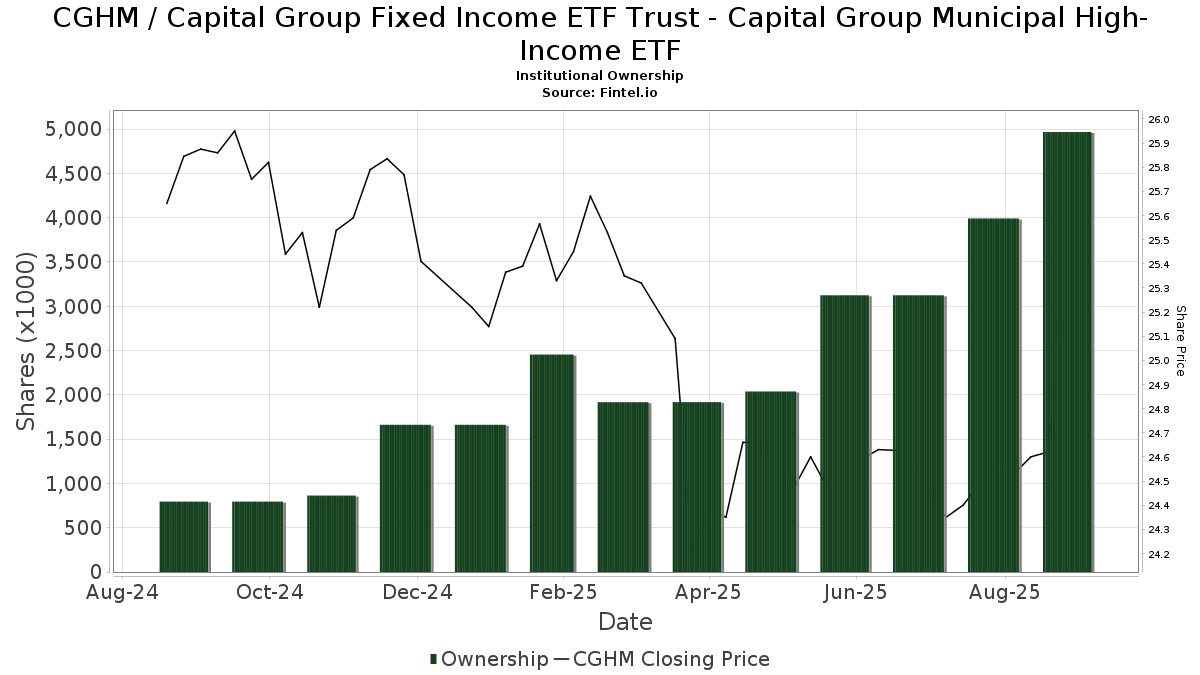
Capital Group Fixed Income ETF Trust - Capital Group Municipal High-Income ETF (US:CGHM) har 149 institutionelle ejere og aktionærer, der har indsendt 13D/G- eller 13F-formularer til Securities Exchange Commission (SEC). Disse institutioner har i alt 94,641,938 aktier. Største aktionærer omfatter Capital International Investors, Envestnet Asset Management Inc, LPL Financial LLC, Cetera Investment Advisers, Cambridge Investment Research Advisors, Inc., Vestmark Advisory Solutions, Inc., Mml Investors Services, Llc, Assetmark, Inc, Royal Bank Of Canada, and Commonwealth Equity Services, Llc .
Capital Group Fixed Income ETF Trust - Capital Group Municipal High-Income ETF (ARCA:CGHM) institutionel ejerskabsstruktur viser aktuelle positioner i virksomheden efter institutioner og fonde, samt seneste ændringer i positionsstørrelse. Større aktionærer kan omfatte individuelle investorer, investeringsforeninger, hedgefonde eller institutioner. Skema 13D angiver, at investoren besidder (eller besidder) mere end 5 % af virksomheden og har til hensigt (eller har til hensigt at) aktivt at forfølge en ændring i forretningsstrategi. Skema 13G indikerer en passiv investering på over 5%.
The share price as of April 14, 2026 is 25,60 / share. Previously, on April 15, 2025, the share price was 24,33 / share. This represents an increase of 5,22% over that period.
Fondens stemningsscore
Fund Sentiment Score (fka Ownership Accumulation Score) finder de aktier, der bliver mest købt af fonde. Det er resultatet af en sofistikeret, multi-faktor kvantitativ model, der identificerer virksomheder med de højeste niveauer af institutionel akkumulering. Scoringsmodellen bruger en kombination af den samlede stigning i oplyste ejere, ændringerne i porteføljeallokeringer i disse ejere og andre målinger. Tallet går fra 0 til 100, hvor højere tal indikerer et højere niveau af akkumulering for sine jævnaldrende, og 50 er gennemsnittet.
Opdateringsfrekvens: Dagligt
Se Ownership Explorer, som giver en liste over højest rangerende virksomheder.
AI+ Ask Fintel’s AI assistant about Capital Group Fixed Income ETF Trust - Capital Group Municipal High-Income ETF.
Select a question to share a public post with an AI-crafted answer.
Thinking of good questions…
Institutionel Put/Call-forhold
Ud over at indberette standardaktie- og gældsudstedelser skal institutter med mere end 100 mill. aktiver under forvaltning også oplyse deres put- og call-optionsbeholdninger. Da salgsoptioner generelt indikerer negativ stemning, og købsoptioner indikerer positiv stemning, kan vi få en fornemmelse af den overordnede institutionelle stemning ved at plotte forholdet mellem put og kald. Diagrammet til højre viser det historiske put/call-forhold for dette instrument.
Brug af Put/Call Ratio som en indikator for investorernes stemning overvinder en af de vigtigste mangler ved at bruge totalt institutionelt ejerskab, som er, at en betydelig mængde af aktiver under forvaltning investeres passivt for at spore indekser. Passivt forvaltede fonde køber typisk ikke optioner, så indikatoren for put/call-forholdet følger mere nøje følelsen af aktivt forvaltede fonde.
13F og NPORT arkivering
Detaljer om 13F-arkivering er gratis. Detaljer om NP-ansøgninger kræver et premium-medlemskab. Grønne rækker angiver nye positioner. Røde rækker angiver lukkede positioner. Klik på linket ikon for at se den fulde transaktionshistorik.
Opgrader
for at låse premium-data op og eksportere til Excel ![]() .
.
| Fil dato | Kilde | Investor | Type | Gennemsnitlig pris (Øst) |
Aktier | Δ Aktier (%) |
Rapporteret Værdi ($1000) |
Δ Værdi (%) |
Port Alloc (%) |
|
|---|---|---|---|---|---|---|---|---|---|---|
| 2026-02-17 | 13F | Raymond James Financial Inc | 519.933 | 58,74 | 13.248 | 59,93 | ||||
| 2026-01-26 | 13F | Valmark Advisers, Inc. | 187.282 | -13,50 | 4.772 | -12,86 | ||||
| 2026-01-30 | 13F | Strategic Blueprint, LLC | 8.266 | -14,43 | 211 | -13,93 | ||||
| 2026-01-29 | 13F | Aprio Wealth Management, LLC | 644.513 | 16.422 | ||||||
| 2026-02-05 | 13F | Boulder Wealth Advisors, LLC | 121.969 | 3.108 | ||||||
| 2026-02-17 | 13F | Stokes Family Office, LLC | 0 | -100,00 | 0 | |||||
| 2026-02-17 | 13F | Cetera Investment Advisers | 2.129.067 | 11,86 | 54.249 | 12,70 | ||||
| 2026-02-09 | 13F | Huntington National Bank | 6 | 0,00 | ||||||
| 2026-02-17 | 13F | Royal Bank Of Canada | 809.856 | 9,15 | 20.635 | 9,97 | ||||
| 2026-04-13 | 13F | IFP Advisors, Inc | 23.193 | 115,07 | 587 | 114,23 | ||||
| 2026-02-19 | 13F | Birchwood Financial Partners, Inc. | 29.679 | 756 | ||||||
| 2026-01-26 | 13F | Heritage Wealth Management, Inc. | 32.421 | 114,28 | 826 | 116,23 | ||||
| 2026-02-06 | 13F | Synergy Investment Management, LLC | 9.750 | 0,00 | 248 | 0,81 | ||||
| 2026-01-16 | 13F | Tempus Wealth Planning, LLC | 8.606 | 219 | ||||||
| 2026-02-13 | 13F | Integrated Wealth Concepts LLC | 22.000 | 72,83 | 561 | 74,45 | ||||
| 2026-02-12 | 13F | Betterment LLC | 18.376 | -1,12 | 0 | |||||
| 2026-02-17 | 13F | Hilltop Holdings Inc. | 15.059 | 384 | ||||||
| 2026-02-02 | 13F | Benjamin Edwards Inc | 274.055 | -0,56 | 6.983 | 0,17 | ||||
| 2026-01-21 | 13F | Capital Investment Advisory Services, LLC | 13.780 | 351 | ||||||
| 2026-01-23 | 13F | Halbert Hargrove Global Advisors, Llc | 421 | 0,00 | 11 | 0,00 | ||||
| 2026-01-13 | 13F | Regatta Capital Group, Llc | 10.912 | 278 | ||||||
| 2026-02-06 | 13F | HighTower Advisors, LLC | 29.490 | 751 | ||||||
| 2026-01-27 | 13F/A | Capital Performance Advisors Llp | 33.042 | 5,94 | 842 | 6,73 | ||||
| 2026-01-23 | 13F | Assetmark, Inc | 1.128.678 | 5,04 | 28.759 | 5,83 | ||||
| 2026-02-11 | 13F | Capital International Investors | 59.363.041 | 1,51 | 1.512.570 | 2,27 | ||||
| 2026-02-06 | 13F | BlueStem Wealth Partners, LLC | 75.965 | 589,02 | 1.936 | 596,04 | ||||
| 2026-04-09 | 13F | Stewardship Concepts Financial Services Llc | 19.531 | 495 | ||||||
| 2026-02-11 | 13F | Gwn Securities Inc. | 44.627 | 40,31 | 1.137 | 41,42 | ||||
| 2026-02-11 | 13F | Cerity Partners LLC | 25.555 | 651 | ||||||
| 2026-02-11 | 13F | LPL Financial LLC | 2.976.899 | 52,75 | 75.851 | 53,89 | ||||
| 2026-02-13 | 13F | Flow Traders U.s. Llc | 13.015 | -49,45 | 0 | |||||
| 2026-02-12 | 13F | Steward Partners Investment Advisory, Llc | 358.697 | 9,60 | 9.140 | 10,43 | ||||
| 2026-02-17 | 13F | Advisor Group Holdings, Inc. | 652.379 | -2,11 | 16.623 | -1,07 | ||||
| 2026-02-23 | 13F | Continental Investors Services, Inc. | 41.428 | -4,39 | 1.050 | -5,24 | ||||
| 2026-02-02 | 13F | Eq Wealth Advisors, Llc | 15.483 | 2,35 | 395 | 3,14 | ||||
| 2026-02-13 | 13F | Advyzon Investment Management, LLC | 52.618 | 133,60 | 1.341 | 135,50 | ||||
| 2026-02-17 | 13F | Old Mission Capital Llc | 0 | -100,00 | 0 | |||||
| 2026-02-13 | 13F | Jacobi Capital Management LLC | 22.792 | 8,79 | 581 | 9,64 | ||||
| 2026-01-13 | 13F | LongView Wealth Management | 49.264 | 0,04 | 1.262 | 1,29 | ||||
| 2026-02-10 | 13F | Envestnet Asset Management Inc | 10.600.380 | 10,18 | 270.098 | 11,01 | ||||
| 2026-02-13 | 13F | Mosaic Family Wealth Partners, Llc | 42.379 | 1.080 | ||||||
| 2026-02-06 | 13F | Cullen/frost Bankers, Inc. | 94.316 | 4,58 | 2.403 | 5,39 | ||||
| 2026-02-13 | 13F | Smartleaf Asset Management LLC | 25.129 | 640 | ||||||
| 2026-01-20 | 13F | AdvisorNet Financial, Inc | 10.835 | 11,01 | 276 | 12,20 | ||||
| 2026-02-13 | 13F | RFP Financial Group LLC | 83.621 | 21,23 | 2.131 | 22,13 | ||||
| 2026-02-06 | 13F | Envestnet Portfolio Solutions, Inc. | 331.008 | 10,17 | 8.434 | 11,00 | ||||
| 2026-03-23 | 13F | J. Derek Lewis & Associates Inc. | 527.322 | 13.436 | ||||||
| 2025-10-30 | 13F | Oak Hill Wealth Advisors, Llc | 22.078 | 78,62 | 558 | 83,55 | ||||
| 2026-02-11 | 13F | Vise Technologies, Inc. | 18.455 | 470 | ||||||
| 2026-02-13 | 13F | Morgan Stanley | 1 | 0 | ||||||
| 2026-04-08 | 13F | First Heartland Consultants, Inc. | 16.215 | 8,18 | 411 | 7,61 | ||||
| 2026-02-04 | 13F | Pensionmark Financial Group, Llc | 23.331 | 72,64 | 583 | 70,67 | ||||
| 2026-04-09 | 13F | Thrive Wealth Management, LLC | 45.071 | 20,86 | 1.141 | 20,11 | ||||
| 2026-04-14 | 13F | Nbc Securities, Inc. | 10.270 | 0,00 | 260 | -0,38 | ||||
| 2026-01-29 | 13F | Comerica Bank | 6.066 | 44,77 | 155 | 46,67 | ||||
| 2026-04-14 | 13F | Prospera Financial Services Inc | 31.058 | 5,91 | 786 | 5,22 | ||||
| 2026-02-12 | 13F | von Borstel & Associates, Inc. | 0 | -100,00 | 0 | |||||
| 2026-04-14 | 13F | Wealthcare Advisory Partners LLC | 119.651 | 6,34 | 3.030 | 5,65 | ||||
| 2026-02-09 | 13F | Harbour Investments, Inc. | 62.155 | 27,74 | 1.584 | 28,70 | ||||
| 2026-02-17 | 13F | Wiley Bros.-aintree Capital, Llc | 97.040 | 36,69 | 2.472 | 37,66 | ||||
| 2026-04-13 | 13F | St Germain D J Co Inc | 55.805 | 112,28 | 1.413 | 111,06 | ||||
| 2026-02-12 | 13F | Commonwealth Equity Services, Llc | 758.527 | 26,72 | 19.327 | 128.746,67 | ||||
| 2026-02-17 | 13F | GeoWealth Management, LLC | 12.088 | 89,70 | 308 | 90,68 | ||||
| 2026-02-13 | 13F | Kestra Advisory Services, LLC | 0 | -100,00 | 0 | |||||
| 2026-04-07 | 13F | Park Avenue Securities Llc | 173.490 | 4 | ||||||
| 2026-02-10 | 13F | Vantus Wealth LLC | 12.362 | 315 | ||||||
| 2026-04-10 | 13F | Capital Investment Management, Inc. | 98.784 | 2.517 | ||||||
| 2026-01-30 | 13F | Us Bancorp \de\ | 2.387 | 61 | ||||||
| 2026-02-12 | 13F | Insigneo Advisory Services, Llc | 10.123 | 0,00 | 258 | 0,39 | ||||
| 2026-01-28 | 13F | Financial Perspectives, Inc | 1.235 | 1,15 | 31 | 3,33 | ||||
| 2026-02-03 | 13F | Diversify Wealth Management, Llc | 8.043 | 206 | ||||||
| 2026-04-13 | 13F | Creative Financial Designs Inc /adv | 174 | -90,55 | 4 | -91,30 | ||||
| 2026-01-20 | 13F | Stratos Wealth Partners, LTD. | 0 | -100,00 | 0 | |||||
| 2026-01-28 | 13F | Geneos Wealth Management Inc. | 5.310 | 23,20 | 135 | 23,85 | ||||
| 2026-02-17 | 13F | Citadel Advisors Llc | 174.435 | 134,82 | 4.445 | 136,63 | ||||
| 2026-02-13 | 13F | Sei Investments Co | 125.681 | 50,63 | 3.202 | 51,75 | ||||
| 2026-01-28 | 13F | Walleye Partners, LLC | 11.756 | 300 | ||||||
| 2026-02-12 | 13F | CIBC Private Wealth Group, LLC | 1.907 | 0,00 | 49 | 0,00 | ||||
| 2026-02-13 | 13F | Venture Visionary Partners LLC | 21.088 | 1,16 | 537 | 1,90 | ||||
| 2026-01-29 | 13F | First Interstate Bank | 160.990 | 4.102 | ||||||
| 2026-02-11 | 13F | OneAscent Financial Services LLC | 11.326 | -25,84 | 289 | -25,39 | ||||
| 2026-01-26 | 13F | Cwm, Llc | 289 | 0 | ||||||
| 2026-02-13 | 13F | Arkadios Wealth Advisors | 32.065 | -2,49 | 817 | -1,68 | ||||
| 2026-01-30 | 13F | Simplicity Wealth,LLC | 77.425 | -3,22 | 1.973 | -2,52 | ||||
| 2026-02-17 | 13F | Equitable Holdings, Inc. | 14.612 | 70,84 | 372 | 72,22 | ||||
| 2026-02-13 | 13F | Stifel Financial Corp | 32.381 | 825 | ||||||
| 2026-02-10 | 13F | Thoroughbred Financial Services, Llc | 60.351 | 73,67 | 2 | |||||
| 2026-01-30 | 13F | Prentice Wealth Management LLC | 171.470 | 123,41 | 4.369 | 125,09 | ||||
| 2026-02-12 | 13F | Strata Wealth Advisors, LLC | 277.066 | 0,93 | 7.060 | 1,69 | ||||
| 2026-02-13 | 13F | Wells Fargo & Company/mn | 1 | 0 | ||||||
| 2026-02-06 | 13F | Keudell/Morrison Wealth Management | 219.909 | 49,86 | 5.603 | 55,04 | ||||
| 2026-02-10 | 13F/A | Northwestern Mutual Wealth Management Co | 239.778 | 368,36 | 6.110 | 372,10 | ||||
| 2026-02-11 | 13F | Capital Group Private Client Services, Inc. | 245.620 | -0,40 | 6.258 | 0,35 | ||||
| 2026-02-12 | 13F | Founders Financial Alliance, LLC | 30.000 | 0,00 | 764 | 0,79 | ||||
| 2025-11-14 | 13F | Bank Of America Corp /de/ | 0 | -100,00 | 0 | |||||
| 2026-01-23 | 13F | Financial Connections Group, Inc. | 50.948 | -0,15 | 1 | 0,00 | ||||
| 2026-02-06 | 13F | Gutierrez Wealth Advisory, LLC | 219.915 | 10,32 | 5.603 | 11,15 | ||||
| 2026-02-12 | 13F | Wayfinding Financial, LLC | 0 | -100,00 | 0 | |||||
| 2026-02-12 | 13F | Principal Securities, Inc. | 378.269 | 42,79 | 9.638 | 43,87 | ||||
| 2026-02-17 | 13F | Advisory Services Network, LLC | 0 | -100,00 | 0 | -100,00 | ||||
| 2025-11-14 | 13F | Elequin Capital Lp | 0 | -100,00 | 0 | |||||
| 2026-04-13 | 13F | Massmutual Trust Co Fsb/adv | 430 | 11 | ||||||
| 2026-01-29 | 13F | Camelot Portfolios, LLC | 2.613 | 67 | ||||||
| 2026-02-12 | 13F | Carson Advisory Inc. | 8.326 | 212 | ||||||
| 2026-02-05 | 13F | Cambridge Investment Research Advisors, Inc. | 1.643.882 | 835,59 | 42 | 925,00 | ||||
| 2026-04-08 | 13F | Wealth Enhancement Advisory Services, Llc | 7.916 | 201 | ||||||
| 2026-02-05 | 13F | Mission Wealth Management, Lp | 12.610 | 321 | ||||||
| 2026-01-06 | 13F | Freedom Financial Partners LLC | 12.576 | 4,04 | 320 | 4,92 | ||||
| 2026-02-18 | 13F | GWM Advisors LLC | 0 | -100,00 | 0 | |||||
| 2025-11-14 | 13F | Wood Tarver Financial Group, LLC | 0 | -100,00 | 0 | |||||
| 2026-02-10 | 13F | Goldman Sachs Group Inc | 24.464 | 26,57 | 623 | 27,66 | ||||
| 2026-02-12 | 13F | Jane Street Group, Llc | 202.258 | 723,66 | 5.154 | 729,79 | ||||
| 2026-01-21 | 13F | Flagship Harbor Advisors, Llc | 2.656 | 68 | ||||||
| 2026-01-28 | 13F | Confluence Wealth Services, Inc. | 698.946 | 10,70 | 17.809 | 11,54 | ||||
| 2026-02-12 | 13F | Summit Financial, LLC | 15.200 | 1,50 | 387 | 2,38 | ||||
| 2026-02-12 | 13F | Wedbush Securities Inc | 68.435 | -0,19 | 2 | 0,00 | ||||
| 2026-04-07 | 13F | Farther Finance Advisors, LLC | 9.468 | 34,81 | 240 | 34,83 | ||||
| 2026-02-03 | 13F | We Are One Seven, LLC | 18.302 | 466 | ||||||
| 2026-02-13 | 13F | Transamerica Financial Advisors, Inc. | 47.867 | 1.220 | ||||||
| 2026-02-17 | 13F | Captrust Financial Advisors | 142.960 | 29,27 | 3.643 | 30,26 | ||||
| 2026-04-07 | 13F | CoreCap Advisors, LLC | 175 | 0,57 | 4 | 0,00 | ||||
| 2026-02-10 | 13F | NewCorp Financial Services, Inc. | 46.013 | 1.172 | ||||||
| 2026-02-17 | 13F | Ameriflex Group, Inc. | 0 | -100,00 | 0 | |||||
| 2026-02-06 | 13F | Platt Wealth Management LLC | 174.255 | 4 | ||||||
| 2026-03-10 | 13F | Advisortrust Partners, Llc | 10.089 | 257 | ||||||
| 2026-01-23 | 13F | HBW Advisory Services LLC | 11.036 | 281 | ||||||
| 2026-01-29 | 13F | D.a. Davidson & Co. | 22.814 | 581 | ||||||
| 2026-04-06 | 13F | CX Institutional | 354 | -2,21 | 0 | |||||
| 2026-02-04 | 13F | Midwest Heritage Bank, FSB | 27.074 | 83,04 | 690 | 84,22 | ||||
| 2026-02-05 | 13F | Atria Investments Llc | 16.041 | -7,08 | 409 | -6,42 | ||||
| 2026-01-29 | 13F | Ashton Thomas Private Wealth, LLC | 10.599 | 13,65 | 270 | 14,89 | ||||
| 2026-02-11 | 13F | Gateway Wealth Partners, LLC | 35.021 | 34,23 | 892 | 35,36 | ||||
| 2026-02-11 | 13F | Capital Analysts, Inc. | 108.589 | 50,68 | 3 | 100,00 | ||||
| 2026-01-22 | 13F | Vicus Capital | 56.311 | 19,67 | 1.435 | 20,61 | ||||
| 2026-04-14 | 13F | Opal Wealth Advisors, LLC | 7.808 | 198 | ||||||
| 2026-02-06 | 13F | Global Retirement Partners, LLC | 21.560 | 2,45 | 549 | 3,20 | ||||
| 2026-01-23 | 13F | Capital Planning LLC | 20.122 | 0,00 | 513 | 0,79 | ||||
| 2026-02-11 | 13F | Janney Montgomery Scott LLC | 724.130 | 4,12 | 18 | 5,88 | ||||
| 2026-02-13 | 13F | Ausdal Financial Partners, Inc. | 14.524 | 4,99 | 370 | 6,02 | ||||
| 2026-01-29 | 13F | UBS Group AG | 1.844 | 0,00 | 47 | 0,00 | ||||
| 2026-01-12 | 13F | Uhlmann Price Securities, Llc | 25.782 | 29,33 | 657 | 30,16 | ||||
| 2026-02-13 | 13F | Mml Investors Services, Llc | 1.241.523 | 12,27 | 31.634 | 13,11 | ||||
| 2026-02-18 | 13F | Hanlon Investment Management, Inc. | 32.190 | 0,97 | 820 | 1,74 | ||||
| 2026-02-11 | 13F | Jpmorgan Chase & Co | 13.772 | 23,22 | 351 | 24,11 | ||||
| 2026-02-17 | 13F | Perennial Investment Advisors, LLC | 53.977 | 18,04 | 1.375 | 18,94 | ||||
| 2026-01-26 | 13F | Merit Financial Group, LLC | 10.156 | 13,03 | 259 | 13,66 | ||||
| 2026-02-13 | 13F | Clarity Asset Management, Inc. | 828 | 21 | ||||||
| 2026-02-12 | 13F | Brinker Capital Investments, LLC | 695.772 | 5,88 | 17.728 | 6,68 | ||||
| 2026-02-17 | 13F | Tower Research Capital LLC (TRC) | 5.191 | 132 | ||||||
| 2026-02-14 | 13F | Silver Grove Financial Group, Inc. | 8.683 | -3,24 | 221 | -2,21 | ||||
| 2026-02-02 | 13F | Truist Financial Corp | 587.828 | 11,85 | 14.978 | 12,69 | ||||
| 2026-02-10 | 13F | Natixis Advisors, L.p. | 87.162 | 128,75 | 2 | |||||
| 2026-01-26 | 13F | AE Wealth Management LLC | 4.454 | 113 | ||||||
| 2026-02-03 | 13F | International Assets Investment Management, Llc | 13.640 | 63,84 | 348 | 69,27 | ||||
| 2026-02-03 | 13F | Koshinski Asset Management, Inc. | 244.047 | 37,08 | 6.218 | 38,12 | ||||
| 2026-01-20 | 13F | Ascent Group, LLC | 25.973 | 0,63 | 662 | 1,38 | ||||
| 2026-02-06 | 13F | Vestmark Advisory Solutions, Inc. | 1.386.911 | 6,51 | 35.338 | 7,31 | ||||
| 2026-01-08 | 13F | Financial Management Network Inc | 15.357 | 1,01 | 391 | 1,56 | ||||
| 2026-01-30 | 13F | Barnes Pettey Financial Advisors, Llc | 19.413 | 495 | ||||||
| 2026-02-17 | 13F | Private Advisor Group, LLC | 53.646 | 61,84 | 1.367 | 63,01 | ||||
| 2026-01-28 | 13F | EnRich Financial Partners LLC | 12.918 | 329 | ||||||
| 2026-02-17 | 13F | Jones Financial Companies Lllp | 231.814 | 77,63 | 5.907 | 78,92 |