Grundlæggende statistik
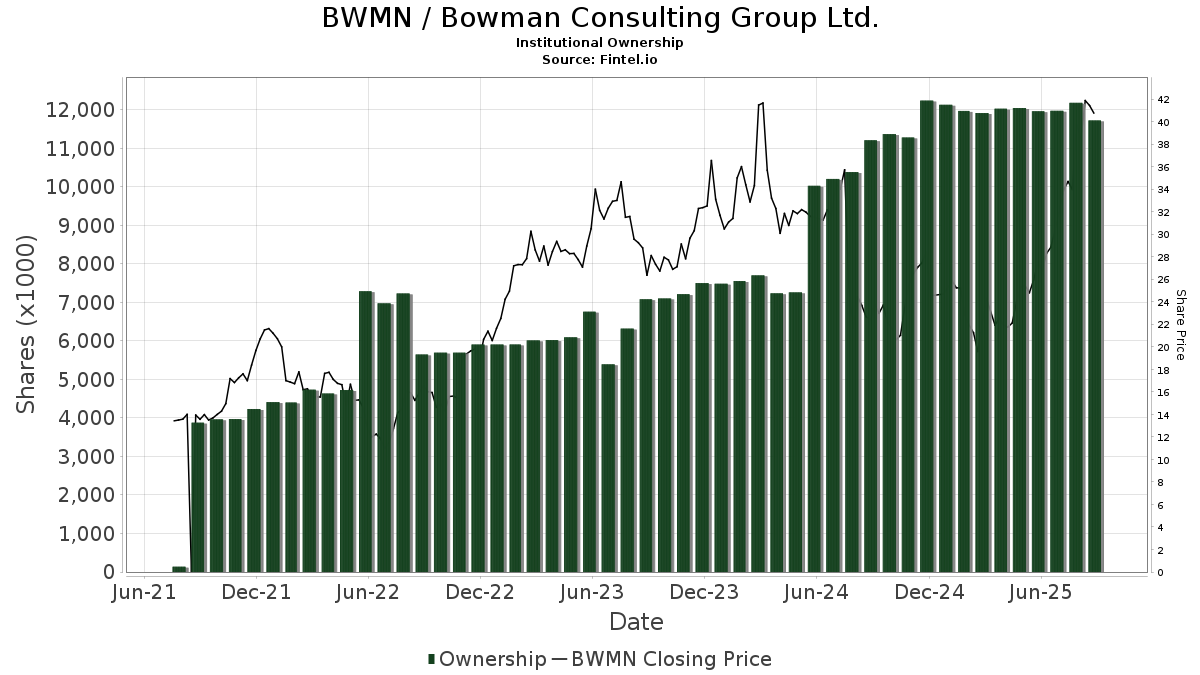
| Institutionelle aktier (lange) | 11.215.180 - 65,50% (ex 13D/G) - change of -1,45MM shares -11,47% MRQ |
| Institutionel værdi (lang) | $ 363.695 USD ($1000) |
Institutionelt ejerskab og aktionærer
Bowman Consulting Group Ltd. (US:BWMN) har 131 institutionelle ejere og aktionærer, der har indsendt 13D/G- eller 13F-formularer til Securities Exchange Commission (SEC). Disse institutioner har i alt 11,215,180 aktier. Største aktionærer omfatter Fmr Llc, BlackRock, Inc., Vanguard Group Inc, Swedbank AB, Pembroke Management, LTD, Bank Of America Corp /de/, Summit Creek Advisors LLC, Geode Capital Management, Llc, Dimensional Fund Advisors Lp, and Polar Asset Management Partners Inc. .
Bowman Consulting Group Ltd. (NasdaqGM:BWMN) institutionel ejerskabsstruktur viser aktuelle positioner i virksomheden efter institutioner og fonde, samt seneste ændringer i positionsstørrelse. Større aktionærer kan omfatte individuelle investorer, investeringsforeninger, hedgefonde eller institutioner. Skema 13D angiver, at investoren besidder (eller besidder) mere end 5 % af virksomheden og har til hensigt (eller har til hensigt at) aktivt at forfølge en ændring i forretningsstrategi. Skema 13G indikerer en passiv investering på over 5%.
The share price as of April 24, 2026 is 31,86 / share. Previously, on April 28, 2025, the share price was 22,07 / share. This represents an increase of 44,36% over that period.
Fondens stemningsscore
Fund Sentiment Score (fka Ownership Accumulation Score) finder de aktier, der bliver mest købt af fonde. Det er resultatet af en sofistikeret, multi-faktor kvantitativ model, der identificerer virksomheder med de højeste niveauer af institutionel akkumulering. Scoringsmodellen bruger en kombination af den samlede stigning i oplyste ejere, ændringerne i porteføljeallokeringer i disse ejere og andre målinger. Tallet går fra 0 til 100, hvor højere tal indikerer et højere niveau af akkumulering for sine jævnaldrende, og 50 er gennemsnittet.
Opdateringsfrekvens: Dagligt
Se Ownership Explorer, som giver en liste over højest rangerende virksomheder.
AI+ Ask Fintel’s AI assistant about Bowman Consulting Group Ltd..
Select a question to share a public post with an AI-crafted answer.
Thinking of good questions…
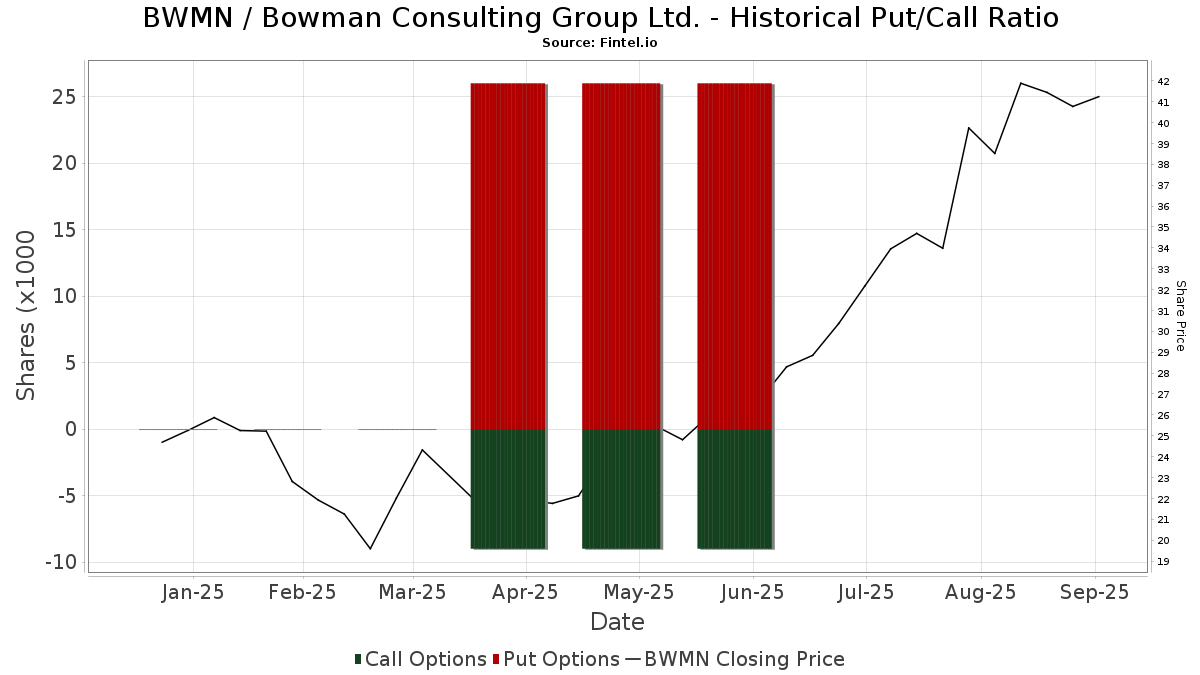
Institutionel Put/Call-forhold
Ud over at indberette standardaktie- og gældsudstedelser skal institutter med mere end 100 mill. aktiver under forvaltning også oplyse deres put- og call-optionsbeholdninger. Da salgsoptioner generelt indikerer negativ stemning, og købsoptioner indikerer positiv stemning, kan vi få en fornemmelse af den overordnede institutionelle stemning ved at plotte forholdet mellem put og kald. Diagrammet til højre viser det historiske put/call-forhold for dette instrument.
Brug af Put/Call Ratio som en indikator for investorernes stemning overvinder en af de vigtigste mangler ved at bruge totalt institutionelt ejerskab, som er, at en betydelig mængde af aktiver under forvaltning investeres passivt for at spore indekser. Passivt forvaltede fonde køber typisk ikke optioner, så indikatoren for put/call-forholdet følger mere nøje følelsen af aktivt forvaltede fonde.
13F og NPORT arkivering
Detaljer om 13F-arkivering er gratis. Detaljer om NP-ansøgninger kræver et premium-medlemskab. Grønne rækker angiver nye positioner. Røde rækker angiver lukkede positioner. Klik på linket ikon for at se den fulde transaktionshistorik.
Opgrader
for at låse premium-data op og eksportere til Excel ![]() .
.
| Fil dato | Kilde | Investor | Type | Gennemsnitlig pris (Øst) |
Aktier | Δ Aktier (%) |
Rapporteret Værdi ($1000) |
Δ Værdi (%) |
Port Alloc (%) |
|
|---|---|---|---|---|---|---|---|---|---|---|
| 2026-02-17 | 13F | Jump Financial, LLC | 0 | -100,00 | 0 | |||||
| 2026-02-11 | 13F | Los Angeles Capital Management Llc | 58.551 | -5,57 | 2.534 | -3,54 | ||||
| 2026-02-09 | 13F | Emerald Mutual Fund Advisers Trust | 77.533 | 92,12 | 2.560 | 49,80 | ||||
| 2026-02-10 | 13F | Goldman Sachs Group Inc | 70.135 | 11,62 | 2.316 | -13,00 | ||||
| 2026-04-16 | 13F | ARS Investment Partners, LLC | 0 | -100,00 | 0 | |||||
| 2026-01-30 | 13F | Precision Wealth Strategies, LLC | 10.934 | 361 | ||||||
| 2026-02-17 | 13F | Susquehanna International Group, Llp | 0 | -100,00 | 0 | |||||
| 2026-02-17 | 13F | Massar Capital Management, LP | 0 | -100,00 | 0 | |||||
| 2026-02-09 | 13F | Emerald Advisers, Llc | 13.624 | 115,13 | 450 | 67,54 | ||||
| 2026-02-10 | 13F | Semanteon Capital Management, LP | 0 | -100,00 | 0 | |||||
| 2026-02-06 | 13F | Legato Capital Management LLC | 12.633 | 417 | ||||||
| 2026-02-10 | 13F | Rothschild Investment Llc | 6 | 20,00 | 0 | |||||
| 2026-02-10 | 13F | Intech Investment Management Llc | 8.552 | 14,98 | 282 | -10,48 | ||||
| 2026-02-17 | 13F | Zacks Investment Management | 0 | -100,00 | 0 | |||||
| 2026-02-04 | 13F | Pacific Ridge Capital Partners, LLC | 244.772 | -2,89 | 8.082 | -24,30 | ||||
| 2026-04-16 | 13F | SG Americas Securities, LLC | 0 | -100,00 | 0 | |||||
| 2026-02-13 | 13F | Citigroup Inc | 4.872 | 40,04 | 161 | 8,84 | ||||
| 2026-02-13 | 13F | Grandeur Peak Global Advisors, LLC | 30.880 | -6,73 | 1.020 | -27,32 | ||||
| 2026-02-09 | 13F | Geode Capital Management, Llc | 342.911 | 0,03 | 11.326 | -22,03 | ||||
| 2026-02-06 | 13F | Summit Creek Advisors LLC | 399.094 | 10,11 | 13.178 | -14,17 | ||||
| 2026-02-13 | 13F | Barclays Plc | 32.087 | 6,20 | 1.060 | -17,20 | ||||
| 2026-02-17 | 13F | Advisor Group Holdings, Inc. | 567 | 3,47 | 19 | -18,18 | ||||
| 2026-02-13 | 13F | Arrowstreet Capital, Limited Partnership | 170.677 | 9,71 | 5.636 | -14,49 | ||||
| 2025-11-12 | 13F | Us Bancorp \de\ | 0 | -100,00 | 0 | |||||
| 2026-02-17 | 13F | Lazard Asset Management Llc | 98.439 | 141,67 | 3.250 | 88,41 | ||||
| 2026-01-15 | 13F | Nisa Investment Advisors, Llc | 317 | 0,00 | 10 | -23,08 | ||||
| 2026-02-09 | 13F | Quest Partners LLC | 1.096 | 0,00 | 36 | -21,74 | ||||
| 2026-02-12 | 13F | BlackRock, Inc. | 1.542.779 | 10,23 | 50.943 | -14,08 | ||||
| 2026-02-12 | 13F | MetLife Investment Management, LLC | 8.630 | 0,00 | 285 | -22,19 | ||||
| 2026-02-12 | 13F | Voya Investment Management Llc | 7.677 | -21,35 | 253 | -38,74 | ||||
| 2026-02-12 | 13F | Pembroke Management, LTD | 439.401 | -2,13 | 14.509 | -23,71 | ||||
| 2026-02-03 | 13F | B. Riley Financial, Inc. | 0 | -100,00 | 0 | -100,00 | ||||
| 2026-02-13 | 13F | Dynamic Technology Lab Private Ltd | 19.334 | 27,20 | 638 | -0,93 | ||||
| 2026-02-17 | 13F | Alliancebernstein L.p. | 188.071 | -64,17 | 6.210 | -72,07 | ||||
| 2026-02-17 | 13F | Fmr Llc | 2.583.531 | -0,16 | 85.308 | -22,17 | ||||
| 2026-02-10 | 13F | State of Wyoming | 6.215 | 205 | ||||||
| 2026-02-13 | 13F | State Street Corp | 278.504 | 4,83 | 9.196 | -18,28 | ||||
| 2026-02-17 | 13F | Boothbay Fund Management, Llc | 0 | -100,00 | 0 | |||||
| 2026-02-17 | 13F | Per Stirling Capital Management, LLC. | 31.134 | -28,98 | 1.028 | -44,64 | ||||
| 2026-01-22 | 13F | Brookwood Investment Group LLC | 20.690 | 0,00 | 683 | -22,03 | ||||
| 2026-02-11 | 13F | Franklin Resources Inc | 10.385 | 0,93 | 343 | -21,38 | ||||
| 2026-02-17 | 13F | Optiver Holding B.V. | 90 | -19,64 | 3 | -50,00 | ||||
| 2026-02-12 | 13F | Skopos Labs, Inc. | 0 | -100,00 | 0 | -100,00 | ||||
| 2026-04-24 | 13F | Root Financial Partners, LLC | 25 | 1 | ||||||
| 2026-02-17 | 13F | XTX Topco Ltd | 18.183 | 600 | ||||||
| 2026-02-13 | 13F | Caxton Associates Llp | 6.798 | 0,00 | 224 | -21,95 | ||||
| 2026-02-12 | 13F | Renaissance Technologies Llc | 56.000 | -11,95 | 1.849 | -31,37 | ||||
| 2026-02-05 | 13F | Allworth Financial LP | 51 | 2.450,00 | 2 | |||||
| 2026-02-09 | 13F/A | Swedbank AB | 450.000 | 0,00 | 14.859 | -22,05 | ||||
| 2026-02-18 | 13F | GWM Advisors LLC | 0 | -100,00 | 0 | |||||
| 2026-02-11 | 13F | Jpmorgan Chase & Co | 34.362 | -65,74 | 1.135 | -73,31 | ||||
| 2026-02-09 | 13F | Royce & Associates Lp | 64.837 | 2.141 | ||||||
| 2026-04-07 | 13F | Farther Finance Advisors, LLC | 120 | 4 | ||||||
| 2026-02-13 | 13F | Wells Fargo & Company/mn | 15.494 | 75,23 | 512 | 36,63 | ||||
| 2026-02-05 | 13F | Amalgamated Bank | 442 | -6,75 | 0 | |||||
| 2026-02-17 | 13F | Northern Trust Corp | 126.331 | -4,45 | 4.171 | -25,52 | ||||
| 2026-04-14 | 13F | Moisand Fitzgerald Tamayo, LLC | 190 | -3,06 | 5 | -16,67 | ||||
| 2026-02-06 | 13F | Pnc Financial Services Group, Inc. | 3 | 0,00 | 0 | |||||
| 2026-02-17 | 13F | California State Teachers Retirement System | 866 | -14,43 | 29 | -33,33 | ||||
| 2026-02-17 | 13F | Tower Research Capital LLC (TRC) | 789 | 13,36 | 26 | -10,34 | ||||
| 2026-04-06 | 13F | GAMMA Investing LLC | 572 | 1,42 | 16 | -11,11 | ||||
| 2026-04-20 | 13F | State of Alaska, Department of Revenue | 2.599 | 0,00 | 0 | |||||
| 2026-02-17 | 13F | Ancora Advisors, LLC | 15.546 | 0,00 | 513 | -22,04 | ||||
| 2026-02-13 | 13F | Stifel Financial Corp | 18.117 | 11,43 | 598 | -13,08 | ||||
| 2026-02-11 | 13F | Deutsche Bank Ag\ | 9.473 | 4,92 | 313 | -18,32 | ||||
| 2026-02-04 | 13F | Bailard, Inc. | 8.012 | 265 | ||||||
| 2026-02-09 | 13F | Legal & General Group Plc | 1.456 | -4,77 | 48 | -25,00 | ||||
| 2026-02-17 | 13F | Jones Financial Companies Lllp | 50 | 2 | ||||||
| 2026-02-17 | 13F | Occudo Quantitative Strategies Lp | 0 | -100,00 | 0 | |||||
| 2026-04-17 | 13F | Novare Capital Management Llc | 32.600 | 0,00 | 927 | -13,85 | ||||
| 2026-02-12 | 13F | Federated Hermes, Inc. | 32.745 | 26,42 | 1.081 | -1,46 | ||||
| 2026-02-17 | 13F | Creative Planning | 13.296 | -3,78 | 439 | -24,96 | ||||
| 2025-11-14 | 13F | Cubist Systematic Strategies, LLC | 17.602 | -14,40 | 746 | 26,06 | ||||
| 2026-02-17 | 13F | Susquehanna International Group, Llp | Put | 8.800 | -62,87 | 291 | -71,09 | |||
| 2026-02-17 | 13F | Susquehanna International Group, Llp | Call | 14.700 | -8,12 | 485 | -28,36 | |||
| 2026-02-12 | 13F | Quadrant Capital Group Llc | 32 | 0,00 | 1 | 0,00 | ||||
| 2026-02-17 | 13F | Cetera Investment Advisers | 57.575 | -2,45 | 1.901 | -23,96 | ||||
| 2026-02-10 | 13F | Globeflex Capital L P | 17.661 | -16,37 | 583 | -34,79 | ||||
| 2026-02-17 | 13F | Citadel Advisors Llc | Call | 8.300 | 0,00 | 274 | -21,94 | |||
| 2026-02-17 | 13F | Qube Research & Technologies Ltd | 12.378 | 409 | ||||||
| 2026-02-06 | 13F | Covestor Ltd | 38 | -37,70 | 0 | |||||
| 2026-02-13 | 13F | Marshall Wace, Llp | 88.677 | 2.928 | ||||||
| 2025-11-14 | 13F | Raymond James Financial Inc | 0 | -100,00 | 0 | |||||
| 2026-02-13 | 13F | Walleye Capital LLC | 0 | -100,00 | 0 | |||||
| 2026-04-16 | 13F | Toth Financial Advisory Corp | 230 | 0,00 | 7 | -14,29 | ||||
| 2026-04-24 | 13F | Strs Ohio | 18.100 | 7,10 | 515 | -7,89 | ||||
| 2026-02-17 | 13F | Quantinno Capital Management LP | 9.543 | 65,85 | 315 | 29,63 | ||||
| 2026-02-12 | 13F | Integrated Quantitative Investments LLC | 25.833 | 202,35 | 853 | 136,29 | ||||
| 2026-02-02 | 13F | Kornitzer Capital Management Inc /ks | 41.175 | -14,22 | 1.360 | -33,15 | ||||
| 2026-02-13 | 13F | Parkside Financial Bank & Trust | 60 | 0,00 | 2 | -50,00 | ||||
| 2026-02-13 | 13F | Charles Schwab Investment Management Inc | 118.594 | -0,10 | 3.916 | -22,14 | ||||
| 2026-04-06 | 13F | Versant Capital Management, Inc | 510 | 40,50 | 15 | 27,27 | ||||
| 2026-02-10 | 13F | Bnp Paribas Arbitrage, Sa | 34.721 | 16,67 | 1.146 | -9,05 | ||||
| 2026-04-13 | 13F | IFP Advisors, Inc | 4 | 33,33 | 0 | |||||
| 2026-02-12 | 13F | Dimensional Fund Advisors Lp | 334.175 | 9,57 | 11.036 | -14,58 | ||||
| 2026-02-17 | 13F | Polar Asset Management Partners Inc. | 285.024 | 30,15 | 9.411 | 1,46 | ||||
| 2026-02-17 | 13F | Point72 Asset Management, L.P. | 6.629 | 182,81 | 219 | 120,20 | ||||
| 2026-02-17 | 13F | Russell Investments Group, Ltd. | 129.863 | 44,16 | 4.288 | 12,40 | ||||
| 2026-02-12 | 13F | New York State Common Retirement Fund | 4.491 | 0,00 | 148 | -22,11 | ||||
| 2026-02-11 | 13F | Ameritas Investment Partners, Inc. | 1.174 | 39 | ||||||
| 2025-11-14 | 13F | Imprint Wealth LLC | 0 | -100,00 | 0 | |||||
| 2026-02-10 | 13F | Acadian Asset Management Llc | 182.182 | 15,18 | 6 | 0,00 | ||||
| 2026-02-17 | 13F | Polymer Capital Management (US) LLC | 7.225 | 15,30 | 239 | -10,19 | ||||
| 2026-01-16 | 13F | Ellsworth Advisors, LLC | 0 | -100,00 | 0 | -100,00 | ||||
| 2026-02-13 | 13F | Pathstone Holdings, LLC | 0 | -100,00 | 0 | |||||
| 2026-02-17 | 13F | MIRAE ASSET GLOBAL ETFS HOLDINGS Ltd. | 6.506 | 0,90 | 215 | -21,61 | ||||
| 2026-04-24 | 13F | Conestoga Capital Advisors, LLC | 66.530 | 16,12 | 1.892 | 0,05 | ||||
| 2026-04-23 | 13F | North Star Investment Management Corp. | 32.000 | 910 | ||||||
| 2026-02-19 | 13F | Invesco Ltd. | 10.954 | 35,20 | 362 | 5,25 | ||||
| 2026-04-22 | 13F | Sterling Capital Management LLC | 111 | -21,28 | 3 | -25,00 | ||||
| 2026-01-30 | 13F | New York State Teachers Retirement System | 1.284 | 0 | ||||||
| 2026-02-13 | 13F | Verition Fund Management LLC | 0 | -100,00 | 0 | |||||
| 2026-02-12 | 13F | Groupe la Francaise | 13.000 | 0,00 | 429 | -22,14 | ||||
| 2026-04-13 | 13F | True Wealth Design, LLC | 8 | 0,00 | 0 | |||||
| 2026-02-13 | 13F | Manufacturers Life Insurance Company, The | 0 | -100,00 | 0 | |||||
| 2026-02-17 | 13F | State Of Wisconsin Investment Board | 18.837 | 115,90 | 622 | 68,29 | ||||
| 2026-02-12 | 13F | Sfam, Llc | 95 | 3 | ||||||
| 2026-02-17 | 13F | Royal Bank Of Canada | 22.241 | -2,55 | 734 | -24,02 | ||||
| 2026-02-17 | 13F | Perritt Capital Management Inc | 23.690 | 0,00 | 782 | -22,03 | ||||
| 2026-02-02 | 13F | Breakwater Investment Management | 14 | 0 | ||||||
| 2026-01-29 | 13F | Vanguard Group Inc | 838.618 | 4,44 | 27.691 | -18,59 | ||||
| 2026-02-13 | 13F | Kestra Advisory Services, LLC | 675 | 22 | ||||||
| 2026-01-27 | 13F | Asset Management One Co., Ltd. | 76.697 | -20,83 | 2.620 | -36,17 | ||||
| 2026-01-29 | 13F | UBS Group AG | 66.676 | -18,16 | 2.202 | -36,22 | ||||
| 2026-02-02 | 13F | Principal Financial Group Inc | 15.482 | 43,67 | 511 | 12,06 | ||||
| 2025-11-14 | 13F | Mill Road Capital Management LLC | 0 | -100,00 | 0 | |||||
| 2026-02-12 | 13F | Jane Street Group, Llc | 18.418 | -56,62 | 608 | -66,18 | ||||
| 2026-02-13 | 13F | Smartleaf Asset Management LLC | 228 | 3,17 | 8 | -22,22 | ||||
| 2026-02-17 | 13F | Brevan Howard Capital Management LP | 0 | -100,00 | 0 | |||||
| 2026-02-17 | 13F/A | Sentinus, LLC | 23.690 | 782 | ||||||
| 2026-02-13 | 13F | SRS Capital Advisors, Inc. | 159 | 45,87 | 5 | 25,00 | ||||
| 2026-02-17 | 13F | SageView Advisory Group, LLC | 9 | 0 | ||||||
| 2026-02-10 | 13F | Quantbot Technologies LP | 0 | -100,00 | 0 | |||||
| 2026-04-02 | 13F | Byrne Asset Management LLC | 4.218 | 120 | ||||||
| 2026-02-17 | 13F | Aqr Capital Management Llc | 9.583 | 59,00 | 316 | 23,92 | ||||
| 2026-01-29 | 13F | Comerica Bank | 7.355 | -35,79 | 243 | -50,10 | ||||
| 2026-02-17 | 13F | Trexquant Investment LP | 28.193 | -28,93 | 931 | -44,64 | ||||
| 2026-02-17 | 13F | Bank Of America Corp /de/ | 407.057 | 1.056,02 | 13.441 | 801,48 | ||||
| 2026-02-17 | 13F | Citadel Advisors Llc | 0 | -100,00 | 0 | |||||
| 2026-04-07 | 13F | Signaturefd, Llc | 65 | 0,00 | 2 | -50,00 | ||||
| 2026-02-17 | 13F | Ameriprise Financial Inc | 129.790 | 57,49 | 4.286 | 22,78 | ||||
| 2026-02-06 | 13F | FourThought Financial Partners, LLC | 0 | -100,00 | 0 | |||||
| 2026-02-17 | 13F | Balyasny Asset Management Llc | 0 | -100,00 | 0 | |||||
| 2026-02-12 | 13F | Nuveen, LLC | 32.472 | 0,00 | 1.072 | -22,04 | ||||
| 2026-02-17 | 13F | Canada Pension Plan Investment Board | 17.000 | 561 | ||||||
| 2026-02-10 | 13F | Bank of New York Mellon Corp | 40.803 | 8,81 | 1.347 | -15,18 | ||||
| 2026-04-22 | 13F | Stone House Investment Management, LLC | 8 | 0,00 | 0 | |||||
| 2026-02-13 | 13F | Panagora Asset Management Inc | 16.039 | 69,71 | 530 | 32,25 | ||||
| 2026-01-26 | 13F | Cwm, Llc | 327 | 14,34 | 0 | |||||
| 2026-02-17 | 13F | Man Group plc | 0 | -100,00 | 0 | |||||
| 2026-02-17 | 13F | VARCOV Co. | 8.958 | 296 | ||||||
| 2026-02-10 | 13F | Keyvantage Wealth, Llc | 22.536 | 0,00 | 744 | -22,01 | ||||
| 2026-02-12 | 13F | EAM Investors, LLC | 0 | -100,00 | 0 | |||||
| 2026-02-17 | 13F | Tudor Investment Corp Et Al | 103.461 | 10,74 | 3.416 | -13,67 | ||||
| 2026-02-06 | 13F | EverSource Wealth Advisors, LLC | 5 | 0,00 | 0 | |||||
| 2026-02-17 | 13F | Price T Rowe Associates Inc /md/ | 16.880 | 5,40 | 1 | |||||
| 2026-02-13 | 13F | Morgan Stanley | 79.715 | -25,64 | 2.632 | -42,04 | ||||
| 2026-02-13 | 13F | Boston Partners | 17.125 | 51,08 | 565 | 17,71 | ||||
| 2026-02-13 | 13F | Rhumbline Advisers | 17.232 | -14,56 | 569 | -33,49 | ||||
| 2026-02-13 | 13F | Police & Firemen's Retirement System of New Jersey | 3.862 | 0,00 | 128 | -22,09 |