Grundlæggende statistik
| Institutionelle ejere | 170 total, 170 long only, 0 short only, 0 long/short - change of 3,03% MRQ |
| Gennemsnitlig porteføljeallokering | 0.5269 % - change of -6,95% MRQ |
| Institutionelle aktier (lange) | 42.232.745 (ex 13D/G) - change of 0,19MM shares 0,46% MRQ |
| Institutionel værdi (lang) | $ 1.047.218 USD ($1000) |
Institutionelt ejerskab og aktionærer
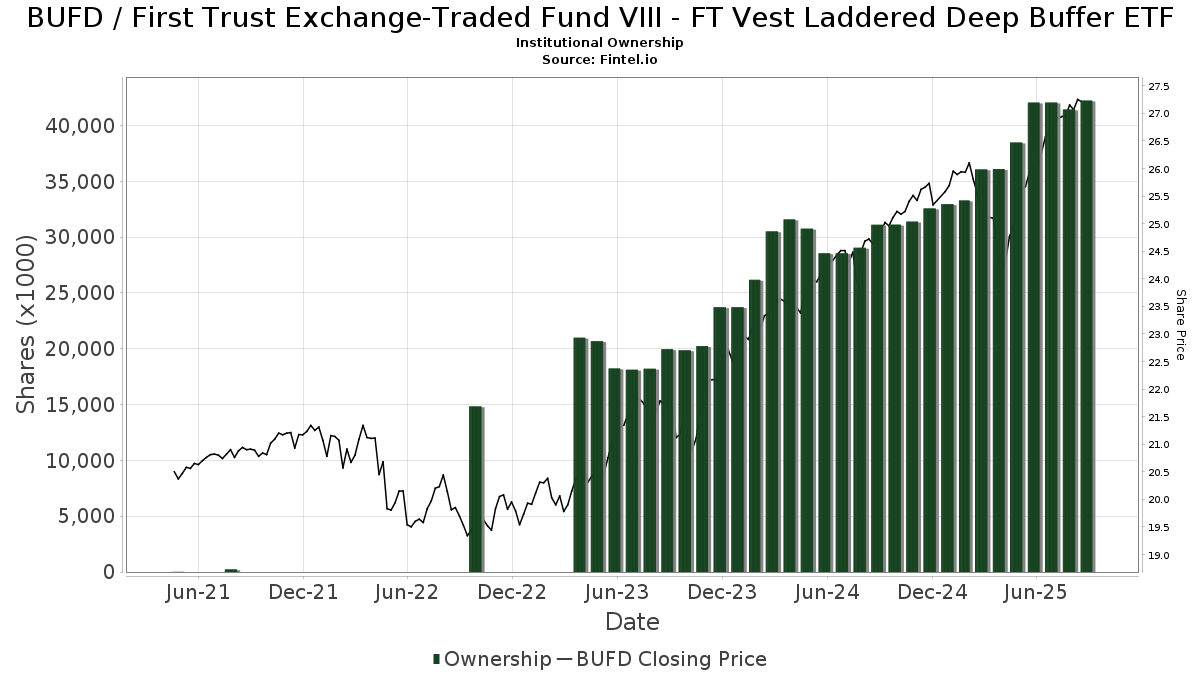
First Trust Exchange-Traded Fund VIII - FT Vest Laddered Deep Buffer ETF (US:BUFD) har 170 institutionelle ejere og aktionærer, der har indsendt 13D/G- eller 13F-formularer til Securities Exchange Commission (SEC). Disse institutioner har i alt 42,232,745 aktier. Største aktionærer omfatter LPL Financial LLC, Gw Henssler & Associates Ltd, Envestnet Asset Management Inc, Legacy Financial Group LLC, Centennial Wealth Advisory LLC, Advisor Group Holdings, Inc., Creekmur Asset Management LLC, Truist Financial Corp, Cetera Investment Advisers, and Commonwealth Equity Services, Llc .
First Trust Exchange-Traded Fund VIII - FT Vest Laddered Deep Buffer ETF (BATS:BUFD) institutionel ejerskabsstruktur viser aktuelle positioner i virksomheden efter institutioner og fonde, samt seneste ændringer i positionsstørrelse. Større aktionærer kan omfatte individuelle investorer, investeringsforeninger, hedgefonde eller institutioner. Skema 13D angiver, at investoren besidder (eller besidder) mere end 5 % af virksomheden og har til hensigt (eller har til hensigt at) aktivt at forfølge en ændring i forretningsstrategi. Skema 13G indikerer en passiv investering på over 5%.
The share price as of September 8, 2025 is 27,31 / share. Previously, on September 9, 2024, the share price was 24,56 / share. This represents an increase of 11,20% over that period.
Fondens stemningsscore
Fund Sentiment Score (fka Ownership Accumulation Score) finder de aktier, der bliver mest købt af fonde. Det er resultatet af en sofistikeret, multi-faktor kvantitativ model, der identificerer virksomheder med de højeste niveauer af institutionel akkumulering. Scoringsmodellen bruger en kombination af den samlede stigning i oplyste ejere, ændringerne i porteføljeallokeringer i disse ejere og andre målinger. Tallet går fra 0 til 100, hvor højere tal indikerer et højere niveau af akkumulering for sine jævnaldrende, og 50 er gennemsnittet.
Opdateringsfrekvens: Dagligt
Se Ownership Explorer, som giver en liste over højest rangerende virksomheder.
Institutionel Put/Call-forhold
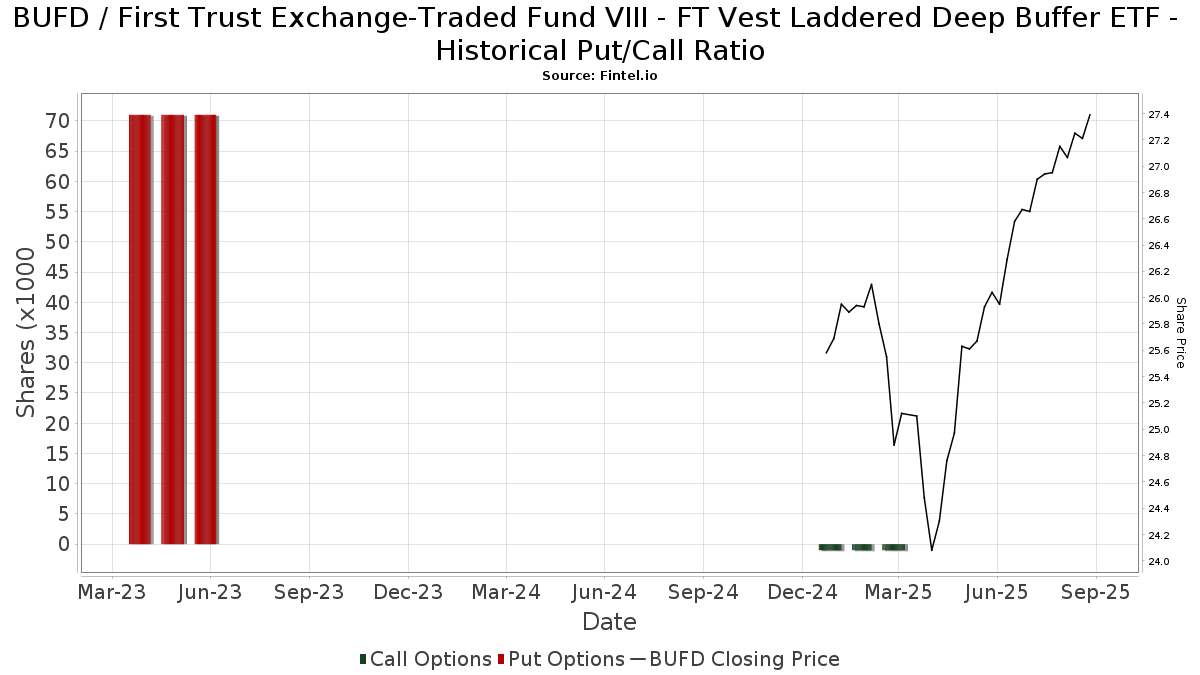
Ud over at indberette standardaktie- og gældsudstedelser skal institutter med mere end 100 mill. aktiver under forvaltning også oplyse deres put- og call-optionsbeholdninger. Da salgsoptioner generelt indikerer negativ stemning, og købsoptioner indikerer positiv stemning, kan vi få en fornemmelse af den overordnede institutionelle stemning ved at plotte forholdet mellem put og kald. Diagrammet til højre viser det historiske put/call-forhold for dette instrument.
Brug af Put/Call Ratio som en indikator for investorernes stemning overvinder en af de vigtigste mangler ved at bruge totalt institutionelt ejerskab, som er, at en betydelig mængde af aktiver under forvaltning investeres passivt for at spore indekser. Passivt forvaltede fonde køber typisk ikke optioner, så indikatoren for put/call-forholdet følger mere nøje følelsen af aktivt forvaltede fonde.
13F og NPORT arkivering
Detaljer om 13F-arkivering er gratis. Detaljer om NP-ansøgninger kræver et premium-medlemskab. Grønne rækker angiver nye positioner. Røde rækker angiver lukkede positioner. Klik på linket ikon for at se den fulde transaktionshistorik.
Opgrader
for at låse premium-data op og eksportere til Excel ![]() .
.
| Fil dato | Kilde | Investor | Type | Gennemsnitlig pris (Øst) |
Aktier | Δ Aktier (%) |
Rapporteret Værdi ($1000) |
Δ Værdi (%) |
Port Alloc (%) |
|
|---|---|---|---|---|---|---|---|---|---|---|
| 2025-08-05 | 13F | EPG Wealth Management LLC | Call | 0 | -100,00 | 0 | ||||
| 2025-08-05 | 13F | American Institute for Advanced Investment Management, LLP | 30.572 | -1,98 | 812 | 4,24 | ||||
| 2025-08-13 | 13F | Northwestern Mutual Wealth Management Co | 2.972 | 79 | ||||||
| 2025-07-14 | 13F | Iams Wealth Management, Llc | 46.230 | -61,62 | 1.228 | -59,17 | ||||
| 2025-08-05 | 13F | EPG Wealth Management LLC | 0 | -100,00 | 0 | |||||
| 2025-08-12 | 13F | Cornerstone Wealth Management, LLC | 7.819 | 208 | ||||||
| 2025-07-23 | 13F | GGM Financials LLC | 16.198 | 430 | ||||||
| 2025-08-05 | 13F | C2P Capital Advisory Group, LLC d.b.a. Prosperity Capital Advisors | 25.131 | 667 | ||||||
| 2025-08-08 | 13F | Kingsview Wealth Management, LLC | 81.531 | -0,67 | 2.165 | 5,76 | ||||
| 2025-08-12 | 13F | Jacobi Capital Management LLC | 200.363 | 7,74 | 5.322 | 14,70 | ||||
| 2025-07-11 | 13F | Farther Finance Advisors, LLC | 5.251 | 232,76 | 139 | 256,41 | ||||
| 2025-07-28 | 13F | RFG Advisory, LLC | 17.969 | 48,14 | 477 | 57,95 | ||||
| 2025-07-22 | 13F | Partners Wealth Management, Llc | 18.296 | 0,00 | 457 | 0,00 | ||||
| 2025-08-18 | 13F | N.E.W. Advisory Services LLC | 2.105 | -65,41 | 56 | -63,58 | ||||
| 2025-04-29 | 13F | Resources Investment Advisors, LLC. | 0 | -100,00 | 0 | |||||
| 2025-07-07 | 13F | Schulz Wealth, LTD. | 8.628 | -36,87 | 229 | -32,84 | ||||
| 2025-07-10 | 13F | Wealth Enhancement Advisory Services, Llc | 18.853 | -45,60 | 503 | -41,78 | ||||
| 2025-04-21 | 13F | Nelson, Van Denburg & Campbell Wealth Management Group, LLC | 0 | -100,00 | 0 | |||||
| 2025-08-13 | 13F | StoneX Group Inc. | 53.431 | 236,64 | 1.419 | 258,33 | ||||
| 2025-04-15 | 13F | Integrated Advisors Network LLC | 0 | -100,00 | 0 | |||||
| 2025-08-14 | 13F | Wells Fargo & Company/mn | 58.263 | -12,79 | 1.547 | -7,14 | ||||
| 2025-08-11 | 13F | Summit Wealth Partners, LLC | 8.243 | 0,00 | 219 | 6,34 | ||||
| 2025-07-30 | 13F | Onyx Bridge Wealth Group LLC | 15.100 | 0,00 | 401 | 6,65 | ||||
| 2025-07-16 | 13F | Maridea Wealth Management LLC | 44.119 | 9,73 | 1.172 | 16,75 | ||||
| 2025-08-06 | 13F | AE Wealth Management LLC | 41.523 | -3,81 | 1.103 | 2,32 | ||||
| 2025-07-30 | 13F | Paul Damon & Associates, Inc. | 53.960 | 3,92 | 1.433 | 10,66 | ||||
| 2025-08-14 | 13F | Mariner, LLC | 324.697 | -15,97 | 8.624 | -10,55 | ||||
| 2025-05-15 | 13F/A | Orion Portfolio Solutions, LLC | 28.450 | -19,51 | 710 | -21,40 | ||||
| 2025-08-14 | 13F | Integrated Wealth Concepts LLC | 134.982 | 15,26 | 3.585 | 22,73 | ||||
| 2025-08-13 | 13F | Capital Analysts, Inc. | 33.980 | 1,14 | 1 | |||||
| 2025-08-06 | 13F | Legacy Investment Solutions, LLC | 106.530 | 57,91 | 2.829 | 62,12 | ||||
| 2025-07-09 | 13F | Tounjian Advisory Partners, Llc | 34.163 | 0,00 | 852 | 0,00 | ||||
| 2025-08-14 | 13F | Harvest Investment Services, LLC | 21.454 | -5,31 | 570 | 0,71 | ||||
| 2025-08-12 | 13F | Indie Asset Partners, LLC | 0 | -100,00 | 0 | |||||
| 2025-08-04 | 13F | L.m. Kohn & Company | 28.226 | -4,34 | 750 | 1,77 | ||||
| 2025-07-25 | 13F | Envestnet Portfolio Solutions, Inc. | 8.196 | -93,52 | 218 | -93,13 | ||||
| 2025-05-21 | 13F/A | Geneos Wealth Management Inc. | 0 | -100,00 | 0 | -100,00 | ||||
| 2025-08-12 | 13F | Jpmorgan Chase & Co | 4 | -99,98 | 0 | -100,00 | ||||
| 2025-07-22 | 13F | Simplicity Wealth,LLC | 202.770 | 73,22 | 5.386 | 84,42 | ||||
| 2025-08-12 | 13F | Gladstone Institutional Advisory LLC | 23.507 | -68,43 | 624 | -66,40 | ||||
| 2025-08-13 | 13F | Townsquare Capital Llc | 0 | -100,00 | 0 | |||||
| 2025-07-31 | 13F | Moloney Securities Asset Management, LLC | 17.985 | 3,42 | 478 | 10,16 | ||||
| 2025-08-11 | 13F | Brass Tax Wealth Management, Inc | 425.004 | 5,19 | 11.288 | 11,98 | ||||
| 2025-08-11 | 13F | Principal Securities, Inc. | 53.075 | 20,77 | 1.410 | 25,69 | ||||
| 2025-07-16 | 13F | Essex Financial Services, Inc. | 8.902 | 0,00 | 236 | 6,31 | ||||
| 2025-08-14 | 13F | Schwallier Wealth Management LLC | 0 | -100,00 | 0 | -100,00 | ||||
| 2025-07-30 | 13F | LifeWealth Investments, LLC | 36.581 | 2,24 | 972 | 8,86 | ||||
| 2025-08-19 | 13F | Advisory Services Network, LLC | 174.066 | 9,40 | 4.679 | 17,86 | ||||
| 2025-05-12 | 13F | Independent Advisor Alliance | 0 | -100,00 | 0 | |||||
| 2025-08-06 | 13F | Commonwealth Equity Services, Llc | 767.257 | -24,33 | 20 | -20,00 | ||||
| 2025-08-11 | 13F | Aptus Capital Advisors, LLC | 1.150 | 0,00 | 31 | 7,14 | ||||
| 2025-08-13 | 13F | SCS Capital Management LLC | 16.152 | 1,23 | 429 | 7,54 | ||||
| 2025-09-04 | 13F/A | Advisor Group Holdings, Inc. | 1.756.473 | 6,87 | 46.652 | 13,77 | ||||
| 2025-08-08 | 13F | Avantax Advisory Services, Inc. | 83.669 | 1,02 | 2.222 | 7,55 | ||||
| 2025-08-13 | 13F | Mayfair Advisory Group, LLC | 25.583 | 0,00 | 692 | 8,31 | ||||
| 2025-08-08 | 13F | Foundations Investment Advisors, LLC | 50.158 | -11,26 | 1.332 | -5,53 | ||||
| 2025-08-14 | 13F | Jane Street Group, Llc | 31.794 | -59,93 | 844 | -57,35 | ||||
| 2025-07-18 | 13F | Cooper Financial Group | 19.481 | -8,95 | 517 | -3,00 | ||||
| 2025-08-04 | 13F | Creekmur Asset Management LLC | 1.490.215 | 3,48 | 39.580 | 10,16 | ||||
| 2025-05-08 | 13F | Us Bancorp \de\ | 0 | -100,00 | 0 | |||||
| 2025-07-23 | 13F | Defined Financial Planning LLC | 15.587 | 415 | ||||||
| 2025-07-25 | 13F | We Are One Seven, LLC | 33.913 | 901 | ||||||
| 2025-08-04 | 13F | IFG Advisory, LLC | 88.748 | -16,37 | 2.357 | -10,96 | ||||
| 2025-07-30 | 13F | Strategic Blueprint, LLC | 26.213 | -19,36 | 696 | -14,18 | ||||
| 2025-07-15 | 13F | Santori & Peters, Inc. | 391.090 | 0,04 | 10.387 | 6,50 | ||||
| 2025-07-16 | 13F | Cambridge Advisors Inc. | 17.467 | -5,92 | 464 | 0,00 | ||||
| 2025-07-24 | 13F | Fischer Investment Strategies, Llc | 569.210 | 17,00 | 15.118 | 24,56 | ||||
| 2025-08-13 | 13F | Maia Wealth LLC | 82.743 | -33,99 | 2.198 | -28,30 | ||||
| 2025-08-14 | 13F | Benjamin Edwards Inc | 15.058 | -24,04 | 400 | -19,23 | ||||
| 2025-08-12 | 13F | Richmond Investment Services, LLC | 117.842 | 107,11 | 3.130 | 120,51 | ||||
| 2025-08-06 | 13F | Wedbush Securities Inc | 166.343 | -39,70 | 4 | -33,33 | ||||
| 2025-07-08 | 13F | Nbc Securities, Inc. | 27.898 | -1,98 | 1 | |||||
| 2025-08-04 | 13F | Atria Investments Llc | 16.280 | 432 | ||||||
| 2025-07-07 | 13F | Nova Wealth Management, Inc. | 469 | -52,24 | 12 | -50,00 | ||||
| 2025-08-14 | 13F | Old Mission Capital Llc | 22.791 | 605 | ||||||
| 2025-07-07 | 13F | Capital Asset Advisory Services LLC | 738.615 | 4,35 | 19.588 | 10,26 | ||||
| 2025-08-08 | 13F | Cetera Investment Advisers | 1.019.430 | 4,40 | 27.076 | 11,14 | ||||
| 2025-08-08 | 13F | SBI Securities Co., Ltd. | 2 | -33,33 | 0 | |||||
| 2025-08-06 | 13F | Golden State Wealth Management, LLC | 10.280 | 0,00 | 273 | 6,64 | ||||
| 2025-07-14 | 13F | Chris Bulman Inc | 9.704 | -13,81 | 258 | -8,21 | ||||
| 2025-08-06 | 13F | Wsfs Capital Management, Llc | 8.146 | 0,00 | 216 | 6,40 | ||||
| 2025-07-14 | 13F | Sowell Financial Services LLC | 21.879 | -14,29 | 581 | -8,65 | ||||
| 2025-08-06 | 13F | Walkner Condon Financial Advisors LLC | 53.124 | -25,73 | 1.411 | -20,96 | ||||
| 2025-08-19 | 13F | National Asset Management, Inc. | 0 | -100,00 | 0 | |||||
| 2025-08-11 | 13F | Perennial Investment Advisors, LLC | 112.101 | 2.977 | ||||||
| 2025-07-22 | 13F | Merit Financial Group, LLC | 12.854 | 0,00 | 341 | 6,56 | ||||
| 2025-08-15 | 13F | Morgan Stanley | 23.246 | 2.052,41 | 617 | 2.273,08 | ||||
| 2025-05-15 | 13F | Concorde Asset Management, LLC | 17.354 | 13,75 | 425 | 9,00 | ||||
| 2025-07-02 | 13F | HBW Advisory Services LLC | 10.766 | 0,00 | 286 | 6,34 | ||||
| 2025-03-21 | 13F | Prostatis Group LLC | 0 | -100,00 | 0 | |||||
| 2025-07-11 | 13F | Quad-Cities Investment Group, LLC | 14.538 | 0,00 | 386 | 6,63 | ||||
| 2025-07-21 | 13F | Ameritas Advisory Services, LLC | 12.656 | -64,82 | 336 | -62,63 | ||||
| 2025-08-20 | 13F/A | Coppell Advisory Solutions LLC | 659.729 | 32,17 | 17.437 | 40,98 | ||||
| 2025-07-21 | 13F | Triad Wealth Partners, LLC | 24.522 | 149,97 | 651 | 166,80 | ||||
| 2025-08-15 | 13F | Equitable Holdings, Inc. | 80.799 | 7,28 | 2.146 | 14,21 | ||||
| 2025-08-07 | 13F | Kestra Private Wealth Services, Llc | 721.868 | 535,98 | 19.173 | 577,22 | ||||
| 2025-07-21 | 13F | Andina Capital Management, LLC | 0 | -100,00 | 0 | |||||
| 2025-05-02 | 13F | Apollon Wealth Management, LLC | 0 | -100,00 | 0 | -100,00 | ||||
| 2025-08-05 | 13F | Claro Advisors LLC | 41.916 | 16,54 | 1.113 | 24,08 | ||||
| 2025-07-28 | 13F | Mutual Advisors, LLC | 14.995 | -13,55 | 404 | -5,61 | ||||
| 2025-08-14 | 13F | Great Valley Advisor Group, Inc. | 11.596 | -1,29 | 308 | 5,14 | ||||
| 2025-07-17 | 13F | Albion Financial Group /ut | 358 | 0,00 | 10 | 12,50 | ||||
| 2025-07-30 | 13F | IMG Wealth Management, Inc. | 275.408 | 4,12 | 7.315 | 10,83 | ||||
| 2025-08-13 | 13F | Twin Peaks Wealth Advisors, LLC | 13.188 | 45,71 | 358 | 62,27 | ||||
| 2025-08-08 | 13F | Larson Financial Group LLC | 1.220 | 0,00 | 32 | 6,67 | ||||
| 2025-07-25 | 13F | Cwm, Llc | 275.091 | 0,80 | 7 | 16,67 | ||||
| 2025-08-08 | 13F | Symphony Financial Services, Inc. | 17.475 | 12,92 | 464 | 20,21 | ||||
| 2025-08-14 | 13F | GWM Advisors LLC | 439.981 | -7,90 | 11.686 | -1,96 | ||||
| 2025-07-10 | 13F | Focus Financial Network, Inc. | 15.024 | 0,00 | 399 | 6,68 | ||||
| 2025-07-24 | 13F | Cascade Investment Group, Inc. | 9.680 | -1,56 | 257 | 4,90 | ||||
| 2025-08-05 | 13F | Strategic Financial Concepts, LLC | 18.566 | -3,61 | 493 | 2,71 | ||||
| 2025-07-30 | 13F | TFB Advisors LLC | 18.547 | -23,65 | 493 | -18,81 | ||||
| 2025-05-07 | 13F | Prosperity Consulting Group, LLC | 0 | -100,00 | 0 | |||||
| 2025-08-04 | 13F | Assetmark, Inc | 4.146 | 14,91 | 110 | 22,22 | ||||
| 2025-07-18 | 13F | Truist Financial Corp | 1.128.503 | 1,59 | 29.973 | 8,15 | ||||
| 2025-07-24 | 13F | IFP Advisors, Inc | 27.671 | 8,92 | 735 | 15,96 | ||||
| 2025-07-25 | 13F | Lion Street Advisors, LLC | 25.086 | -4,39 | 666 | 1,83 | ||||
| 2025-07-29 | 13F | Private Trust Co Na | 10.361 | 6,51 | 275 | 13,64 | ||||
| 2025-08-05 | 13F | Milestone Asset Management, Llc | 418.721 | 34,43 | 11.121 | 43,11 | ||||
| 2025-07-31 | 13F | Cambridge Investment Research Advisors, Inc. | 649.420 | -34,62 | 17 | -29,17 | ||||
| 2025-07-28 | 13F | Axxcess Wealth Management, Llc | 702.397 | 4,40 | 18.656 | 11,13 | ||||
| 2025-08-11 | 13F | Regal Investment Advisors LLC | 10.549 | 0,00 | 280 | 6,46 | ||||
| 2025-07-25 | 13F | Atria Wealth Solutions, Inc. | 33.946 | -80,97 | 902 | -79,75 | ||||
| 2025-08-01 | 13F | Wealth Watch Advisors, INC | 103.704 | 42,44 | 2.754 | 51,65 | ||||
| 2025-08-12 | 13F | Proequities, Inc. | 0 | 0 | ||||||
| 2025-05-02 | 13F | BlackRock, Inc. | 0 | -100,00 | 0 | |||||
| 2025-08-11 | 13F | Blue Bell Private Wealth Management, Llc | 235 | 0,00 | 6 | 20,00 | ||||
| 2025-07-18 | 13F | Trilogy Capital Inc. | 12.470 | 0,00 | 331 | 6,43 | ||||
| 2025-08-14 | 13F | Core Wealth Advisors, Inc. | 8.105 | 215 | ||||||
| 2025-07-16 | 13F | EdgeRock Capital LLC | 27.524 | 0,00 | 731 | 6,56 | ||||
| 2025-08-06 | 13F | Prospera Financial Services Inc | 7.926 | 211 | ||||||
| 2025-08-12 | 13F | Change Path, LLC | 277.959 | -0,72 | 7.383 | 5,68 | ||||
| 2025-08-14 | 13F | Mml Investors Services, Llc | 756.648 | -5,63 | 20 | 0,00 | ||||
| 2025-08-15 | 13F | Kestra Advisory Services, LLC | 428.889 | -0,27 | 11.391 | 6,16 | ||||
| 2025-08-05 | 13F | Integrity Financial Corp /WA | 219.828 | -12,86 | 5.839 | -7,24 | ||||
| 2025-07-24 | 13F | SLT Holdings LLC | 44.764 | -7,75 | 1.189 | -1,82 | ||||
| 2025-07-28 | 13F | Virtus Wealth Solutions LLC | 16.198 | 1,36 | 430 | 8,04 | ||||
| 2025-07-30 | 13F | Brookstone Capital Management | 750.871 | -0,41 | 19.943 | 6,02 | ||||
| 2025-08-12 | 13F | LPL Financial LLC | 8.066.365 | 2,80 | 214.243 | 9,43 | ||||
| 2025-08-14 | 13F | Ausdal Financial Partners, Inc. | 8.991 | -0,59 | 239 | 5,78 | ||||
| 2025-08-14 | 13F | CoreCap Advisors, LLC | 41.733 | -9,11 | 1.108 | -3,23 | ||||
| 2025-08-14 | 13F | Financial Strategies Group, Inc. | 41.511 | 4,89 | 1.107 | 14,83 | ||||
| 2025-08-12 | 13F | Tradition Wealth Management, LLC | 66.961 | -2,76 | 1.778 | 3,49 | ||||
| 2025-08-14 | 13F | Planwiser Financial, Llc | 16.779 | 15,46 | 452 | 24,86 | ||||
| 2025-07-17 | 13F | Janney Montgomery Scott LLC | 20.727 | 1,45 | 1 | |||||
| 2025-07-25 | 13F | Gw Henssler & Associates Ltd | 3.959.449 | -6,91 | 105.163 | -0,90 | ||||
| 2025-08-12 | 13F | Steward Partners Investment Advisory, Llc | 36.385 | 25,46 | 966 | 33,61 | ||||
| 2025-08-05 | 13F | GPS Wealth Strategies Group, LLC | 66.202 | 15,52 | 1.758 | 23,02 | ||||
| 2025-08-05 | 13F | Bank Of Montreal /can/ | 150 | 0,00 | 4 | 0,00 | ||||
| 2025-08-01 | 13F | FSA Advisors, Inc. | 29.829 | -12,08 | 792 | -5,94 | ||||
| 2025-07-25 | 13F | Apollon Financial, LLC | 107.588 | -1,29 | 2.858 | 5,08 | ||||
| 2025-08-08 | 13F | Davies Financial Advisors, Inc. | 32.645 | -0,73 | 867 | 5,73 | ||||
| 2025-08-06 | 13F | Legacy Wealth Managment, LLC/ID | 106.530 | 39,09 | 2.829 | 48,12 | ||||
| 2025-08-14 | 13F | Raymond James Financial Inc | 538.025 | 106,35 | 14.290 | 119,66 | ||||
| 2025-07-28 | 13F | Harbour Investments, Inc. | 526.162 | 6,93 | 13.975 | 13,83 | ||||
| 2025-07-21 | 13F | DHJJ Financial Advisors, Ltd. | 3.645 | -30,83 | 97 | -26,72 | ||||
| 2025-08-12 | 13F | Global Retirement Partners, LLC | 21.499 | 0,00 | 571 | 4,20 | ||||
| 2025-04-22 | 13F | Breakthru Advisory Services, Llc | 0 | -100,00 | 0 | |||||
| 2025-07-29 | 13F | Stratos Wealth Partners, LTD. | 443.723 | -2,55 | 11.785 | 3,74 | ||||
| 2025-07-22 | 13F | Echo Wealth Management, LLC | 54.585 | 10,19 | 1.450 | 17,33 | ||||
| 2025-08-04 | 13F | Creative Financial Designs Inc /adv | 1.435 | 0,00 | 38 | 8,57 | ||||
| 2025-08-14 | 13F | Synovus Financial Corp | 221.781 | 5,49 | 5.891 | 12,30 | ||||
| 2025-07-23 | 13F | Clear Creek Financial Management, LLC | 10.600 | 0,00 | 282 | 6,44 | ||||
| 2025-07-09 | 13F | Pallas Capital Advisors LLC | 22.030 | -62,40 | 585 | -59,96 | ||||
| 2025-08-12 | 13F | SRS Capital Advisors, Inc. | 45.101 | -6,16 | 1.198 | -0,17 | ||||
| 2025-07-16 | 13F | Castleview Partners, Llc | 28.452 | -0,29 | 756 | 6,19 | ||||
| 2025-08-05 | 13F | Sigma Planning Corp | 155.309 | -8,97 | 4.125 | -3,10 | ||||
| 2025-08-11 | 13F | Advisor Resource Council | 10.135 | 5,08 | 269 | 12,08 | ||||
| 2025-07-21 | 13F | Precedent Wealth Partners, Llc | 86.687 | 21,81 | 2.302 | 29,69 | ||||
| 2025-07-22 | 13F | Ergawealth Advisors, Inc. | 56.029 | -12,19 | 1.488 | -6,53 | ||||
| 2025-08-14 | 13F | IHT Wealth Management, LLC | 26.626 | 1,68 | 707 | 8,27 | ||||
| 2025-08-11 | 13F | Private Advisor Group, LLC | 426.708 | 5,96 | 11.333 | 12,80 | ||||
| 2025-08-04 | 13F | Arkadios Wealth Advisors | 52.466 | -1,52 | 1.393 | 4,82 | ||||
| 2025-05-14 | 13F | Ameriprise Financial Inc | 0 | -100,00 | 0 | -100,00 | ||||
| 2025-08-05 | 13F | Atlas Private Wealth Advisors | 207.698 | -25,37 | 5.516 | -20,56 | ||||
| 2025-04-10 | 13F | Whipplewood Advisors, LLC | 0 | -100,00 | 0 | |||||
| 2025-07-17 | 13F | Centennial Wealth Advisory LLC | 1.773.912 | -0,58 | 47.119 | 5,84 | ||||
| 2025-08-14 | 13F | Susquehanna International Group, Llp | 10.868 | -81,31 | 289 | -80,14 | ||||
| 2025-08-14 | 13F | Royal Bank Of Canada | 508.836 | -3,86 | 13.515 | 2,35 | ||||
| 2025-07-09 | 13F | Dynamic Advisor Solutions LLC | 16.761 | -16,99 | 445 | -11,53 | ||||
| 2025-07-17 | 13F | Alliance Wealth Advisors, LLC | 15.469 | 0,00 | 411 | 6,49 | ||||
| 2025-07-17 | 13F | HB Wealth Management, LLC | 8.986 | 0,00 | 239 | 6,25 | ||||
| 2025-08-08 | 13F | Good Life Advisors, LLC | 18.527 | -15,16 | 492 | -9,56 | ||||
| 2025-08-29 | 13F | Centaurus Financial, Inc. | 99.994 | -2,77 | 3 | 0,00 | ||||
| 2025-07-24 | 13F | McKinley Carter Wealth Services, Inc. | 21.637 | 0,00 | 575 | 6,49 | ||||
| 2025-07-15 | 13F | Five Pine Wealth Management | 30.655 | 2,25 | 814 | 8,82 | ||||
| 2025-07-15 | 13F | Legacy Financial Group LLC | 1.933.867 | 0,87 | 51.364 | 7,38 | ||||
| 2025-08-01 | 13F | Envestnet Asset Management Inc | 3.480.049 | 1,32 | 92.430 | 7,86 | ||||
| 2025-08-27 | 13F/A | Brinker Capital Investments, LLC | 31.340 | 10,16 | 832 | 17,35 | ||||
| 2025-07-17 | 13F | Sound Income Strategies, LLC | 633 | 8,21 | 17 | 14,29 | ||||
| 2025-08-18 | 13F | Tyler-Stone Wealth Management | 117.378 | 8,37 | 3.118 | 15,36 |