Grundlæggende statistik
| Institutionelle ejere | 81 total, 81 long only, 0 short only, 0 long/short - change of 6,49% MRQ |
| Gennemsnitlig porteføljeallokering | 0.1069 % - change of -12,91% MRQ |
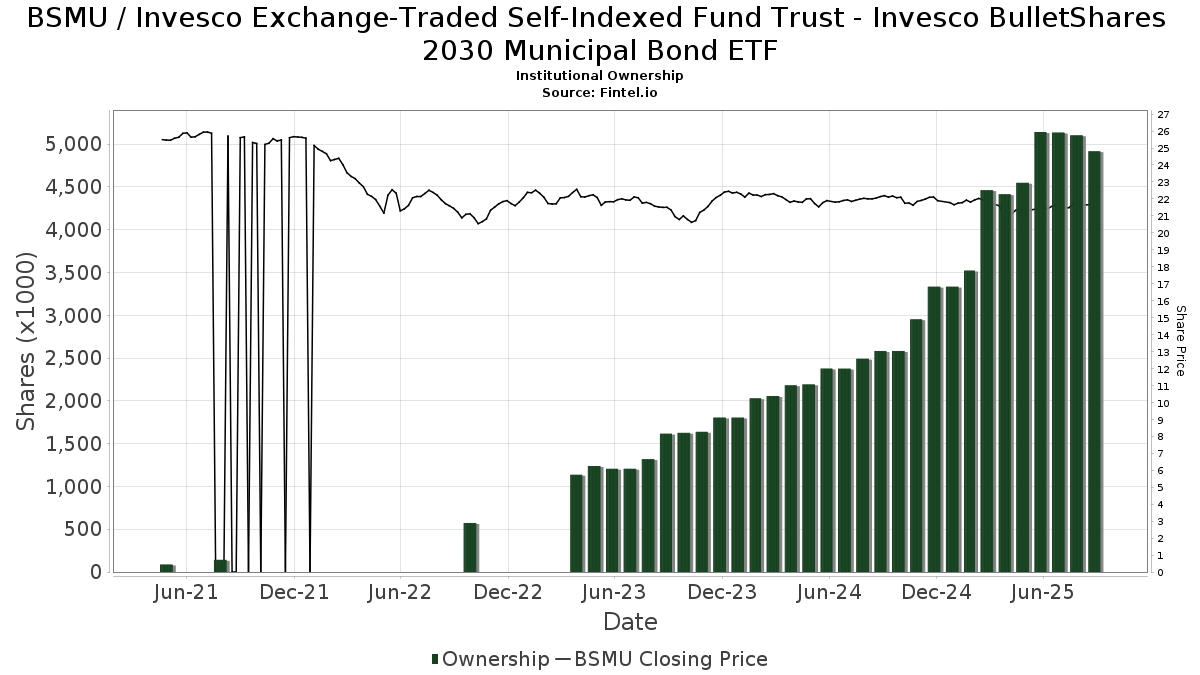
| Institutionelle aktier (lange) | 4.917.662 (ex 13D/G) - change of -0,10MM shares -2,08% MRQ |
| Institutionel værdi (lang) | $ 103.562 USD ($1000) |
Institutionelt ejerskab og aktionærer
Invesco Exchange-Traded Self-Indexed Fund Trust - Invesco BulletShares 2030 Municipal Bond ETF (US:BSMU) har 81 institutionelle ejere og aktionærer, der har indsendt 13D/G- eller 13F-formularer til Securities Exchange Commission (SEC). Disse institutioner har i alt 4,917,662 aktier. Største aktionærer omfatter Wells Fargo & Company/mn, LPL Financial LLC, Confluence Investment Management Llc, Bank Of America Corp /de/, Atlantic Union Bankshares Corp, Invesco Ltd., UBS Group AG, Jane Street Group, Llc, Precedent Wealth Partners, Llc, and MONECO Advisors, LLC .
Invesco Exchange-Traded Self-Indexed Fund Trust - Invesco BulletShares 2030 Municipal Bond ETF (NasdaqGM:BSMU) institutionel ejerskabsstruktur viser aktuelle positioner i virksomheden efter institutioner og fonde, samt seneste ændringer i positionsstørrelse. Større aktionærer kan omfatte individuelle investorer, investeringsforeninger, hedgefonde eller institutioner. Skema 13D angiver, at investoren besidder (eller besidder) mere end 5 % af virksomheden og har til hensigt (eller har til hensigt at) aktivt at forfølge en ændring i forretningsstrategi. Skema 13G indikerer en passiv investering på over 5%.
The share price as of September 19, 2025 is 22,06 / share. Previously, on September 20, 2024, the share price was 22,18 / share. This represents a decline of 0,56% over that period.
Fondens stemningsscore
Fund Sentiment Score (fka Ownership Accumulation Score) finder de aktier, der bliver mest købt af fonde. Det er resultatet af en sofistikeret, multi-faktor kvantitativ model, der identificerer virksomheder med de højeste niveauer af institutionel akkumulering. Scoringsmodellen bruger en kombination af den samlede stigning i oplyste ejere, ændringerne i porteføljeallokeringer i disse ejere og andre målinger. Tallet går fra 0 til 100, hvor højere tal indikerer et højere niveau af akkumulering for sine jævnaldrende, og 50 er gennemsnittet.
Opdateringsfrekvens: Dagligt
Se Ownership Explorer, som giver en liste over højest rangerende virksomheder.
AI+ Ask Fintel’s AI assistant about Invesco Exchange-Traded Self-Indexed Fund Trust - Invesco BulletShares 2030 Municipal Bond ETF.
Thinking of good questions…
Institutionel Put/Call-forhold
Ud over at indberette standardaktie- og gældsudstedelser skal institutter med mere end 100 mill. aktiver under forvaltning også oplyse deres put- og call-optionsbeholdninger. Da salgsoptioner generelt indikerer negativ stemning, og købsoptioner indikerer positiv stemning, kan vi få en fornemmelse af den overordnede institutionelle stemning ved at plotte forholdet mellem put og kald. Diagrammet til højre viser det historiske put/call-forhold for dette instrument.
Brug af Put/Call Ratio som en indikator for investorernes stemning overvinder en af de vigtigste mangler ved at bruge totalt institutionelt ejerskab, som er, at en betydelig mængde af aktiver under forvaltning investeres passivt for at spore indekser. Passivt forvaltede fonde køber typisk ikke optioner, så indikatoren for put/call-forholdet følger mere nøje følelsen af aktivt forvaltede fonde.
13F og NPORT arkivering
Detaljer om 13F-arkivering er gratis. Detaljer om NP-ansøgninger kræver et premium-medlemskab. Grønne rækker angiver nye positioner. Røde rækker angiver lukkede positioner. Klik på linket ikon for at se den fulde transaktionshistorik.
Opgrader
for at låse premium-data op og eksportere til Excel ![]() .
.
| Fil dato | Kilde | Investor | Type | Gennemsnitlig pris (Øst) |
Aktier | Δ Aktier (%) |
Rapporteret Værdi ($1000) |
Δ Værdi (%) |
Port Alloc (%) |
|
|---|---|---|---|---|---|---|---|---|---|---|
| 2025-07-30 | 13F | D.a. Davidson & Co. | 0 | -100,00 | 0 | |||||
| 2025-07-29 | 13F | Mb, Levis & Associates, Llc | 65.522 | 7,82 | 1.409 | 7,40 | ||||
| 2025-08-12 | 13F | Proequities, Inc. | 0 | 0 | ||||||
| 2025-07-10 | 13F | Sterling Financial Group, Inc. | 27.604 | -0,59 | 593 | -1,00 | ||||
| 2025-08-01 | 13F | Envestnet Asset Management Inc | 83.368 | -17,00 | 1.792 | -17,31 | ||||
| 2025-07-28 | 13F | Harbour Investments, Inc. | 268 | -56,56 | 6 | -61,54 | ||||
| 2025-08-14 | 13F | UBS Group AG | 159.779 | 6,32 | 3.435 | 5,92 | ||||
| 2025-07-28 | 13F | Nestegg Advisors, Inc. | 21.392 | 23,29 | 460 | 22,73 | ||||
| 2025-08-15 | 13F | Captrust Financial Advisors | 23.717 | -12,39 | 510 | -12,84 | ||||
| 2025-08-01 | 13F | Koss-Olinger Consulting, LLC | 30.178 | 649 | ||||||
| 2025-08-14 | 13F | Fmr Llc | 0 | -100,00 | 0 | |||||
| 2025-07-25 | 13F | Cwm, Llc | 910 | 0,00 | 0 | |||||
| 2025-08-14 | 13F | Integrated Wealth Concepts LLC | 47.264 | 26,30 | 1.016 | 25,90 | ||||
| 2025-08-14 | 13F | GWM Advisors LLC | 2.600 | 0,00 | 56 | -1,79 | ||||
| 2025-08-11 | 13F | PAX Financial Group, LLC | 0 | -100,00 | 0 | |||||
| 2025-08-05 | 13F | Key FInancial Inc | 118.800 | 0,00 | 2.554 | -0,35 | ||||
| 2025-08-11 | 13F | Principal Securities, Inc. | 3.239 | -27,64 | 70 | -28,87 | ||||
| 2025-08-13 | 13F | VestGen Advisors, LLC | 77.698 | 9,59 | 1.682 | 9,94 | ||||
| 2025-07-21 | 13F | Precedent Wealth Partners, Llc | 140.313 | 8,08 | 3.017 | 7,68 | ||||
| 2025-08-07 | 13F | Midland Wealth Advisors Llc | 12.633 | 0,00 | 272 | -0,37 | ||||
| 2025-07-24 | 13F | IFP Advisors, Inc | 1.100 | 0,00 | 24 | 0,00 | ||||
| 2025-08-04 | 13F | Atria Investments Llc | 0 | -100,00 | 0 | |||||
| 2025-07-08 | 13F | Legacy Private Trust Co. | 103.636 | 13,93 | 2.228 | 13,56 | ||||
| 2025-08-07 | 13F | Addison Advisors LLC | 29.405 | 5,41 | 632 | 5,16 | ||||
| 2025-07-22 | 13F | Marietta Wealth Management, LLC | 23.327 | 502 | ||||||
| 2025-08-14 | 13F | Stifel Financial Corp | 32.791 | 35,73 | 705 | 35,32 | ||||
| 2025-08-11 | 13F | HighTower Advisors, LLC | 122.513 | 29,89 | 2.634 | 29,43 | ||||
| 2025-08-08 | 13F | Meridian Wealth Management, LLC | 18.326 | 47,40 | 394 | 47,01 | ||||
| 2025-08-06 | 13F | AE Wealth Management LLC | 97.290 | 7,86 | 2.092 | 7,45 | ||||
| 2025-08-11 | 13F | Aptus Capital Advisors, LLC | 5.726 | 0,76 | 123 | 0,82 | ||||
| 2025-07-29 | 13F | Wingate Wealth Advisors, Inc. | 16.257 | 0,76 | 350 | 0,29 | ||||
| 2025-08-13 | 13F | Jones Financial Companies Lllp | 47.904 | 423,94 | 1.029 | 422,34 | ||||
| 2025-08-12 | 13F | Jacobi Capital Management LLC | 13.279 | 26,72 | 286 | 26,11 | ||||
| 2025-08-11 | 13F | Pineridge Advisors LLC | 99.196 | 0,74 | 2.133 | 0,38 | ||||
| 2025-08-13 | 13F | MONECO Advisors, LLC | 131.932 | 46,41 | 2.837 | 45,88 | ||||
| 2025-08-14 | 13F | Jane Street Group, Llc | 140.831 | -34,59 | 3.028 | -34,85 | ||||
| 2025-09-04 | 13F/A | Advisor Group Holdings, Inc. | 45.811 | 8,14 | 985 | 7,66 | ||||
| 2025-07-11 | 13F | Farther Finance Advisors, LLC | 1.567 | 34 | ||||||
| 2025-08-13 | 13F | Beacon Pointe Advisors, LLC | 11.867 | -24,97 | 255 | -25,22 | ||||
| 2025-08-12 | 13F | YANKCOM Partnership | 7.900 | 170 | ||||||
| 2025-07-01 | 13F | Confluence Investment Management Llc | 241.752 | -2,83 | 5.198 | -3,19 | ||||
| 2025-08-14 | 13F | Envision Financial Planning, LLC | 67.541 | -62,66 | 1.452 | -62,79 | ||||
| 2025-07-28 | 13F | Tlwm | 24.116 | 0,00 | 518 | -0,38 | ||||
| 2025-08-14 | 13F | Bank Of America Corp /de/ | 231.368 | 6,56 | 4.974 | 6,17 | ||||
| 2025-08-01 | 13F | Clark Asset Management, LLC | 45.804 | 9,05 | 985 | 8,61 | ||||
| 2025-08-13 | 13F | Northwestern Mutual Wealth Management Co | 56.073 | 5,71 | 1.206 | 5,33 | ||||
| 2025-08-14 | 13F | Mml Investors Services, Llc | 47.013 | 14,21 | 1 | |||||
| 2025-08-19 | 13F | Asset Dedication, LLC | 59.367 | 54,82 | 1.276 | 54,29 | ||||
| 2025-08-01 | 13F | First Command Advisory Services, Inc. | 5.035 | 28,35 | 108 | 28,57 | ||||
| 2025-07-31 | 13F | Insight Wealth Partners, LLC | 105.210 | -20,53 | 2.262 | -20,83 | ||||
| 2025-07-29 | 13F | Stratos Wealth Advisors, LLC | 118.083 | 203,13 | 2.539 | 202,14 | ||||
| 2025-08-14 | 13F | Wells Fargo & Company/mn | 407.600 | -9,20 | 8.763 | -9,54 | ||||
| 2025-08-11 | 13F | Elequin Capital Lp | 47.654 | 1.025 | ||||||
| 2025-08-15 | 13F | Morgan Stanley | 119.599 | 14,09 | 2.571 | 13,66 | ||||
| 2025-08-14 | 13F | Raymond James Financial Inc | 127.237 | -31,99 | 2.736 | -32,25 | ||||
| 2025-03-25 | 13F | Higgins & Schmidt Wealth Strategies LLC | 0 | -100,00 | 0 | -100,00 | ||||
| 2025-08-05 | 13F | Huntington National Bank | 822 | 27,05 | ||||||
| 2025-07-22 | 13F | Knights of Columbus Asset Advisors LLC | 7.550 | 0,00 | 162 | 0,00 | ||||
| 2025-07-07 | 13F | Horizons Wealth Management | 24.327 | 0,00 | 523 | -0,19 | ||||
| 2025-07-25 | 13F | Hobbs Group Advisors, LLC | 0 | -100,00 | 0 | |||||
| 2025-07-21 | 13F | Crews Bank & Trust | 9.110 | 0,00 | 196 | -0,51 | ||||
| 2025-08-14 | 13F | Susquehanna International Group, Llp | 11.695 | 251 | ||||||
| 2025-04-15 | 13F | Collier Financial | 4.124 | -22,10 | 89 | -22,81 | ||||
| 2025-07-14 | 13F | AdvisorNet Financial, Inc | 308 | 0,00 | 7 | 0,00 | ||||
| 2025-08-08 | 13F | Pnc Financial Services Group, Inc. | 258 | 0,78 | 6 | 0,00 | ||||
| 2025-07-09 | 13F | Sarver Vrooman Wealth Advisors | 38.175 | 0,00 | 821 | -0,36 | ||||
| 2025-08-13 | 13F | Invesco Ltd. | 159.854 | 1,41 | 3.437 | 1,03 | ||||
| 2025-05-12 | 13F | Bill Few Associates, Inc. | 0 | -100,00 | 0 | |||||
| 2025-08-12 | 13F | J.w. Cole Advisors, Inc. | 10.768 | 0,39 | 232 | 0,00 | ||||
| 2025-07-23 | 13F | Opulen Financial Group LLC | 9.705 | 0,62 | 209 | 0,00 | ||||
| 2025-07-09 | 13F | Lincoln Capital Corp | 15.017 | -18,77 | 323 | -19,10 | ||||
| 2025-08-12 | 13F | LPL Financial LLC | 399.349 | 3,04 | 8.586 | 2,65 | ||||
| 2025-07-16 | 13F | Gradient Capital Advisors, LLC | 9.381 | 0,00 | 202 | -0,50 | ||||
| 2025-07-16 | 13F | Signaturefd, Llc | 19.809 | 0,00 | 426 | -0,47 | ||||
| 2025-08-13 | 13F | StoneX Group Inc. | 23.755 | -20,50 | 511 | -20,81 | ||||
| 2025-08-15 | 13F | Kestra Advisory Services, LLC | 96.720 | 8,38 | 2.079 | 8,00 | ||||
| 2025-07-17 | 13F | Nelson, Van Denburg & Campbell Wealth Management Group, LLC | 22.916 | -47,78 | 493 | -47,99 | ||||
| 2025-08-13 | 13F | Capital Analysts, Inc. | 6.570 | 0,00 | 0 | |||||
| 2025-07-10 | 13F | Global Financial Private Client, LLC | 0 | -100,00 | 0 | |||||
| 2025-08-06 | 13F | Atlantic Union Bankshares Corp | 178.894 | 11,92 | 3.846 | 11,51 | ||||
| 2025-08-12 | 13F | Farmers National Bank | 57.738 | 3,23 | 1.241 | 2,90 | ||||
| 2025-05-05 | 13F | Private Advisor Group, LLC | 0 | -100,00 | 0 | |||||
| 2025-07-15 | 13F | Garrett Investment Advisors LLC | 27.713 | -50,51 | 596 | -50,75 | ||||
| 2025-08-14 | 13F | Royal Bank Of Canada | 21.967 | 57,48 | 472 | 56,81 | ||||
| 2025-08-06 | 13F | Prospera Financial Services Inc | 10.416 | 0,00 | 224 | -0,45 | ||||
| 2025-08-06 | 13F | Commonwealth Equity Services, Llc | 44.902 | 3,92 | 1 | |||||
| 2025-08-13 | 13F | Lido Advisors, LLC | 82.200 | 26,46 | 1.767 | 26,03 | ||||
| 2025-08-08 | 13F | Avantax Advisory Services, Inc. | 9.529 | 205 | ||||||
| 2025-08-08 | 13F | Larson Financial Group LLC | 5.812 | 0,00 | 125 | -0,80 | ||||
| 2025-05-15 | 13F | Toronto Dominion Bank | 0 | -100,00 | 0 | |||||
| 2025-07-25 | 13F | Astoria Portfolio Advisors LLC. | 20.809 | 447 | ||||||
| 2025-08-15 | 13F | WFA of San Diego, LLC | 1.015 | 22 | ||||||
| 2025-08-05 | 13F | Hills Bank & Trust Co | 117.881 | -65,40 | 2.534 | -65,53 |