Grundlæggende statistik
| Institutionelle aktier (lange) | 76.136.920 - 78,72% (ex 13D/G) - change of -31,61MM shares -29,34% MRQ |
| Institutionel værdi (lang) | $ 1.805.631 USD ($1000) |
Institutionelt ejerskab og aktionærer
The Baldwin Insurance Group, Inc. (US:BRP) har 208 institutionelle ejere og aktionærer, der har indsendt 13D/G- eller 13F-formularer til Securities Exchange Commission (SEC). Disse institutioner har i alt 76,136,920 aktier. Største aktionærer omfatter Fmr Llc, William Blair Investment Management, Llc, Vanguard Group Inc, BlackRock, Inc., Capital International Investors, Capital Research Global Investors, Bamco Inc /ny/, Bank of New York Mellon Corp, Westwood Holdings Group Inc, and State Street Corp .
The Baldwin Insurance Group, Inc. (NasdaqGS:BRP) institutionel ejerskabsstruktur viser aktuelle positioner i virksomheden efter institutioner og fonde, samt seneste ændringer i positionsstørrelse. Større aktionærer kan omfatte individuelle investorer, investeringsforeninger, hedgefonde eller institutioner. Skema 13D angiver, at investoren besidder (eller besidder) mere end 5 % af virksomheden og har til hensigt (eller har til hensigt at) aktivt at forfølge en ændring i forretningsstrategi. Skema 13G indikerer en passiv investering på over 5%.

Fondens stemningsscore
Fund Sentiment Score (fka Ownership Accumulation Score) finder de aktier, der bliver mest købt af fonde. Det er resultatet af en sofistikeret, multi-faktor kvantitativ model, der identificerer virksomheder med de højeste niveauer af institutionel akkumulering. Scoringsmodellen bruger en kombination af den samlede stigning i oplyste ejere, ændringerne i porteføljeallokeringer i disse ejere og andre målinger. Tallet går fra 0 til 100, hvor højere tal indikerer et højere niveau af akkumulering for sine jævnaldrende, og 50 er gennemsnittet.
Opdateringsfrekvens: Dagligt
Se Ownership Explorer, som giver en liste over højest rangerende virksomheder.
AI+ Ask Fintel’s AI assistant about The Baldwin Insurance Group, Inc..
Select a question to share a public post with an AI-crafted answer.
Thinking of good questions…
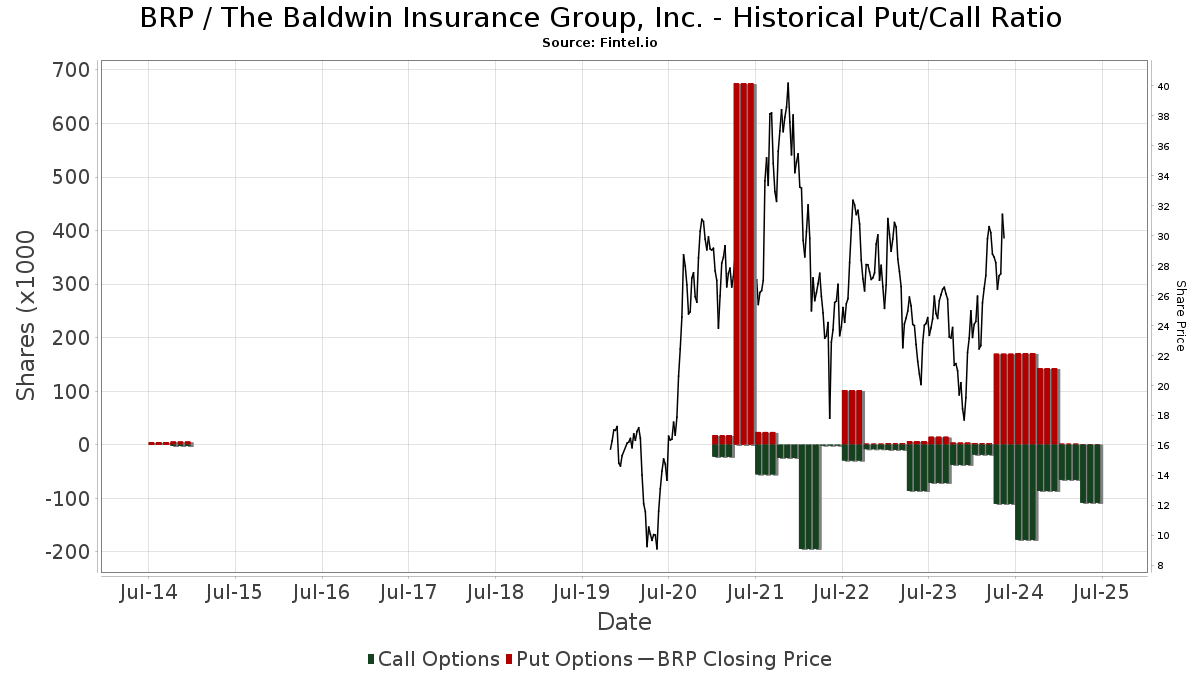
Institutionel Put/Call-forhold
Ud over at indberette standardaktie- og gældsudstedelser skal institutter med mere end 100 mill. aktiver under forvaltning også oplyse deres put- og call-optionsbeholdninger. Da salgsoptioner generelt indikerer negativ stemning, og købsoptioner indikerer positiv stemning, kan vi få en fornemmelse af den overordnede institutionelle stemning ved at plotte forholdet mellem put og kald. Diagrammet til højre viser det historiske put/call-forhold for dette instrument.
Brug af Put/Call Ratio som en indikator for investorernes stemning overvinder en af de vigtigste mangler ved at bruge totalt institutionelt ejerskab, som er, at en betydelig mængde af aktiver under forvaltning investeres passivt for at spore indekser. Passivt forvaltede fonde køber typisk ikke optioner, så indikatoren for put/call-forholdet følger mere nøje følelsen af aktivt forvaltede fonde.
13F og NPORT arkivering
Detaljer om 13F-arkivering er gratis. Detaljer om NP-ansøgninger kræver et premium-medlemskab. Grønne rækker angiver nye positioner. Røde rækker angiver lukkede positioner. Klik på linket ikon for at se den fulde transaktionshistorik.
Opgrader
for at låse premium-data op og eksportere til Excel ![]() .
.
| Fil dato | Kilde | Investor | Type | Gennemsnitlig pris (Øst) |
Aktier | Δ Aktier (%) |
Rapporteret Værdi ($1000) |
Δ Værdi (%) |
Port Alloc (%) |
|
|---|---|---|---|---|---|---|---|---|---|---|
| 2026-02-09 | 13F | Bleakley Financial Group, LLC | 17.023 | 409 | ||||||
| 2025-11-17 | 13F | Kestra Investment Management, LLC | 0 | -100,00 | 0 | -100,00 | ||||
| 2026-02-17 | 13F | State Of Wisconsin Investment Board | 387.478 | 6,64 | 9.311 | -9,15 | ||||
| 2026-02-13 | 13F | Citigroup Inc | 3.898 | -69,21 | 94 | -73,95 | ||||
| 2026-01-26 | 13F | Whittier Trust Co Of Nevada Inc | 53 | 3,92 | 1 | 0,00 | ||||
| 2026-01-20 | 13F | Red Door Wealth Management, LLC | 27.000 | 0,00 | 649 | -14,85 | ||||
| 2026-02-02 | 13F | Fenimore Asset Management Inc | 582.850 | 14,95 | 14.006 | -2,09 | ||||
| 2026-02-11 | 13F | Zions Bancorporation, National Association /ut/ | 42.952 | -11,93 | 1.032 | -24,95 | ||||
| 2026-02-13 | 13F | Marshall Wace, Llp | 87.008 | 2.091 | ||||||
| 2026-02-17 | 13F | Balyasny Asset Management Llc | 301.576 | 7.247 | ||||||
| 2026-02-09 | 13F | Huntington National Bank | 1 | -98,88 | 0 | -100,00 | ||||
| 2026-02-17 | 13F | T. Rowe Price Investment Management, Inc. | 452.226 | -84,93 | 11 | -88,10 | ||||
| 2026-02-13 | 13F | Hudson Bay Capital Management LP | 22.740 | 546 | ||||||
| 2026-02-13 | 13F | First Trust Advisors Lp | 0 | -100,00 | 0 | |||||
| 2026-02-17 | 13F | Northern Trust Corp | 588.576 | -8,71 | 14.143 | -22,23 | ||||
| 2026-02-13 | 13F | Champlain Investment Partners, LLC | 0 | -100,00 | 0 | |||||
| 2026-02-13 | 13F | First National Bank Of Omaha | 12.368 | -2,13 | 297 | -16,57 | ||||
| 2026-01-28 | 13F | HB Wealth Management, LLC | 73.748 | -20,48 | 1.772 | -32,26 | ||||
| 2026-02-17 | 13F | Woodline Partners LP | 1.458.314 | 35.043 | ||||||
| 2026-02-12 | 13F | Campbell & CO Investment Adviser LLC | 32.516 | 781 | ||||||
| 2026-02-11 | 13F | Ameritas Investment Partners, Inc. | 5.874 | 141 | ||||||
| 2026-02-06 | 13F | Van Hulzen Asset Management, LLC | 0 | -100,00 | 0 | -100,00 | ||||
| 2026-01-21 | 13F | Flagship Harbor Advisors, Llc | 5.160 | 124 | ||||||
| 2025-11-13 | 13F | Winton Capital Group Ltd | 0 | -100,00 | 0 | |||||
| 2026-02-23 | 13F | Wealth Preservation Advisors, LLC | 1.931 | 46 | ||||||
| 2026-02-12 | 13F | Federated Hermes, Inc. | 0 | -100,00 | 0 | |||||
| 2026-02-12 | 13F | Jane Street Group, Llc | 0 | -100,00 | 0 | |||||
| 2025-11-04 | 13F | Principal Financial Group Inc | 0 | -100,00 | 0 | -100,00 | ||||
| 2026-02-09 | 13F | Hartland & Co., LLC | 0 | -100,00 | 0 | |||||
| 2026-02-09 | 13F | Hantz Financial Services, Inc. | 0 | -100,00 | 0 | |||||
| 2026-02-12 | 13F | Quadrant Capital Group Llc | 191 | 28,19 | 5 | 0,00 | ||||
| 2026-01-26 | 13F | KBC Group NV | 2.111 | 0,00 | 0 | |||||
| 2026-02-17 | 13F | Millennium Management Llc | 10.752 | -80,84 | 258 | -83,70 | ||||
| 2026-02-13 | 13F | Barclays Plc | 111.314 | 10,61 | 2.675 | -5,81 | ||||
| 2026-04-09 | 13F | Dorato Capital Management | 1.333 | 0,00 | 30 | -14,29 | ||||
| 2026-02-13 | 13F | Victory Capital Management Inc | 0 | -100,00 | 0 | |||||
| 2026-02-12 | 13F | Voya Investment Management Llc | 12.743 | 0,00 | 306 | -14,76 | ||||
| 2026-02-11 | 13F | Simplex Trading, Llc | Call | 0 | -100,00 | 0 | ||||
| 2026-02-13 | 13F | Caitong International Asset Management Co., Ltd | 0 | -100,00 | 0 | |||||
| 2025-11-12 | 13F | Neuberger Berman Group LLC | 0 | -100,00 | 0 | -100,00 | ||||
| 2026-02-11 | 13F | Simplex Trading, Llc | 0 | -100,00 | 0 | |||||
| 2026-04-14 | 13F | Austin Wealth Management, LLC | 0 | -100,00 | 0 | |||||
| 2026-02-10 | 13F | Natixis Advisors, L.p. | 13.363 | -40,81 | 0 | |||||
| 2026-04-08 | 13F | Sapient Capital Llc | 50.000 | 0,00 | 1.097 | -13,76 | ||||
| 2026-02-17 | 13F | Raymond James Financial Inc | 34.223 | 822 | ||||||
| 2026-02-17 | 13F | Russell Investments Group, Ltd. | 99.030 | 16,55 | 2.380 | -0,71 | ||||
| 2026-02-04 | 13F | Nicholas Company, Inc. | 185.110 | 0,09 | 4.448 | -14,74 | ||||
| 2026-02-12 | 13F | Schneider Downs Wealth Management Advisors, LP | 0 | -100,00 | 0 | |||||
| 2026-02-10 | 13F | Goldman Sachs Group Inc | 379.653 | 49,94 | 9.123 | 27,74 | ||||
| 2026-02-17 | 13F | Aqr Capital Management Llc | 12.755 | 307 | ||||||
| 2026-02-11 | 13F | Simplex Trading, Llc | Put | 0 | -100,00 | 0 | ||||
| 2026-02-13 | 13F | Police & Firemen's Retirement System of New Jersey | 19.455 | 0,00 | 468 | -14,78 | ||||
| 2026-02-11 | 13F | Group One Trading, L.p. | Call | 0 | -100,00 | 0 | ||||
| 2026-02-19 | 13F | Invesco Ltd. | 61.412 | -87,79 | 1.476 | -89,60 | ||||
| 2026-01-23 | 13F | Assetmark, Inc | 26.662 | -2,61 | 641 | -17,10 | ||||
| 2026-02-10 | 13F | Intech Investment Management Llc | 26.071 | -10,24 | 626 | -23,57 | ||||
| 2025-10-24 | 13F | Hemington Wealth Management | 0 | -100,00 | 0 | |||||
| 2026-02-17 | 13F | Bank Of America Corp /de/ | 558.528 | -4,40 | 13.421 | -18,57 | ||||
| 2025-10-30 | 13F | Aubrey Capital Management Ltd | 0 | -100,00 | 0 | -100,00 | ||||
| 2026-01-15 | 13F | Nisa Investment Advisors, Llc | 639 | -3,03 | 15 | -16,67 | ||||
| 2026-02-13 | 13F | Kestra Advisory Services, LLC | 883 | 21 | ||||||
| 2026-01-28 | 13F | Universal- Beteiligungs- und Servicegesellschaft mbH | 59.529 | 4,33 | 1.430 | -11,12 | ||||
| 2026-02-13 | 13F | Prudential Financial Inc | 0 | -100,00 | 0 | |||||
| 2026-02-17 | 13F | Fmr Llc | 10.796.351 | 0,38 | 259.436 | -14,49 | ||||
| 2026-02-11 | 13F | Capital World Investors | 0 | -100,00 | 0 | |||||
| 2026-04-01 | 13F | Confluence Investment Management Llc | 638.637 | 10,20 | 14.012 | 0,62 | ||||
| 2026-01-23 | 13F | Private Wealth Management Group, LLC | 157 | 4 | ||||||
| 2026-02-06 | 13F | ProShare Advisors LLC | 13.045 | 8,51 | 313 | -7,67 | ||||
| 2025-11-14 | 13F | Warren Averett Asset Management, LLC | 0 | -100,00 | 0 | |||||
| 2026-02-17 | 13F | SummitTX Capital, L.P. | 0 | -100,00 | 0 | |||||
| 2026-02-17 | 13F | Susquehanna International Group, Llp | 11.257 | 271 | ||||||
| 2026-02-17 | 13F | Susquehanna International Group, Llp | Call | 24.300 | -40,15 | 584 | -49,08 | |||
| 2026-02-13 | 13F | Umb Bank N A/mo | 370 | 0,00 | 9 | -20,00 | ||||
| 2026-02-10 | 13F | Envestnet Asset Management Inc | 118.983 | -34,32 | 2.859 | -44,05 | ||||
| 2026-02-17 | 13F | Ameriprise Financial Inc | 8.890 | -98,23 | 214 | -98,50 | ||||
| 2026-01-29 | 13F | UBS Group AG | 686.318 | 42,89 | 16.492 | 21,72 | ||||
| 2026-02-17 | 13F | Optiver Holding B.V. | 152 | -56,82 | 4 | -66,67 | ||||
| 2025-10-21 | 13F | SJS Investment Consulting Inc. | 0 | -100,00 | 0 | |||||
| 2026-02-09 | 13F | Emerald Mutual Fund Advisers Trust | 0 | -100,00 | 0 | -100,00 | ||||
| 2026-02-17 | 13F | Aristotle Capital Boston, LLC | 738.160 | 12,53 | 17.738 | -4,14 | ||||
| 2026-02-12 | 13F | Elo Mutual Pension Insurance Co | 0 | -100,00 | 0 | |||||
| 2026-02-17 | 13F | Philadelphia Financial Management of San Francisco, LLC | 556.299 | 13.368 | ||||||
| 2026-02-17 | 13F | Numerai GP LLC | 0 | -100,00 | 0 | |||||
| 2026-01-30 | 13F | State of New Jersey Common Pension Fund D | 0 | -100,00 | 0 | |||||
| 2026-02-13 | 13F | Sei Investments Co | 344.534 | -14,61 | 8.279 | -27,26 | ||||
| 2026-02-10 | 13F | Td Asset Management Inc | 0 | -100,00 | 0 | -100,00 | ||||
| 2026-02-17 | 13F | Alliancebernstein L.p. | 82.143 | -0,83 | 1.974 | -15,54 | ||||
| 2026-01-20 | 13F | Harbor Capital Advisors, Inc. | 23.568 | -53,23 | 1 | -100,00 | ||||
| 2026-02-13 | 13F | Rhumbline Advisers | 86.153 | -13,39 | 2.070 | -26,23 | ||||
| 2025-10-30 | 13F | Parkside Financial Bank & Trust | 0 | -100,00 | 0 | |||||
| 2025-11-13 | 13F | Loomis Sayles & Co L P | 0 | -100,00 | 0 | -100,00 | ||||
| 2026-02-13 | 13F | Macquarie Group Ltd | 0 | -100,00 | 0 | |||||
| 2026-02-06 | 13F | Bare Financial Services, Inc | 200 | 5 | ||||||
| 2026-01-27 | 13F | TD Waterhouse Canada Inc. | 0 | -100,00 | 0 | |||||
| 2026-04-09 | 13F | Park Place Capital Corp | 27 | 1 | ||||||
| 2026-02-13 | 13F | Verition Fund Management LLC | 95.581 | 38,13 | 2.297 | 17,68 | ||||
| 2025-11-14 | 13F | Point72 Asia (Singapore) Pte. Ltd. | 665 | 19 | ||||||
| 2026-01-30 | 13F | Torren Management, LLC | 561 | 13 | ||||||
| 2026-02-12 | 13F | Federation des caisses Desjardins du Quebec | 124 | 0,00 | 3 | -33,33 | ||||
| 2026-02-11 | 13F | GW&K Investment Management, LLC | 0 | -100,00 | 0 | |||||
| 2026-02-11 | 13F | Deutsche Bank Ag\ | 59.953 | 3,32 | 1.441 | -11,98 | ||||
| 2026-02-13 | 13F | Boston Partners | 48.076 | 1.155 | ||||||
| 2026-02-17 | 13F | Delaware Management Holdings, Inc. | 1.862.656 | 44.760 | ||||||
| 2026-02-17 | 13F | Public Employees Retirement System Of Ohio | 103.595 | 14,31 | 2.489 | -2,62 | ||||
| 2026-02-06 | 13F | Larson Financial Group LLC | 1.211 | 666,46 | 29 | 625,00 | ||||
| 2026-02-02 | 13F | Artemis Investment Management LLP | 0 | -100,00 | 0 | |||||
| 2026-02-09 | 13F | Quest Partners LLC | 1.022 | -47,64 | 25 | -56,36 | ||||
| 2025-11-14 | 13F | Mount Yale Investment Advisors, LLC | 0 | -100,00 | 0 | -100,00 | ||||
| 2026-02-17 | 13F | XTX Topco Ltd | 24.126 | 580 | ||||||
| 2026-02-12 | 13F | State Board Of Administration Of Florida Retirement System | 17.199 | 0,00 | 413 | -14,85 | ||||
| 2026-02-17 | 13F | Susquehanna International Group, Llp | Put | 0 | -100,00 | 0 | ||||
| 2026-02-09 | 13F | Smith Chas P & Associates Pa Cpas | 57.260 | 0,00 | 1.376 | -14,86 | ||||
| 2025-11-12 | 13F | Xponance, Inc. | 0 | -100,00 | 0 | |||||
| 2026-02-11 | 13F | Fiera Capital Corp | 991.213 | 30,56 | 23.819 | 11,21 | ||||
| 2025-11-14 | 13F | Point72 (DIFC) Ltd | 354 | 10 | ||||||
| 2026-01-29 | 13F | Comerica Bank | 27.880 | -61,04 | 670 | -66,85 | ||||
| 2026-02-12 | 13F | Ensign Peak Advisors, Inc | 5.498 | -66,57 | 132 | -71,49 | ||||
| 2026-02-13 | 13F | FJ Capital Management LLC | 10.454 | 251 | ||||||
| 2026-02-06 | 13F | Pnc Financial Services Group, Inc. | 2.191 | -74,37 | 53 | -78,42 | ||||
| 2026-02-13 | 13F | State Street Corp | 2.131.619 | 0,71 | 51.223 | -14,22 | ||||
| 2026-02-12 | 13F | CIBC Private Wealth Group, LLC | 0 | -100,00 | 0 | -100,00 | ||||
| 2026-04-14 | 13F | Zrc Wealth Management, Llc | 672 | -42,42 | 15 | -50,00 | ||||
| 2026-02-11 | 13F | Rise Advisors, LLC | 0 | -100,00 | 0 | |||||
| 2026-02-17 | 13F | Captrust Financial Advisors | 43.083 | 280,89 | 1.035 | 224,45 | ||||
| 2026-02-05 | 13F | Bessemer Group Inc | 44.130 | 5,56 | 1 | 0,00 | ||||
| 2026-02-11 | 13F | Parallel Advisors, LLC | 125 | 68,92 | 3 | 50,00 | ||||
| 2026-04-07 | 13F | Signaturefd, Llc | 1.288 | 31,70 | 28 | 21,74 | ||||
| 2025-11-14 | 13F | Cetera Investment Advisers | 0 | -100,00 | 0 | -100,00 | ||||
| 2026-02-11 | 13F | Jpmorgan Chase & Co | 1.323.032 | -12,62 | 31.792 | -25,57 | ||||
| 2026-04-17 | 13F | HHM Wealth Advisors, LLC | 6.270 | 0,00 | 138 | -8,67 | ||||
| 2026-04-15 | 13F | Atwood & Palmer Inc | 392 | 0,00 | 9 | -11,11 | ||||
| 2026-02-10 | 13F | Rothschild Investment Llc | 23 | -58,18 | 1 | -100,00 | ||||
| 2026-02-12 | 13F | BlackRock, Inc. | 5.321.162 | 2,87 | 127.868 | -12,37 | ||||
| 2026-02-12 | 13F | Cibc World Markets Corp | 0 | -100,00 | 0 | |||||
| 2026-02-13 | 13F | Entrewealth, Llc | 37.337 | 29,71 | 731 | -10,10 | ||||
| 2026-02-14 | 13F | Rockefeller Capital Management L.P. | 120.622 | -77,44 | 2.899 | -80,79 | ||||
| 2026-03-11 | 13F | Leonteq Securities AG | 0 | -100,00 | 0 | |||||
| 2026-04-06 | 13F | Versant Capital Management, Inc | 838 | 7,02 | 18 | 0,00 | ||||
| 2026-02-02 | 13F | Kornitzer Capital Management Inc /ks | 179.519 | 0,00 | 4.314 | -14,83 | ||||
| 2026-02-12 | 13F | Dimensional Fund Advisors Lp | 1.142.389 | 3,96 | 27.457 | -11,42 | ||||
| 2026-02-13 | 13F | BNP Paribas Asset Management Holding S.A. | 1.159 | 45,06 | 0 | |||||
| 2026-02-13 | 13F | Great West Life Assurance Co /can/ | 7.510 | -63,46 | 0 | |||||
| 2026-02-13 | 13F | MAI Capital Management | 178.866 | 0,02 | 4.298 | -14,79 | ||||
| 2026-02-11 | 13F | J.Safra Asset Management Corp | 52 | 0,00 | 1 | 0,00 | ||||
| 2026-02-10 | 13F | Lido Advisors, LLC | 10.098 | 0,00 | 285 | 0,00 | ||||
| 2026-02-11 | 13F | Hughes Financial Services, LLC | 1 | 0 | ||||||
| 2026-02-12 | 13F | Principal Securities, Inc. | 0 | -100,00 | 0 | |||||
| 2026-01-21 | 13F | Stone House Investment Management, LLC | 9 | 0 | ||||||
| 2026-02-17 | 13F | California State Teachers Retirement System | 68.121 | 2,45 | 1.637 | -12,75 | ||||
| 2025-10-21 | 13F | Brown Miller Wealth Management, LLC | 0 | -100,00 | 0 | |||||
| 2025-10-30 | 13F | Strs Ohio | 0 | -100,00 | 0 | -100,00 | ||||
| 2026-02-13 | 13F | Morgan Stanley | 522.958 | 132,61 | 12.567 | 98,14 | ||||
| 2026-02-17 | 13F | Tower Research Capital LLC (TRC) | 7.956 | 152,41 | 191 | 117,05 | ||||
| 2026-01-28 | 13F | Arizona State Retirement System | 19.903 | -4,70 | 478 | -18,85 | ||||
| 2026-02-12 | 13F | New York State Common Retirement Fund | 219.810 | 0,00 | 5.282 | -14,81 | ||||
| 2026-04-06 | 13F | GAMMA Investing LLC | 889 | 9,62 | 20 | 0,00 | ||||
| 2026-02-12 | 13F | Bank Of Montreal /can/ | 0 | -100,00 | 0 | |||||
| 2026-02-17 | 13F | Advisory Services Network, LLC | 24.357 | 68,96 | 585 | 44,09 | ||||
| 2026-02-17 | 13F | Twinbeech Capital Lp | 37.773 | 908 | ||||||
| 2026-02-17 | 13F | Bamco Inc /ny/ | 3.010.428 | 0,01 | 72.341 | -14,81 | ||||
| 2026-02-13 | 13F | Milford Funds Ltd | 346.319 | 8.322 | ||||||
| 2026-04-20 | 13F | Ronald Blue Trust, Inc. | 6 | -98,83 | 0 | -100,00 | ||||
| 2026-02-17 | 13F | Janus Henderson Group Plc | 783.285 | -2,72 | 18.823 | -17,14 | ||||
| 2026-02-13 | 13F | Manufacturers Life Insurance Company, The | 0 | -100,00 | 0 | |||||
| 2026-02-12 | 13F | Steward Partners Investment Advisory, Llc | 9 | -83,33 | 0 | -100,00 | ||||
| 2026-01-26 | 13F | Private Trust Co Na | 430 | 17,17 | 10 | 0,00 | ||||
| 2026-01-28 | 13F | Teacher Retirement System Of Texas | 0 | -100,00 | 0 | |||||
| 2026-02-11 | 13F | Capital International Investors | 3.618.132 | 15,03 | 86.944 | -2,02 | ||||
| 2025-10-27 | 13F | Janney Montgomery Scott LLC | 0 | -100,00 | 0 | |||||
| 2026-02-11 | 13F | Los Angeles Capital Management Llc | 317 | 7 | ||||||
| 2026-04-13 | 13F | Massmutual Trust Co Fsb/adv | 41 | 20,59 | 1 | |||||
| 2025-10-29 | 13F | Verdence Capital Advisors LLC | 0 | -100,00 | 0 | -100,00 | ||||
| 2026-02-17 | 13F | D. E. Shaw & Co., Inc. | 0 | -100,00 | 0 | |||||
| 2026-04-16 | 13F | SG Americas Securities, LLC | 15.388 | -94,50 | 0 | -100,00 | ||||
| 2026-02-17 | 13F | Aster Capital Management (DIFC) Ltd | 160 | -68,99 | 4 | -78,57 | ||||
| 2026-01-26 | 13F | Cornerstone Wealth Group, LLC | 16.719 | 0,11 | 402 | -14,86 | ||||
| 2026-02-13 | 13F | Smartleaf Asset Management LLC | 40 | 122,22 | 1 | |||||
| 2026-02-17 | 13F | Point72 Asset Management, L.P. | 109.353 | -2,26 | 2.628 | -16,76 | ||||
| 2026-02-13 | 13F | SRS Capital Advisors, Inc. | 266 | 254,67 | 6 | 200,00 | ||||
| 2026-02-17 | 13F | SageView Advisory Group, LLC | 115 | 3 | ||||||
| 2026-01-29 | 13F | Vanguard Group Inc | 6.851.874 | 4,38 | 164.651 | -11,09 | ||||
| 2026-02-12 | 13F | Brown Brothers Harriman & Co | 165 | 4 | ||||||
| 2026-02-02 | 13F | Fifth Third Bancorp | 0 | -100,00 | 0 | |||||
| 2026-02-06 | 13F | EverSource Wealth Advisors, LLC | 378 | 800,00 | 9 | 800,00 | ||||
| 2026-02-06 | 13F | Summit Creek Advisors LLC | 148.465 | -11,86 | 3.568 | -24,92 | ||||
| 2026-04-13 | 13F | IFP Advisors, Inc | 2.916 | 1,29 | 64 | -8,70 | ||||
| 2026-02-10 | 13F | Bank of New York Mellon Corp | 2.873.887 | 25,28 | 69.060 | 6,72 | ||||
| 2026-02-13 | 13F | American Century Companies Inc | 993.079 | 187,23 | 23.864 | 144,67 | ||||
| 2026-02-05 | 13F | Amalgamated Bank | 2.243 | -2,82 | 0 | |||||
| 2026-02-17 | 13F | Holocene Advisors, LP | 63.242 | 9,87 | 1.520 | -6,41 | ||||
| 2026-02-12 | 13F | Pitcairn Co | 0 | -100,00 | 0 | |||||
| 2026-02-17 | 13F | Citadel Advisors Llc | 269.838 | 6.484 | ||||||
| 2025-11-14 | 13F/A | Skopos Labs, Inc. | 0 | -100,00 | 0 | -100,00 | ||||
| 2026-04-08 | 13F | Wealth Enhancement Advisory Services, Llc | 83.508 | -39,76 | 1.866 | -45,99 | ||||
| 2026-01-26 | 13F | Cwm, Llc | 738 | 176,40 | 0 | |||||
| 2026-01-30 | 13F | Arlington Trust Co LLC | 0 | -100,00 | 0 | |||||
| 2026-02-17 | 13F | Quantinno Capital Management LP | 26.087 | 204,01 | 627 | 158,68 | ||||
| 2026-02-06 | 13F | HighTower Advisors, LLC | 0 | -100,00 | 0 | |||||
| 2026-02-13 | 13F | Walleye Capital LLC | 38.933 | 936 | ||||||
| 2026-02-13 | 13F | Sterling Capital Management LLC | 467 | 174,71 | 11 | 175,00 | ||||
| 2026-02-11 | 13F | Capital Research Global Investors | 3.017.071 | -33,15 | 72.500 | -43,06 | ||||
| 2026-02-13 | 13F | Charles Schwab Investment Management Inc | 599.426 | 0,44 | 14.404 | -14,45 | ||||
| 2026-02-17 | 13F | Frontier Capital Management Co Llc | 256.901 | 6.173 | ||||||
| 2026-04-07 | 13F | Farther Finance Advisors, LLC | 300 | -24,05 | 6 | -33,33 | ||||
| 2026-02-17 | 13F | Select Equity Group, L.P. | 153.228 | -30,40 | 3.682 | -40,71 | ||||
| 2026-04-07 | 13F | CoreCap Advisors, LLC | 24 | 0,00 | 1 | |||||
| 2026-02-09 | 13F | King Luther Capital Management Corp | 8.560 | 0,00 | 206 | -14,94 | ||||
| 2026-02-09 | 13F | William Blair Investment Management, Llc | 7.543.813 | 47,78 | 181.278 | 25,88 | ||||
| 2026-02-12 | 13F | Beck Mack & Oliver Llc | 289.775 | 6.963 | ||||||
| 2025-11-14 | 13F | Mml Investors Services, Llc | 0 | -100,00 | 0 | |||||
| 2026-02-17 | 13F | Price T Rowe Associates Inc /md/ | 154.126 | 143,00 | 4 | 200,00 | ||||
| 2025-11-14 | 13F | Otter Creek Advisors, LLC | 130.677 | 23,01 | 4 | -99,93 | ||||
| 2026-01-30 | 13F | Us Bancorp \de\ | 4.269 | -55,70 | 103 | -62,36 | ||||
| 2026-02-17 | 13F | Lighthouse Investment Partners, LLC | 176.047 | 63,33 | 4.230 | 39,14 | ||||
| 2026-02-13 | 13F | Pinnacle Wealth Planning Services, Inc. | 227 | 5 | ||||||
| 2026-02-10 | 13F/A | Northwestern Mutual Wealth Management Co | 500 | 0,00 | 12 | -14,29 | ||||
| 2026-02-03 | 13F | SBI Securities Co., Ltd. | 3 | 0,00 | 0 | |||||
| 2026-02-11 | 13F | LPL Financial LLC | 66.448 | -3,72 | 1.597 | -17,99 | ||||
| 2025-11-13 | 13F | Riggs Asset Managment Co. Inc. | 0 | -100,00 | 0 | |||||
| 2026-02-04 | 13F | Madison Asset Management, LLC | 104.282 | -0,64 | 2.506 | -15,37 | ||||
| 2026-02-12 | 13F | Nuveen, LLC | 242.887 | 1,63 | 5.837 | -13,43 | ||||
| 2026-02-06 | 13F | Global Retirement Partners, LLC | 99 | 0,00 | 2 | 0,00 | ||||
| 2026-02-17 | 13F | Freestone Grove Partners LP | 0 | -100,00 | 0 | |||||
| 2025-11-14 | 13F | Nbc Securities, Inc. | 0 | -100,00 | 0 | |||||
| 2025-11-03 | 13F | Truist Financial Corp | 0 | -100,00 | 0 | -100,00 | ||||
| 2026-02-09 | 13F | MTM Investment Management, LLC | 700 | 0,00 | 17 | -15,79 | ||||
| 2025-11-12 | 13F | Commerce Bank | 0 | -100,00 | 0 | -100,00 | ||||
| 2026-02-13 | 13F | Stifel Financial Corp | 22.967 | 2,63 | 552 | -12,68 | ||||
| 2026-01-27 | 13F | Tributary Capital Management, LLC | 378.218 | -7,24 | 9.089 | -20,98 | ||||
| 2026-02-17 | 13F | Caption Management, LLC | Call | 48.100 | -42,87 | 1.156 | -51,37 | |||
| 2026-02-17 | 13F | Citadel Advisors Llc | Call | 0 | -100,00 | 0 | ||||
| 2026-02-09 | 13F | Geode Capital Management, Llc | 1.738.132 | 1,66 | 41.774 | -13,40 | ||||
| 2026-02-17 | 13F | Blair William & Co/il | 23.357 | -22,26 | 561 | -33,77 | ||||
| 2026-02-05 | 13F | Cambridge Investment Research Advisors, Inc. | 31.149 | 1,02 | 1 | |||||
| 2026-02-13 | 13F | Panagora Asset Management Inc | 26.783 | 4,89 | 644 | -10,69 | ||||
| 2026-02-13 | 13F | Ubs Asset Management Americas Inc | 190.560 | 2,28 | 4.579 | -12,86 | ||||
| 2026-02-12 | 13F | MetLife Investment Management, LLC | 619.292 | 1.376,37 | 14.882 | 1.157,90 | ||||
| 2026-02-13 | 13F | Kennedy Capital Management, Inc. | 819.695 | 37,02 | 19.697 | 16,72 | ||||
| 2026-02-10 | 13F | Quantbot Technologies LP | 0 | -100,00 | 0 | |||||
| 2026-02-13 | 13F | Wells Fargo & Company/mn | 179.913 | 13,24 | 4.323 | -3,53 | ||||
| 2026-02-17 | 13F | Royal Bank Of Canada | 901.166 | -9,32 | 21.655 | -22,75 | ||||
| 2026-01-15 | 13F | Fortitude Family Office, LLC | 0 | -100,00 | 0 | |||||
| 2025-11-14 | 13F | Two Sigma Investments, Lp | 0 | -100,00 | 0 | -100,00 | ||||
| 2026-02-13 | 13F | Motiv8 Investments LLC | 60 | 0 | ||||||
| 2026-02-05 | 13F | Allworth Financial LP | 313 | 187,16 | 8 | 133,33 | ||||
| 2026-02-17 | 13F | Cape Investment Advisory, Inc. | 55 | 0,00 | 1 | 0,00 | ||||
| 2026-02-09 | 13F | Emerald Advisers, Llc | 0 | -100,00 | 0 | |||||
| 2026-02-13 | 13F | Toroso Investments, LLC | 0 | -100,00 | 0 | |||||
| 2026-01-29 | 13F | Pictet Asset Management Holding SA | 11.166 | 19,19 | 268 | 1,52 | ||||
| 2026-02-06 | 13F | Handelsbanken Fonder AB | 21.700 | -13,55 | 1 | |||||
| 2026-02-13 | 13F | Public Employees Retirement Association Of Colorado | 8.429 | 0,00 | 0 | |||||
| 2026-02-17 | 13F | MIRAE ASSET GLOBAL ETFS HOLDINGS Ltd. | 33.138 | 1,44 | 796 | -13,57 | ||||
| 2026-04-14 | 13F | Yarbrough Capital, LLC | 0 | -100,00 | 0 | |||||
| 2025-11-21 | 13F/A | CIBC Bancorp USA Inc. | 7.495 | 211 | ||||||
| 2026-01-27 | 13F | First Horizon Corp | 959 | 80,26 | 23 | 53,33 | ||||
| 2026-01-28 | 13F | Peregrine Capital Management Llc | 0 | -100,00 | 0 | |||||
| 2026-02-17 | 13F | Westwood Holdings Group Inc | 2.851.518 | 14,56 | 68.522 | -2,41 | ||||
| 2026-02-09 | 13F | Legal & General Group Plc | 71.968 | -0,27 | 1.730 | -14,99 | ||||
| 2026-02-19 | 13F | CI Private Wealth, LLC | 33.981 | -31,25 | 817 | -41,46 | ||||
| 2025-10-30 | 13F | Envestnet Portfolio Solutions, Inc. | 0 | -100,00 | 0 | |||||
| 2026-04-07 | 13F | Pathway Financial Advisors LLC | 128.718 | 0,00 | 2.877 | -10,35 | ||||
| 2026-01-29 | 13F | UMA Financial Services, Inc. | 66 | 2 | ||||||
| 2025-11-12 | 13F | Group One Trading, L.p. | 0 | -100,00 | 0 | -100,00 | ||||
| 2025-11-14 | 13F | Core Wealth Advisors, Inc. | 0 | -100,00 | 0 | |||||
| 2026-02-12 | 13F | Venator Management LLC | 773.695 | 0,00 | 18.592 | -14,82 | ||||
| 2026-02-18 | 13F | GWM Advisors LLC | 0 | -100,00 | 0 | |||||
| 2025-11-14 | 13F | Aquatic Capital Management LLC | 0 | -100,00 | 0 | |||||
| 2026-02-02 | 13F | Oppenheimer Asset Management Inc. | 0 | -100,00 | 0 | |||||
| 2026-02-12 | 13F | Swiss National Bank | 140.700 | 2,70 | 3.381 | -12,50 | ||||
| 2026-02-13 | 13F | Cetera Trust Company, N.A | 8.070 | 33,94 | 194 | 14,20 | ||||
| 2026-02-17 | 13F | Advisor Group Holdings, Inc. | 773 | -60,96 | 19 | -67,27 | ||||
| 2026-02-17 | 13F | Magnetar Financial LLC | 0 | -100,00 | 0 | |||||
| 2026-02-17 | 13F | VARCOV Co. | 21.524 | 517 | ||||||
| 2026-02-11 | 13F | Westfield Capital Management Co Lp | 0 | -100,00 | 0 | |||||
| 2025-10-23 | 13F | Park Avenue Securities Llc | 0 | -100,00 | 0 | |||||
| 2026-01-29 | 13F | Dunhill Financial, LLC | 2 | 0 | ||||||
| 2026-02-06 | 13F | Covestor Ltd | 3 | 0,00 | 0 | |||||
| 2025-11-14 | 13F | Point72 Hong Kong Ltd | 316 | 9 | ||||||
| 2026-04-13 | 13F/A | Sunburst Financial Group, LLC | 29.281 | 642 | ||||||
| 2026-04-16 | 13F | Diversified Trust Co | 33.483 | -44,01 | 735 | -48,92 | ||||
| 2026-01-28 | 13F | Klp Kapitalforvaltning As | 15.300 | 4,79 | 368 | -10,71 | ||||
| 2026-02-04 | 13F | Washington Trust Bank | 36.217 | 92,24 | 870 | 63,84 | ||||
| 2026-02-17 | 13F | Laird Norton Trust Company, Llc | 97.991 | 0,02 | 2.355 | -14,80 | ||||
| 2026-01-26 | 13F | Quadrant Private Wealth Management, LLC | 66.901 | 584,76 | 1.608 | 484,36 | ||||
| 2026-02-09 | 13F | Annis Gardner Whiting Capital Advisors, LLC | 15.349 | 2,33 | 369 | -13,00 | ||||
| 2026-02-13 | 13F | Natixis | 34.000 | 0,00 | 817 | -14,81 | ||||
| 2026-02-17 | 13F | Dark Forest Capital Management Lp | 0 | -100,00 | 0 | -100,00 | ||||
| 2026-02-17 | 13F | Jones Financial Companies Lllp | 1.300 | 0,00 | 31 | -16,22 | ||||
| 2026-02-17 | 13F | Creative Planning | 27.640 | 248,42 | 664 | 197,76 | ||||
| 2026-02-13 | 13F | Mariner, LLC | 32.736 | 76,30 | 787 | 50,48 | ||||
| 2025-11-13 | 13F | Jefferies Financial Group Inc. | 0 | -100,00 | 0 | -100,00 | ||||
| 2025-11-10 | 13F | Granite Investment Partners, LLC | 0 | -100,00 | 0 | -100,00 | ||||
| 2026-02-12 | 13F | Brinker Capital Investments, LLC | 17.436 | -25,39 | 419 | -36,57 | ||||
| 2025-10-30 | 13F | Twin Peaks Wealth Advisors, LLC | 0 | -100,00 | 0 | |||||
| 2025-11-14 | 13F | Snowden Capital Advisors LLC | 0 | -100,00 | 0 | -100,00 | ||||
| 2026-01-27 | 13F | Zurcher Kantonalbank (Zurich Cantonalbank) | 41.339 | 0,00 | 993 | -14,84 |
Other Listings
| US:BWIN | 25,04 $ |