Grundlæggende statistik
| Institutionelle aktier (lange) | 37.822.999 - 40,81% (ex 13D/G) - change of -0,23MM shares -0,60% MRQ |
| Institutionel værdi (lang) | $ 135.747 USD ($1000) |
Institutionelt ejerskab og aktionærer
Anavex Life Sciences Corp. (US:AVXL) har 198 institutionelle ejere og aktionærer, der har indsendt 13D/G- eller 13F-formularer til Securities Exchange Commission (SEC). Disse institutioner har i alt 37,822,999 aktier. Største aktionærer omfatter BlackRock, Inc., Vanguard Group Inc, State Street Corp, Geode Capital Management, Llc, Two Sigma Investments, Lp, Two Sigma Advisers, Lp, Rosalind Advisors, Inc., Summit Financial, LLC, Goldman Sachs Group Inc, and Nwam Llc .
Anavex Life Sciences Corp. (NasdaqGS:AVXL) institutionel ejerskabsstruktur viser aktuelle positioner i virksomheden efter institutioner og fonde, samt seneste ændringer i positionsstørrelse. Større aktionærer kan omfatte individuelle investorer, investeringsforeninger, hedgefonde eller institutioner. Skema 13D angiver, at investoren besidder (eller besidder) mere end 5 % af virksomheden og har til hensigt (eller har til hensigt at) aktivt at forfølge en ændring i forretningsstrategi. Skema 13G indikerer en passiv investering på over 5%.
The share price as of March 31, 2026 is 3,07 / share. Previously, on April 1, 2025, the share price was 8,02 / share. This represents a decline of 61,72% over that period.

Fondens stemningsscore
Fund Sentiment Score (fka Ownership Accumulation Score) finder de aktier, der bliver mest købt af fonde. Det er resultatet af en sofistikeret, multi-faktor kvantitativ model, der identificerer virksomheder med de højeste niveauer af institutionel akkumulering. Scoringsmodellen bruger en kombination af den samlede stigning i oplyste ejere, ændringerne i porteføljeallokeringer i disse ejere og andre målinger. Tallet går fra 0 til 100, hvor højere tal indikerer et højere niveau af akkumulering for sine jævnaldrende, og 50 er gennemsnittet.
Opdateringsfrekvens: Dagligt
Se Ownership Explorer, som giver en liste over højest rangerende virksomheder.
AI+ Ask Fintel’s AI assistant about Anavex Life Sciences Corp..
Select a question to share a public post with an AI-crafted answer.
Thinking of good questions…
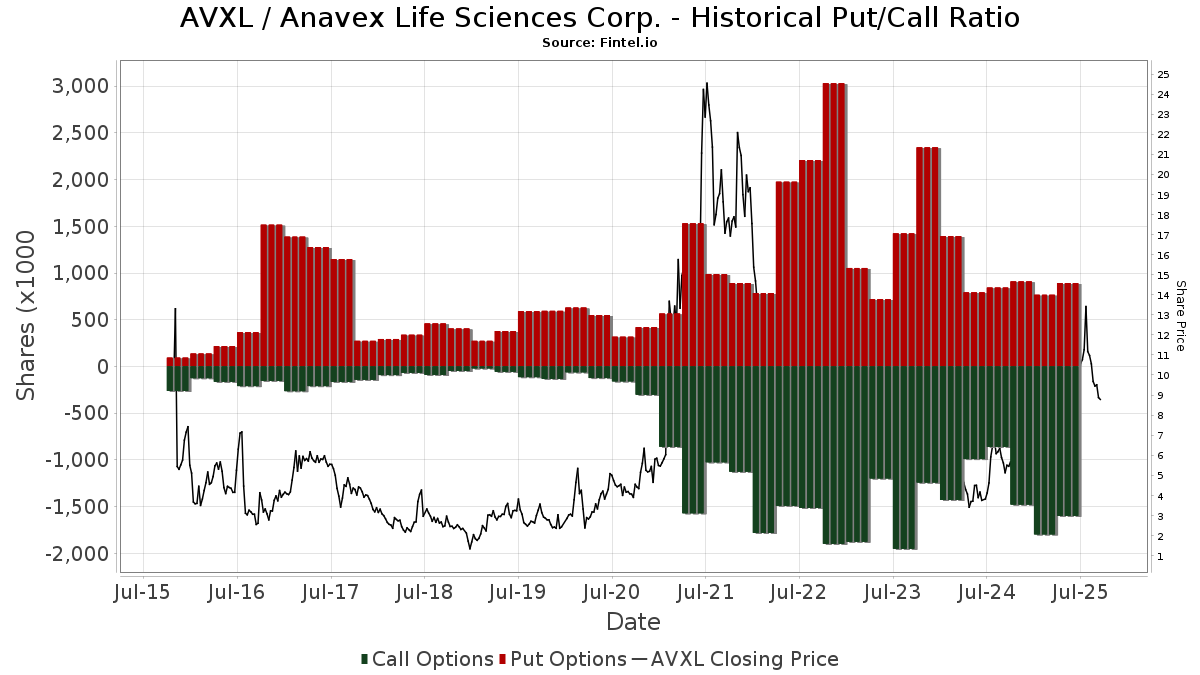
Institutionel Put/Call-forhold
Ud over at indberette standardaktie- og gældsudstedelser skal institutter med mere end 100 mill. aktiver under forvaltning også oplyse deres put- og call-optionsbeholdninger. Da salgsoptioner generelt indikerer negativ stemning, og købsoptioner indikerer positiv stemning, kan vi få en fornemmelse af den overordnede institutionelle stemning ved at plotte forholdet mellem put og kald. Diagrammet til højre viser det historiske put/call-forhold for dette instrument.
Brug af Put/Call Ratio som en indikator for investorernes stemning overvinder en af de vigtigste mangler ved at bruge totalt institutionelt ejerskab, som er, at en betydelig mængde af aktiver under forvaltning investeres passivt for at spore indekser. Passivt forvaltede fonde køber typisk ikke optioner, så indikatoren for put/call-forholdet følger mere nøje følelsen af aktivt forvaltede fonde.
13D/G-arkivering
Vi præsenterer 13D/G ansøgninger separat fra 13F ansøgninger på grund af den forskellige behandling af SEC. 13D/G-ansøgninger kan indgives af grupper af investorer (med én ledende), hvorimod 13F-ansøgninger ikke kan. Dette resulterer i situationer, hvor en investor kan indsende en 13D/G, der rapporterer én værdi for de samlede aktier (der repræsenterer alle de aktier, der ejes af investorgruppen), men derefter indsender en 13F, der rapporterer en anden værdi for de samlede aktier (der udelukkende repræsenterer deres egne) ejendomsret). Det betyder, at aktieejerskab af 13D/G-arkiver og 13F-arkiveringer ofte ikke er direkte sammenlignelige, så vi præsenterer dem separat.
Bemærk: Fra den 16. maj 2021 viser vi ikke længere ejere, der ikke har indsendt en 13D/G inden for det seneste år. Tidligere viste vi den fulde historie af 13D/G-arkiver. Generelt skal enheder, der er forpligtet til at indgive 13D/G-ansøgninger, indgive mindst årligt, før de indsender en afsluttende ansøgning. Dog forlader fonde nogle gange positioner uden at indsende en afsluttende ansøgning (dvs. de afvikler), så visning af den fulde historie resulterede nogle gange i forvirring om det nuværende ejerskab. For at undgå forvirring viser vi nu kun 'aktuelle' ejere - det vil sige - ejere, der har anmeldt inden for det seneste år.
Upgrade to unlock premium data.
| Fil dato | Form | Investor | Forrige Aktier |
Seneste Aktier |
Δ Aktier (Procent) |
Ejendomsret (Procent) |
Δ Ejerskab (Procent) |
|
|---|---|---|---|---|---|---|---|---|
| 2026-03-26 | VANGUARD GROUP INC | 4,360,648 | 0 | -100.00 | 0.00 | -100.00 |
13F og NPORT arkivering
Detaljer om 13F-arkivering er gratis. Detaljer om NP-ansøgninger kræver et premium-medlemskab. Grønne rækker angiver nye positioner. Røde rækker angiver lukkede positioner. Klik på linket ikon for at se den fulde transaktionshistorik.
Opgrader
for at låse premium-data op og eksportere til Excel ![]() .
.
| Fil dato | Kilde | Investor | Type | Gennemsnitlig pris (Øst) |
Aktier | Δ Aktier (%) |
Rapporteret Værdi ($1000) |
Δ Værdi (%) |
Port Alloc (%) |
|
|---|---|---|---|---|---|---|---|---|---|---|
| 2026-02-10 | 13F | Bank of New York Mellon Corp | 244.055 | -1,60 | 869 | -60,67 | ||||
| 2026-02-12 | 13F | MetLife Investment Management, LLC | 35.720 | -19,92 | 127 | -67,93 | ||||
| 2025-11-12 | 13F | American Century Companies Inc | 0 | -100,00 | 0 | -100,00 | ||||
| 2026-02-10 | 13F | Rothschild Investment Llc | 112 | -56,08 | 0 | -100,00 | ||||
| 2026-02-11 | 13F | LPL Financial LLC | 528.782 | -1,04 | 1.882 | -60,42 | ||||
| 2026-02-12 | 13F | Federated Hermes, Inc. | 367.841 | 1.310 | ||||||
| 2026-02-13 | 13F | Aigen Investment Management, Lp | 12.412 | 44 | ||||||
| 2026-01-30 | 13F | Opus Capital Group, LLC | 37.700 | 8,65 | 0 | |||||
| 2026-02-17 | 13F | Ameriflex Group, Inc. | 423 | -50,00 | 2 | -85,71 | ||||
| 2026-02-12 | 13F | Alps Advisors Inc | 73.361 | 90,02 | 261 | -23,91 | ||||
| 2025-11-13 | 13F | Glenmede Investment Management, LP | 0 | -100,00 | 0 | -100,00 | ||||
| 2026-02-12 | 13F | Rosalind Advisors, Inc. | Put | 1.168.600 | 1.881 | |||||
| 2026-02-13 | 13F | Ubs Asset Management Americas Inc | 162.124 | 0,04 | 577 | -59,99 | ||||
| 2026-01-29 | 13F | China Universal Asset Management Co., Ltd. | 14.559 | -3,30 | 52 | -61,65 | ||||
| 2026-02-13 | 13F | Manufacturers Life Insurance Company, The | 39.510 | -5,31 | 141 | -62,26 | ||||
| 2026-01-12 | 13F | AllSquare Wealth Management LLC | 52.383 | 0,00 | 466 | -3,32 | ||||
| 2026-02-12 | 13F | Cibc World Markets Corp | 0 | -100,00 | 0 | |||||
| 2026-02-12 | 13F | Commonwealth Equity Services, Llc | 10.489 | -90,22 | 37 | |||||
| 2026-01-23 | 13F | HBW Advisory Services LLC | 11.139 | 40 | ||||||
| 2026-02-17 | 13F | Persistent Asset Partners Ltd | Call | 322 | 0,00 | 5 | -91,84 | |||
| 2026-02-13 | 13F | SRS Capital Advisors, Inc. | 10 | -95,31 | 0 | -100,00 | ||||
| 2025-11-13 | 13F | Seacrest Wealth Management, Llc | 0 | -100,00 | 0 | -100,00 | ||||
| 2026-02-04 | 13F | Strategic Family Wealth Counselors, L.L.C. | 0 | -100,00 | 0 | -100,00 | ||||
| 2026-02-13 | 13F | Pinnacle Wealth Planning Services, Inc. | 43 | 0 | ||||||
| 2026-02-09 | 13F | Hartland & Co., LLC | 481 | 0,00 | 2 | -75,00 | ||||
| 2026-01-28 | 13F | N.E.W. Advisory Services LLC | 2.293 | 0,00 | 8 | -60,00 | ||||
| 2026-02-17 | 13F | Nomura Holdings Inc | Call | 0 | -100,00 | 0 | -100,00 | |||
| 2026-03-04 | 13F | Hayek Kallen Investment Management | 0 | -100,00 | 0 | |||||
| 2025-11-14 | 13F | Wolverine Trading, Llc | Call | 151.500 | 1.310 | |||||
| 2025-11-14 | 13F | Wolverine Trading, Llc | Put | 78.000 | 675 | |||||
| 2026-02-18 | 13F | GWM Advisors LLC | 28.231 | 1.636,22 | 101 | 614,29 | ||||
| 2026-02-17 | 13F | Bank Of America Corp /de/ | 524.189 | 206,75 | 1.866 | 22,76 | ||||
| 2026-02-17 | 13F | Nomura Holdings Inc | Put | 0 | -100,00 | 0 | -100,00 | |||
| 2026-02-14 | 13F | POM Investment Strategies, LLC | 1.000 | 0,00 | 4 | -62,50 | ||||
| 2026-02-18 | 13F | Beacon Pointe Advisors, LLC | 23.000 | 0,00 | 82 | -60,29 | ||||
| 2026-01-29 | 13F | IMC-Chicago, LLC | Call | 159.700 | 79,04 | 569 | -28,37 | |||
| 2026-02-17 | 13F | Two Sigma Securities, Llc | 21.468 | 76 | ||||||
| 2025-11-06 | 13F | Stratos Wealth Partners, LTD. | 0 | -100,00 | 0 | |||||
| 2026-01-20 | 13F | October Effect Ltd | 46.280 | -81,13 | 165 | -92,48 | ||||
| 2026-02-13 | 13F | BNP Paribas Asset Management Holding S.A. | 1.321 | 45,32 | 0 | |||||
| 2026-02-13 | 13F | Wells Fargo & Company/mn | 133.820 | 17,52 | 476 | -53,01 | ||||
| 2026-02-17 | 13F | Caption Management, LLC | 354.838 | 1.263 | ||||||
| 2026-02-17 | 13F | Caption Management, LLC | Call | 60.000 | 0,00 | 214 | -60,11 | |||
| 2025-11-14 | 13F | ADAR1 Capital Management, LLC | 0 | -100,00 | 0 | -100,00 | ||||
| 2026-02-17 | 13F | Advisor Group Holdings, Inc. | 31.735 | -25,18 | 113 | -72,00 | ||||
| 2026-01-22 | 13F | Premier Path Wealth Partners, LLC | 10.000 | 0,00 | 36 | -60,67 | ||||
| 2026-02-13 | 13F | Stifel Financial Corp | 101.020 | 95,05 | 360 | -21,96 | ||||
| 2026-02-11 | 13F | Heartland Advisors Inc | 0 | -100,00 | 0 | -100,00 | ||||
| 2025-11-10 | 13F | Strategic Family Wealth Counselors, L.L.C. | Call | 62 | -3,12 | |||||
| 2026-02-09 | 13F | Legal & General Group Plc | 86.900 | 0,04 | 310 | -60,03 | ||||
| 2026-02-11 | 13F | Deutsche Bank Ag\ | 69.547 | -4,30 | 248 | -61,76 | ||||
| 2026-02-12 | 13F | Hamilton Point Investment Advisors, LLC | 20.300 | 0,00 | 72 | -60,00 | ||||
| 2026-02-10 | 13F | Bnp Paribas Arbitrage, Sa | 8.957 | -73,48 | 32 | -89,67 | ||||
| 2026-01-23 | 13F | Carnegie Capital Asset Management, LLC | 67.578 | -18,36 | 241 | -67,39 | ||||
| 2026-02-17 | 13F | Two Sigma Advisers, Lp | 1.209.570 | 59,47 | 4.306 | -36,21 | ||||
| 2026-01-12 | 13F | Byrne Asset Management LLC | 0 | -100,00 | 0 | -100,00 | ||||
| 2026-01-22 | 13F | Bnc Wealth Management, Llc | 12.250 | 19,51 | 44 | -52,75 | ||||
| 2026-01-29 | 13F | Vanguard Group Inc | 5.028.534 | -1,49 | 17.902 | -60,60 | ||||
| 2026-02-17 | 13F | Schonfeld Strategic Advisors LLC | 46.195 | 164 | ||||||
| 2026-02-17 | 13F | Jones Financial Companies Lllp | 5.268 | 6,15 | 19 | -57,14 | ||||
| 2026-01-26 | 13F | Cwm, Llc | 1.411 | -55,23 | 0 | |||||
| 2026-01-28 | 13F | Klp Kapitalforvaltning As | 16.400 | 0,00 | 58 | -60,00 | ||||
| 2026-01-29 | 13F | Pictet Asset Management Holding SA | 19.603 | 0,00 | 70 | -60,34 | ||||
| 2026-01-23 | 13F | Freestone Capital Holdings, LLC | 0 | -100,00 | 0 | |||||
| 2026-02-11 | 13F | Franklin Resources Inc | 72.560 | -80,66 | 258 | -97,66 | ||||
| 2026-02-11 | 13F | Vermillion Wealth Management, Inc. | 3.177 | 0,00 | 11 | -60,71 | ||||
| 2026-02-05 | 13F | Dana Investment Advisors, Inc. | 20.406 | 0,00 | 73 | -60,22 | ||||
| 2026-02-10 | 13F | Axq Capital, Lp | 24.996 | 30,86 | 89 | -47,93 | ||||
| 2026-01-27 | 13F | Gf Fund Management Co. Ltd. | 1.755 | -5,03 | 6 | -62,50 | ||||
| 2026-02-04 | 13F | Hikari Power Ltd | 85.585 | 0,00 | 0 | |||||
| 2026-02-11 | 13F | Jpmorgan Chase & Co | 56.537 | 25,46 | 201 | -49,88 | ||||
| 2026-02-09 | 13F | Harbour Investments, Inc. | 885 | 0,00 | 3 | -57,14 | ||||
| 2026-02-17 | 13F | Man Group plc | 55.223 | 126,46 | 197 | -9,68 | ||||
| 2026-02-11 | 13F | Los Angeles Capital Management Llc | 627 | 5 | ||||||
| 2026-02-12 | 13F | Wealthspire Advisors, LLC | 0 | -100,00 | 0 | -100,00 | ||||
| 2026-01-30 | 13F | Turning Point Benefit Group, Inc. | 150 | 1 | ||||||
| 2026-02-13 | 13F | Walleye Trading LLC | Call | 20.000 | 71 | |||||
| 2026-02-13 | 13F | State Street Corp | 4.383.406 | 33,35 | 15.605 | -46,66 | ||||
| 2026-02-13 | 13F | Kilter Group LLC | 1.597 | 0,00 | 6 | -64,29 | ||||
| 2025-11-14 | 13F | Lido Advisors, LLC | 0 | -100,00 | 0 | |||||
| 2026-02-10 | 13F | Daiwa Securities Group Inc. | 314 | 0,00 | 0 | |||||
| 2026-02-13 | 13F | Walleye Trading LLC | Put | 1.800 | 6 | |||||
| 2026-01-08 | 13F | Versant Capital Management, Inc | 0 | -100,00 | 0 | -100,00 | ||||
| 2026-02-12 | 13F | Bank Of Montreal /can/ | 32.440 | 41,32 | 115 | -43,63 | ||||
| 2026-02-17 | 13F | Northern Trust Corp | 738.242 | -4,50 | 2.628 | -61,80 | ||||
| 2026-02-02 | 13F | Strs Ohio | 0 | -100,00 | 0 | |||||
| 2026-02-03 | 13F | Orion Capital Management LLC | 1.500 | 0,00 | 5 | -61,54 | ||||
| 2026-02-17 | 13F | Twinbeech Capital Lp | 0 | -100,00 | 0 | |||||
| 2026-02-17 | 13F | Engineers Gate Manager LP | 0 | -100,00 | 0 | -100,00 | ||||
| 2026-02-09 | 13F | Geode Capital Management, Llc | 2.022.912 | -0,22 | 7.203 | -60,09 | ||||
| 2026-02-06 | 13F | Covestor Ltd | 9 | 0,00 | 0 | |||||
| 2026-02-17 | 13F | California State Teachers Retirement System | 78.005 | -0,45 | 278 | -60,26 | ||||
| 2026-01-28 | 13F | Teacher Retirement System Of Texas | 13.261 | -36,63 | 47 | -74,73 | ||||
| 2026-02-12 | 13F | Graetz Wealth LLC | 14.044 | 50 | ||||||
| 2026-02-17 | 13F | State Of Wisconsin Investment Board | 0 | -100,00 | 0 | |||||
| 2025-10-30 | 13F | Twin Peaks Wealth Advisors, LLC | 0 | -100,00 | 0 | |||||
| 2026-02-17 | 13F | Point72 Asset Management, L.P. | 278.018 | 990 | ||||||
| 2026-02-17 | 13F | Janus Henderson Group Plc | 37.000 | 0,00 | 132 | -60,18 | ||||
| 2025-11-14 | 13F | Corton Capital Inc. | 0 | -100,00 | 0 | -100,00 | ||||
| 2026-02-17 | 13F | Canada Pension Plan Investment Board | 95.900 | 341 | ||||||
| 2026-01-09 | 13F | 180 Wealth Advisors, Llc | 117.380 | 172,75 | 418 | 8,88 | ||||
| 2026-02-13 | 13F | Integrated Wealth Concepts LLC | 12.996 | 46 | ||||||
| 2026-01-23 | 13F | Assetmark, Inc | 0 | -100,00 | 0 | |||||
| 2026-02-13 | 13F | Sculptor Capital LP | Put | 155.900 | 0,00 | 555 | -59,99 | |||
| 2026-02-13 | 13F | Charles Schwab Investment Management Inc | 668.956 | -6,75 | 2.381 | -62,70 | ||||
| 2026-02-05 | 13F | Atria Investments Llc | 23.340 | 11,62 | 83 | -55,38 | ||||
| 2026-02-13 | 13F | Sculptor Capital LP | 155.900 | 0,00 | 555 | -59,99 | ||||
| 2026-02-13 | 13F | Squarepoint Ops LLC | 56.363 | 201 | ||||||
| 2026-02-17 | 13F | Advisory Services Network, LLC | 0 | -100,00 | 0 | |||||
| 2026-02-13 | 13F | Citigroup Inc | 25.645 | 123,16 | 91 | -10,78 | ||||
| 2026-02-19 | 13F | Invesco Ltd. | 45.487 | -19,77 | 162 | -68,06 | ||||
| 2026-01-29 | 13F | IMC-Chicago, LLC | Put | 0 | -100,00 | 0 | -100,00 | |||
| 2026-02-13 | 13F | Mariner, LLC | 38.821 | 47,29 | 138 | -41,03 | ||||
| 2026-02-17 | 13F | Brevan Howard Capital Management LP | 54.727 | 217,74 | 195 | 26,80 | ||||
| 2026-02-13 | 13F | Parkside Financial Bank & Trust | 0 | -100,00 | 0 | |||||
| 2026-02-17 | 13F | Diadema Partners Lp | Call | 140.600 | 0,57 | 501 | -59,81 | |||
| 2026-02-04 | 13F | Nwam Llc | 870.796 | -0,40 | 4.371 | -46,58 | ||||
| 2026-02-13 | 13F | Police & Firemen's Retirement System of New Jersey | 23.092 | 0,00 | 82 | -60,00 | ||||
| 2026-02-13 | 13F | Barclays Plc | 493.172 | 217,81 | 1.756 | 99,21 | ||||
| 2026-02-13 | 13F | National Bank Of Canada /fi/ | Put | 3.042 | -22,44 | 1.083 | -69,00 | |||
| 2026-02-03 | 13F | SBI Securities Co., Ltd. | 1.579 | -85,48 | 6 | -94,79 | ||||
| 2026-02-17 | 13F | Cetera Investment Advisers | 42.856 | 51,66 | 153 | -39,44 | ||||
| 2026-02-02 | 13F | Millstone Evans Group, LLC | 3.000 | 0,00 | 11 | -61,54 | ||||
| 2026-02-17 | 13F | Creative Planning | 72.745 | -5,69 | 259 | -62,39 | ||||
| 2026-02-17 | 13F | Private Advisor Group, LLC | 419.800 | -7,76 | 1.494 | -63,11 | ||||
| 2026-01-05 | 13F | GAMMA Investing LLC | 444 | -69,48 | 2 | -91,67 | ||||
| 2026-02-13 | 13F | MAI Capital Management | 310 | 0,00 | 1 | -50,00 | ||||
| 2026-01-26 | 13F | Foster Victor Wealth Advisors, LLC | 39.925 | -1,37 | 200 | -50,37 | ||||
| 2025-11-14 | 13F | Balyasny Asset Management Llc | 0 | -100,00 | 0 | |||||
| 2026-01-26 | 13F | Prairiewood Capital, LLC | 0 | -100,00 | 0 | -100,00 | ||||
| 2025-10-08 | 13F | Sheets Smith Investment Management | 135.948 | 1.210 | ||||||
| 2026-02-10 | 13F | Envestnet Asset Management Inc | 87.674 | 46,26 | 312 | -41,46 | ||||
| 2026-02-03 | 13F/A | Bank Of America Corp /de/ | Put | 0 | -100,00 | 0 | -100,00 | |||
| 2026-02-12 | 13F | BlackRock, Inc. | 7.526.130 | 4,70 | 26.793 | -58,12 | ||||
| 2026-03-11 | 13F | Leonteq Securities AG | 0 | -100,00 | 0 | |||||
| 2026-02-06 | 13F | Larson Financial Group LLC | 1.239 | 110,36 | 4 | -20,00 | ||||
| 2026-02-03 | 13F | Coston, McIsaac & Partners | 200 | 0,00 | 0 | |||||
| 2026-01-29 | 13F | Comerica Bank | 3.610 | 13 | ||||||
| 2026-01-30 | 13F | Kohmann Bosshard Financial Services, LLC | 1.500 | 5 | ||||||
| 2026-02-17 | 13F | Raymond James Financial Inc | 16.656 | -24,10 | 59 | -69,74 | ||||
| 2026-02-10 | 13F | State of Wyoming | 3.710 | 27,84 | 13 | -48,00 | ||||
| 2026-02-12 | 13F | Jane Street Group, Llc | Call | 66.500 | -25,95 | 237 | -70,46 | |||
| 2026-02-17 | 13F | Ameriprise Financial Inc | 68.525 | -20,13 | 244 | -68,15 | ||||
| 2026-02-12 | 13F | Jane Street Group, Llc | 768.955 | 252,38 | 2.737 | 40,94 | ||||
| 2025-11-21 | 13F | Watts Gwilliam & Co., LLC | 26.000 | 0,00 | 231 | 2,67 | ||||
| 2026-02-09 | 13F | Delta Asset Management Llc/tn | 16.000 | 23,08 | 57 | -51,30 | ||||
| 2026-02-12 | 13F | Jane Street Group, Llc | Put | 24.700 | 88 | |||||
| 2025-11-07 | 13F | Beacon Capital Management, LLC | 0 | -100,00 | 0 | |||||
| 2026-03-06 | 13F | Hsbc Holdings Plc | 28.784 | 104 | ||||||
| 2025-11-21 | 13F | Watts Gwilliam & Co., LLC | Call | 109.000 | 0,00 | 126 | 35,48 | |||
| 2026-02-12 | 13F | Summit Financial, LLC | 903.392 | 103,34 | 3.216 | -18,66 | ||||
| 2026-02-06 | 13F | EverSource Wealth Advisors, LLC | 0 | -100,00 | 0 | |||||
| 2026-02-05 | 13F | Amalgamated Bank | 2.626 | 1,39 | 0 | |||||
| 2026-02-11 | 13F | Janney Montgomery Scott LLC | 0 | -100,00 | 0 | |||||
| 2026-02-13 | 13F | S&t Bank/pa | 100 | 0,00 | 0 | |||||
| 2026-02-17 | 13F/A | Kovack Advisors, Inc. | 0 | -100,00 | 0 | -100,00 | ||||
| 2026-01-08 | 13F | Wealth Enhancement Advisory Services, Llc | 14.553 | 26,71 | 58 | -48,21 | ||||
| 2026-01-26 | 13F | Mirae Asset Global Investments Co., Ltd. | 4.342 | 30,74 | 15 | -48,28 | ||||
| 2026-02-17 | 13F | Susquehanna International Group, Llp | 439.499 | -27,21 | 1.565 | -70,89 | ||||
| 2025-11-24 | 13F | CIBC Private Wealth Group, LLC | 0 | -100,00 | 0 | -100,00 | ||||
| 2026-02-17 | 13F | Alliancebernstein L.p. | 115.200 | 0,00 | 410 | -60,00 | ||||
| 2026-02-17 | 13F | Susquehanna International Group, Llp | Put | 364.500 | -47,73 | 1.298 | -79,10 | |||
| 2026-02-17 | 13F | Susquehanna International Group, Llp | Call | 576.700 | -2,85 | 2.053 | -61,14 | |||
| 2026-02-03 | 13F | Pier Capital, LLC | 0 | -100,00 | 0 | |||||
| 2026-02-17 | 13F | Two Sigma Investments, Lp | 1.653.696 | 59,48 | 5.887 | -36,21 | ||||
| 2026-02-12 | 13F | State Board Of Administration Of Florida Retirement System | 20.345 | 0,00 | 72 | -60,22 | ||||
| 2026-02-06 | 13F | Gsa Capital Partners Llp | 155.879 | 147,11 | 1 | |||||
| 2025-11-14 | 13F | Balyasny Asset Management Llc | Call | 0 | -100,00 | 0 | ||||
| 2026-02-17 | 13F | Price T Rowe Associates Inc /md/ | 46.279 | 1,47 | 0 | |||||
| 2026-02-17 | 13F | Optiver Holding B.V. | 0 | -100,00 | 0 | -100,00 | ||||
| 2026-02-10 | 13F | Goldman Sachs Group Inc | 872.968 | 187,74 | 3.108 | 15,07 | ||||
| 2026-01-21 | 13F | Clayton Financial Group LLC | 500 | 2 | ||||||
| 2026-01-30 | 13F | Pvg Asset Management Corp | 216.295 | 62,45 | 770 | -35,02 | ||||
| 2026-02-13 | 13F | Rafferty Asset Management, LLC | 156.301 | 44,15 | 556 | -42,38 | ||||
| 2026-01-23 | 13F | Rsm Us Wealth Management Llc | 31.991 | -2,90 | 122 | -58,70 | ||||
| 2026-02-17 | 13F | Snowden Capital Advisors LLC | 42.717 | 152 | ||||||
| 2025-11-14 | 13F/A | Skopos Labs, Inc. | 0 | -100,00 | 0 | |||||
| 2026-01-15 | 13F | Fortitude Family Office, LLC | 205 | 1 | ||||||
| 2026-01-26 | 13F | Thomasville National Bank | 15.000 | 0,00 | 53 | -60,15 | ||||
| 2026-02-13 | 13F | Sei Investments Co | 11.611 | 0,00 | 41 | -60,19 | ||||
| 2026-02-11 | 13F | Group One Trading, L.p. | Call | 489.700 | 49,39 | 1.743 | -40,25 | |||
| 2026-02-13 | 13F | Morgan Stanley | 474.856 | -15,23 | 1.690 | -66,10 | ||||
| 2026-02-17 | 13F | XTX Topco Ltd | 99.058 | 21,24 | 353 | -51,58 | ||||
| 2026-01-30 | 13F | Activest Wealth Management | 4.001 | 0,00 | 14 | -60,00 | ||||
| 2026-02-11 | 13F | Group One Trading, L.p. | Put | 146.100 | -15,79 | 520 | -66,32 | |||
| 2026-02-17 | 13F | Sig Brokerage, Lp | Call | 62.000 | 0,00 | 221 | -60,07 | |||
| 2026-02-12 | 13F | Renaissance Technologies Llc | 25.422 | 91 | ||||||
| 2026-02-17 | 13F | Gladstone Institutional Advisory LLC | 68.504 | 15,08 | 244 | -54,06 | ||||
| 2026-01-29 | 13F | UMA Financial Services, Inc. | 0 | -100,00 | 0 | |||||
| 2026-02-06 | 13F | IFP Advisors, Inc | 2.000 | 0,00 | 7 | -58,82 | ||||
| 2026-01-20 | 13F | Sheets Smith Wealth Management | 117.696 | 419 | ||||||
| 2026-02-10 | 13F | Root Financial Partners, LLC | 110 | -83,99 | 0 | -100,00 | ||||
| 2026-01-21 | 13F | Apella Capital, LLC | 138.006 | 38,67 | 491 | -45,20 | ||||
| 2026-02-17 | 13F | Quantinno Capital Management LP | 45.711 | 33,37 | 163 | -46,89 | ||||
| 2026-02-13 | 13F | Graney & King, LLC | 0 | -100,00 | 0 | -100,00 | ||||
| 2026-01-08 | 13F | True Wealth Design, LLC | 3 | 0 | ||||||
| 2026-01-27 | 13F | Forum Financial Management, LP | 30.140 | 0,00 | 107 | -60,07 | ||||
| 2026-02-23 | 13F | Virtu Financial LLC | 0 | -100,00 | 0 | |||||
| 2026-02-12 | 13F | Voya Investment Management Llc | 15.635 | 0,00 | 56 | -60,43 | ||||
| 2026-02-12 | 13F | Swiss National Bank | 164.400 | 0,00 | 585 | -60,01 | ||||
| 2026-02-10 | 13F/A | Northwestern Mutual Wealth Management Co | 2.892 | -29,99 | 10 | -72,22 | ||||
| 2026-02-12 | 13F | Dimensional Fund Advisors Lp | 27.232 | 97 | ||||||
| 2026-02-14 | 13F | Rockefeller Capital Management L.P. | 7.552 | 2,05 | 27 | -60,00 | ||||
| 2026-02-17 | 13F | D. E. Shaw & Co., Inc. | Call | 45.000 | 160 | |||||
| 2026-02-13 | 13F | Rhumbline Advisers | 107.404 | -13,38 | 382 | -65,37 | ||||
| 2026-02-04 | 13F | Atlantic Union Bankshares Corp | 0 | -100,00 | 0 | -100,00 | ||||
| 2026-02-26 | 13F/A | Aristides Capital LLC | Put | 110.000 | 0,00 | 392 | -60,06 | |||
| 2025-11-05 | 13F | Bessemer Group Inc | 0 | -100,00 | 0 | |||||
| 2026-01-20 | 13F | Signaturefd, Llc | 1.039 | -15,46 | 4 | -70,00 | ||||
| 2026-01-23 | 13F | Farther Finance Advisors, LLC | 83 | -36,15 | 0 | -100,00 | ||||
| 2026-02-10 | 13F | Intech Investment Management Llc | 36.945 | 0,00 | 132 | -60,06 | ||||
| 2026-01-09 | 13F | SG Americas Securities, LLC | 18.927 | 73,01 | 0 | |||||
| 2026-02-17 | 13F | Fmr Llc | 14.429 | 36,06 | 51 | -45,74 | ||||
| 2026-02-13 | 13F | Walleye Capital LLC | Put | 20.000 | 71 | |||||
| 2026-02-13 | 13F | Walleye Capital LLC | 6.009 | 21 | ||||||
| 2026-02-04 | 13F | Independent Advisor Alliance | 50.076 | 4,76 | 178 | -58,12 | ||||
| 2026-02-13 | 13F | Walleye Capital LLC | Call | 35.000 | 125 | |||||
| 2026-02-17 | 13F | Qube Research & Technologies Ltd | 388.718 | 1.384 | ||||||
| 2026-02-11 | 13F | Parallel Advisors, LLC | 439 | -37,20 | 2 | -83,33 | ||||
| 2026-02-17 | 13F | Citadel Advisors Llc | 113.739 | -41,89 | 405 | -76,79 | ||||
| 2026-01-28 | 13F | Geneos Wealth Management Inc. | 48.200 | 13,68 | 172 | -54,64 | ||||
| 2026-02-17 | 13F | Citadel Advisors Llc | Put | 222.100 | 175,90 | 791 | 10,34 | |||
| 2026-02-17 | 13F | Citadel Advisors Llc | Call | 707.300 | 80,85 | 2.518 | -27,67 | |||
| 2026-02-06 | 13F | Advisory Alpha, LLC | 12.333 | 44 | ||||||
| 2026-02-17 | 13F | LMR Partners LLP | Put | 35.200 | 125 | |||||
| 2026-01-15 | 13F | Nisa Investment Advisors, Llc | 320 | -71,45 | 1 | -88,89 | ||||
| 2026-01-28 | 13F | Arizona State Retirement System | 23.386 | -7,33 | 83 | -62,95 | ||||
| 2026-02-13 | 13F | Quarry LP | 0 | -100,00 | 0 | -100,00 | ||||
| 2026-02-06 | 13F | Pnc Financial Services Group, Inc. | 63.687 | -0,53 | 227 | -60,28 | ||||
| 2026-02-13 | 13F | Verition Fund Management LLC | 0 | -100,00 | 0 | |||||
| 2026-02-13 | 13F | Smartleaf Asset Management LLC | 906 | 2,60 | 3 | -57,14 | ||||
| 2026-02-13 | 13F | National Bank Of Canada /fi/ | 305.200 | -22,37 | 1.087 | -68,96 | ||||
| 2026-02-12 | 13F | Steward Partners Investment Advisory, Llc | 2.319 | 27,49 | 8 | -50,00 | ||||
| 2026-02-12 | 13F | Nuveen, LLC | 168.377 | 0,00 | 599 | -60,01 | ||||
| 2025-10-28 | 13F | Magnus Financial Group LLC | Call | 107 | ||||||
| 2026-02-17 | 13F | Russell Investments Group, Ltd. | 6.924 | -0,86 | 25 | -61,29 | ||||
| 2026-02-10 | 13F | Belvedere Trading LLC | Call | 11.000 | 39 | |||||
| 2026-01-27 | 13F | Zurcher Kantonalbank (Zurich Cantonalbank) | 64.947 | 48,23 | 231 | -40,62 | ||||
| 2026-01-14 | 13F | Spire Wealth Management | 2.645 | 0,00 | 9 | -60,87 | ||||
| 2026-02-17 | 13F | Tower Research Capital LLC (TRC) | 6.395 | -4,42 | 23 | -62,71 | ||||
| 2026-02-13 | 13F | Saxon Interests, Inc. | 16.998 | -4,62 | 61 | -64,91 | ||||
| 2026-02-04 | 13F | Tsfg, Llc | 30 | 0,00 | 0 | |||||
| 2026-02-17 | 13F | MIRAE ASSET GLOBAL ETFS HOLDINGS Ltd. | 47.927 | 8,72 | 173 | -55,90 | ||||
| 2026-02-05 | 13F | Cambridge Investment Research Advisors, Inc. | 22.060 | 4,52 | 0 | |||||
| 2025-11-14 | 13F | National Bank Of Canada /fi/ | Call | 0 | -100,00 | 0 | -100,00 | |||
| 2026-02-10 | 13F | IAG Wealth Partners, LLC | 1.880 | 0,00 | 7 | -62,50 | ||||
| 2026-02-05 | 13F | Allworth Financial LP | 104 | -98,48 | 0 | -100,00 | ||||
| 2026-01-26 | 13F | American Wealth Advisors, LLC | 424 | 0,00 | 2 | -66,67 | ||||
| 2026-02-17 | 13F | Royal Bank Of Canada | 15.485 | 7,50 | 56 | -56,59 | ||||
| 2026-02-13 | 13F | Marshall Wace, Llp | 0 | -100,00 | 0 | |||||
| 2026-02-17 | 13F | Wellington Management Group Llp | 272.231 | -5,74 | 969 | -62,30 | ||||
| 2026-02-11 | 13F | Simplex Trading, Llc | Put | 89.900 | -51,14 | 320 | 31.900,00 | |||
| 2026-02-10 | 13F | Yukon Wealth Management, Inc. | 18.045 | 6,20 | 75 | -50,99 | ||||
| 2026-02-11 | 13F | Simplex Trading, Llc | Call | 278.300 | 25,76 | 991 | 98.900,00 | |||
| 2026-02-09 | 13F | Quest Partners LLC | 6.036 | 86,93 | 21 | -25,00 | ||||
| 2026-02-06 | 13F | ProShare Advisors LLC | 19.224 | 10,78 | 68 | -55,84 | ||||
| 2026-02-12 | 13F | New York State Common Retirement Fund | 18.209 | 0,00 | 65 | -60,49 | ||||
| 2026-02-13 | 13F | Prudential Financial Inc | 0 | -100,00 | 0 | -100,00 | ||||
| 2026-01-30 | 13F | Us Bancorp \de\ | 5.000 | -8,74 | 18 | -64,58 | ||||
| 2026-02-17 | 13F | Aqr Capital Management Llc | 149.815 | 434,37 | 533 | 114,06 | ||||
| 2026-02-13 | 13F | Sterling Capital Management LLC | 561 | 176,35 | 2 | 0,00 | ||||
| 2026-02-06 | 13F | Profund Advisors Llc | 57.972 | 142,56 | 206 | -2,83 | ||||
| 2026-02-10 | 13F | Weaver Consulting Group | 0 | -100,00 | 0 | -100,00 | ||||
| 2026-02-17 | 13F | Creative Planning | Call | 0 | -100,00 | 0 | -100,00 | |||
| 2025-10-14 | 13F | Berkshire Money Management, Inc. | 0 | -100,00 | 0 | -100,00 | ||||
| 2026-02-11 | 13F | Ameritas Investment Partners, Inc. | 6.984 | 25 | ||||||
| 2026-02-12 | 13F | Quadrant Capital Group Llc | 790 | -57,32 | 3 | -87,50 | ||||
| 2026-01-29 | 13F | UBS Group AG | 459.394 | -6,62 | 1.635 | -62,65 |