Grundlæggende statistik
| Institutionelle aktier (lange) | 42.477.916 - 91,34% (ex 13D/G) - change of -13,48MM shares -24,09% MRQ |
| Institutionel værdi (lang) | $ 436.950 USD ($1000) |
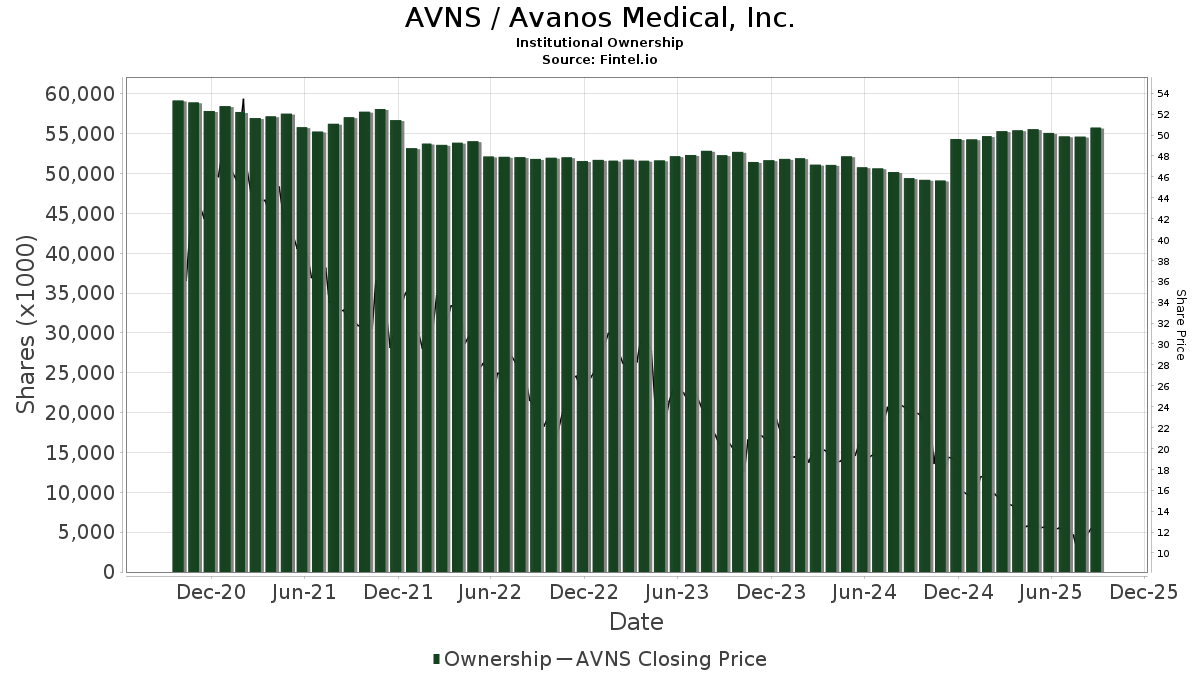
Institutionelt ejerskab og aktionærer
Avanos Medical, Inc. (US:AVNS) har 275 institutionelle ejere og aktionærer, der har indsendt 13D/G- eller 13F-formularer til Securities Exchange Commission (SEC). Disse institutioner har i alt 42,477,916 aktier. Største aktionærer omfatter BlackRock, Inc., Vanguard Group Inc, Armistice Capital, Llc, Dimensional Fund Advisors Lp, State Street Corp, Brown Advisory Inc, T. Rowe Price Investment Management, Inc., D. E. Shaw & Co., Inc., Morgan Stanley, and Geode Capital Management, Llc .
Avanos Medical, Inc. (NYSE:AVNS) institutionel ejerskabsstruktur viser aktuelle positioner i virksomheden efter institutioner og fonde, samt seneste ændringer i positionsstørrelse. Større aktionærer kan omfatte individuelle investorer, investeringsforeninger, hedgefonde eller institutioner. Skema 13D angiver, at investoren besidder (eller besidder) mere end 5 % af virksomheden og har til hensigt (eller har til hensigt at) aktivt at forfølge en ændring i forretningsstrategi. Skema 13G indikerer en passiv investering på over 5%.
The share price as of March 30, 2026 is 13,74 / share. Previously, on March 31, 2025, the share price was 14,33 / share. This represents a decline of 4,12% over that period.
Fondens stemningsscore
Fund Sentiment Score (fka Ownership Accumulation Score) finder de aktier, der bliver mest købt af fonde. Det er resultatet af en sofistikeret, multi-faktor kvantitativ model, der identificerer virksomheder med de højeste niveauer af institutionel akkumulering. Scoringsmodellen bruger en kombination af den samlede stigning i oplyste ejere, ændringerne i porteføljeallokeringer i disse ejere og andre målinger. Tallet går fra 0 til 100, hvor højere tal indikerer et højere niveau af akkumulering for sine jævnaldrende, og 50 er gennemsnittet.
Opdateringsfrekvens: Dagligt
Se Ownership Explorer, som giver en liste over højest rangerende virksomheder.
AI+ Ask Fintel’s AI assistant about Avanos Medical, Inc..
Select a question to share a public post with an AI-crafted answer.
Thinking of good questions…
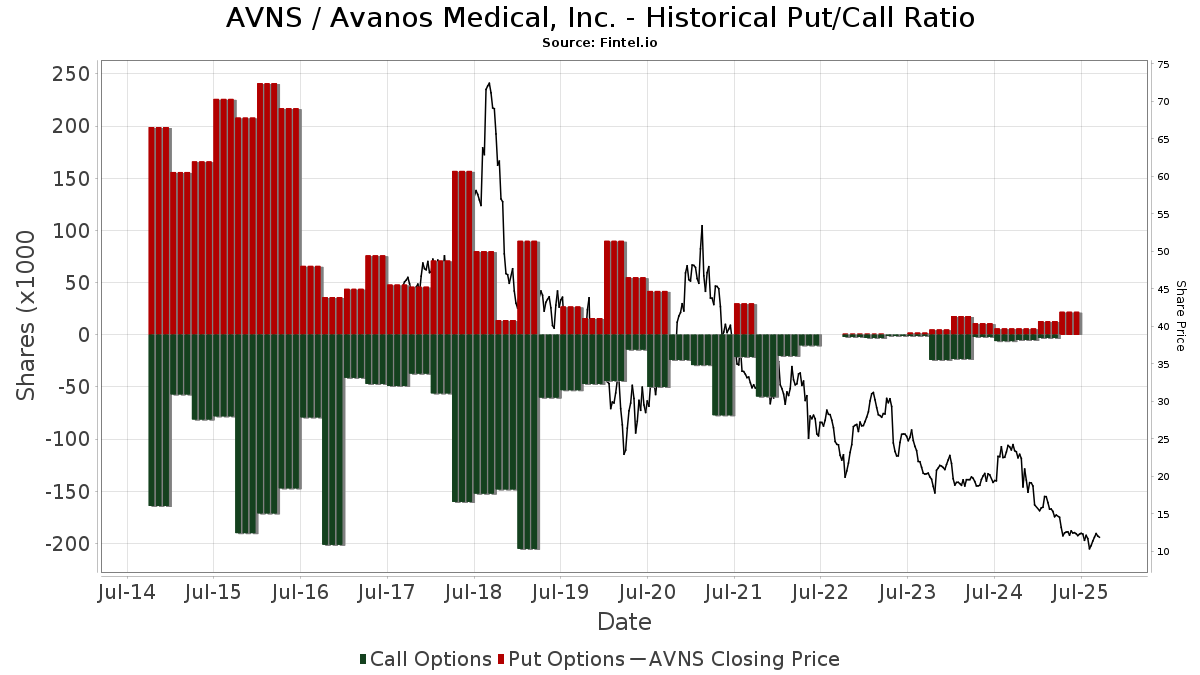
Institutionel Put/Call-forhold
Ud over at indberette standardaktie- og gældsudstedelser skal institutter med mere end 100 mill. aktiver under forvaltning også oplyse deres put- og call-optionsbeholdninger. Da salgsoptioner generelt indikerer negativ stemning, og købsoptioner indikerer positiv stemning, kan vi få en fornemmelse af den overordnede institutionelle stemning ved at plotte forholdet mellem put og kald. Diagrammet til højre viser det historiske put/call-forhold for dette instrument.
Brug af Put/Call Ratio som en indikator for investorernes stemning overvinder en af de vigtigste mangler ved at bruge totalt institutionelt ejerskab, som er, at en betydelig mængde af aktiver under forvaltning investeres passivt for at spore indekser. Passivt forvaltede fonde køber typisk ikke optioner, så indikatoren for put/call-forholdet følger mere nøje følelsen af aktivt forvaltede fonde.
13D/G-arkivering
Vi præsenterer 13D/G ansøgninger separat fra 13F ansøgninger på grund af den forskellige behandling af SEC. 13D/G-ansøgninger kan indgives af grupper af investorer (med én ledende), hvorimod 13F-ansøgninger ikke kan. Dette resulterer i situationer, hvor en investor kan indsende en 13D/G, der rapporterer én værdi for de samlede aktier (der repræsenterer alle de aktier, der ejes af investorgruppen), men derefter indsender en 13F, der rapporterer en anden værdi for de samlede aktier (der udelukkende repræsenterer deres egne) ejendomsret). Det betyder, at aktieejerskab af 13D/G-arkiver og 13F-arkiveringer ofte ikke er direkte sammenlignelige, så vi præsenterer dem separat.
Bemærk: Fra den 16. maj 2021 viser vi ikke længere ejere, der ikke har indsendt en 13D/G inden for det seneste år. Tidligere viste vi den fulde historie af 13D/G-arkiver. Generelt skal enheder, der er forpligtet til at indgive 13D/G-ansøgninger, indgive mindst årligt, før de indsender en afsluttende ansøgning. Dog forlader fonde nogle gange positioner uden at indsende en afsluttende ansøgning (dvs. de afvikler), så visning af den fulde historie resulterede nogle gange i forvirring om det nuværende ejerskab. For at undgå forvirring viser vi nu kun 'aktuelle' ejere - det vil sige - ejere, der har anmeldt inden for det seneste år.
Upgrade to unlock premium data.
| Fil dato | Form | Investor | Forrige Aktier |
Seneste Aktier |
Δ Aktier (Procent) |
Ejendomsret (Procent) |
Δ Ejerskab (Procent) |
|
|---|---|---|---|---|---|---|---|---|
| 2026-03-26 | VANGUARD GROUP INC | 3,425,214 | 0 | -100.00 | 0.00 | -100.00 | ||
| 2026-02-17 | ARMISTICE CAPITAL, LLC | 2,500,000 | 3,200,000 | 28.00 | 6.89 | 27.83 | ||
| 2026-02-13 | RGM Capital, LLC | 2,986,519 | 0 | -100.00 | 0.00 | -100.00 | ||
| 2026-01-21 | DIMENSIONAL FUND ADVISORS LP | 2,352,634 | 2,157,531 | -8.29 | 4.60 | -9.80 | ||
| 2025-10-07 | T. Rowe Price Investment Management, Inc. | 3,757,576 | 4,713,494 | 25.44 | 10.20 | 24.39 | ||
| 2025-04-30 | BlackRock, Inc. | 7,461,343 | 6,826,353 | -8.51 | 14.80 | -8.07 |
13F og NPORT arkivering
Detaljer om 13F-arkivering er gratis. Detaljer om NP-ansøgninger kræver et premium-medlemskab. Grønne rækker angiver nye positioner. Røde rækker angiver lukkede positioner. Klik på linket ikon for at se den fulde transaktionshistorik.
Opgrader
for at låse premium-data op og eksportere til Excel ![]() .
.
| Fil dato | Kilde | Investor | Type | Gennemsnitlig pris (Øst) |
Aktier | Δ Aktier (%) |
Rapporteret Værdi ($1000) |
Δ Værdi (%) |
Port Alloc (%) |
|
|---|---|---|---|---|---|---|---|---|---|---|
| 2025-11-13 | 13F | Sio Capital Management, LLC | 0 | -100,00 | 0 | -100,00 | ||||
| 2026-02-12 | 13F | Hrt Financial Lp | 162.473 | -12,99 | 2 | -50,00 | ||||
| 2026-02-13 | 13F | Public Employees Retirement Association Of Colorado | 5.846 | 0,00 | 0 | |||||
| 2026-02-18 | 13F | EP Wealth Advisors, Inc. | 17.857 | 27,68 | 201 | 16,96 | ||||
| 2026-02-13 | 13F | Barclays Plc | 69.938 | -27,29 | 785 | -66,03 | ||||
| 2026-02-13 | 13F | American Century Companies Inc | 114.768 | 0,27 | 1.289 | -2,65 | ||||
| 2026-02-13 | 13F | Public Sector Pension Investment Board | 0 | -100,00 | 0 | |||||
| 2026-01-26 | 13F | AE Wealth Management LLC | 14.861 | 15,72 | 167 | 12,16 | ||||
| 2026-01-29 | 13F | St Germain D J Co Inc | 162 | 5.300,00 | 2 | |||||
| 2025-11-14 | 13F | Strategic Wealth Partners, Ltd. | 1 | 0,00 | 0 | |||||
| 2026-02-17 | 13F | Quantessence Capital LLC | 0 | -100,00 | 0 | |||||
| 2026-01-30 | 13F | Caldwell Trust Co | 0 | -100,00 | 0 | |||||
| 2025-11-14 | 13F | Texas Permanent School Fund | 0 | -100,00 | 0 | |||||
| 2026-02-17 | 13F | Creative Planning | 64.884 | -29,50 | 729 | -31,51 | ||||
| 2025-11-12 | 13F | Neuberger Berman Group LLC | 0 | -100,00 | 0 | |||||
| 2026-02-06 | 13F | Addison Advisors LLC | 50 | 0,00 | 1 | |||||
| 2026-02-11 | 13F | Zions Bancorporation, National Association /ut/ | 149 | 2 | ||||||
| 2026-02-12 | 13F | Voya Investment Management Llc | 0 | -100,00 | 0 | |||||
| 2026-02-17 | 13F | Two Sigma Advisers, Lp | 115.300 | 250,46 | 1.295 | 240,53 | ||||
| 2026-02-17 | 13F | Jones Financial Companies Lllp | 376 | -7,62 | 4 | 0,00 | ||||
| 2026-01-14 | 13F | Eastern Bank | 14 | 0,00 | 0 | |||||
| 2026-01-22 | 13F | Financial Consulate, Inc | 36 | 0,00 | 0 | |||||
| 2026-02-13 | 13F | Virtus ETF Advisers LLC | 18.830 | 211 | ||||||
| 2026-02-13 | 13F | Citigroup Inc | 15.798 | -4,38 | 177 | -6,84 | ||||
| 2026-02-10 | 13F | MJT & Associates Financial Advisory Group, Inc. | 0 | -100,00 | 0 | |||||
| 2026-02-17 | 13F | Northern Trust Corp | 473.281 | -3,81 | 5.315 | -6,56 | ||||
| 2026-01-29 | 13F | Vanguard Group Inc | 3.526.785 | 2,97 | 39.606 | 0,03 | ||||
| 2026-02-13 | 13F | Quarry LP | 0 | -100,00 | 0 | |||||
| 2026-01-20 | 13F | AdvisorNet Financial, Inc | 25 | 0,00 | 0 | |||||
| 2026-01-26 | 13F | Whittier Trust Co | 24 | 0,00 | 0 | |||||
| 2026-02-06 | 13F | EverSource Wealth Advisors, LLC | 2.496 | 132,62 | 28 | 133,33 | ||||
| 2025-11-05 | 13F | Koesten, Hirschmann & Crabtree, INC. | 0 | -100,00 | 0 | |||||
| 2026-02-03 | 13F | Broadwater Capital Management Llc | 0 | -100,00 | 0 | |||||
| 2026-02-11 | 13F | Ameritas Investment Partners, Inc. | 3.744 | 42 | ||||||
| 2026-02-17 | 13F | Schonfeld Strategic Advisors LLC | 10.824 | 122 | ||||||
| 2026-02-05 | 13F | Amalgamated Bank | 13.689 | 0,56 | 0 | |||||
| 2026-02-06 | 13F | Global Retirement Partners, LLC | 101 | 1 | ||||||
| 2026-02-06 | 13F | Larson Financial Group LLC | 459 | 125,00 | 5 | 150,00 | ||||
| 2026-02-13 | 13F | SRS Capital Advisors, Inc. | 904 | -93,43 | 10 | -93,67 | ||||
| 2026-01-28 | 13F | Klp Kapitalforvaltning As | 10.200 | 0,00 | 115 | -2,56 | ||||
| 2026-02-11 | 13F | Group One Trading, L.p. | Call | 300 | -97,54 | 3 | -97,87 | |||
| 2025-11-14 | 13F | Axa S.a. | 0 | -100,00 | 0 | |||||
| 2026-02-12 | 13F | BlackRock, Inc. | 6.750.911 | -1,21 | 75.813 | -4,03 | ||||
| 2026-02-13 | 13F | Marshall Wace, Llp | 68.109 | 765 | ||||||
| 2026-02-06 | 13F | Covestor Ltd | 655 | 0,46 | 0 | |||||
| 2026-02-17 | 13F | Aquatic Capital Management LLC | 26.408 | 53,22 | 297 | 48,74 | ||||
| 2026-02-11 | 13F | LPL Financial LLC | 0 | -100,00 | 0 | |||||
| 2026-01-26 | 13F | Whittier Trust Co Of Nevada Inc | 24 | 0,00 | 0 | |||||
| 2026-02-13 | 13F | Manufacturers Life Insurance Company, The | 0 | -100,00 | 0 | |||||
| 2026-01-28 | 13F | City State Bank | 18 | 0,00 | 0 | |||||
| 2026-02-17 | 13F | Canada Pension Plan Investment Board | 33.900 | 381 | ||||||
| 2026-02-17 | 13F | Janus Henderson Group Plc | 20.707 | 0,00 | 232 | -2,93 | ||||
| 2026-01-14 | 13F | Pallas Capital Advisors LLC | 0 | -100,00 | 0 | |||||
| 2025-11-14 | 13F | Point72 Asia (Singapore) Pte. Ltd. | 0 | -100,00 | 0 | |||||
| 2026-02-04 | 13F | Versor Investments LP | 16.600 | 186 | ||||||
| 2026-02-11 | 13F | Hughes Financial Services, LLC | 48 | 0,00 | 1 | |||||
| 2026-02-10 | 13F | State of Wyoming | 23.556 | 53,65 | 265 | 49,15 | ||||
| 2026-02-18 | 13F | State of Tennessee, Treasury Department | 41.405 | 49,99 | 552 | 72,73 | ||||
| 2026-01-07 | 13F | Harbor Investment Advisory, Llc | 30 | 0,00 | 0 | |||||
| 2026-02-13 | 13F | Ieq Capital, Llc | 102.173 | -21,62 | 1.147 | -23,84 | ||||
| 2026-01-29 | 13F | Teachers Retirement System Of The State Of Kentucky | 11.762 | -10,43 | 0 | |||||
| 2026-01-12 | 13F | Kozak & Associates, Inc. | 4 | 0,00 | 0 | |||||
| 2026-02-09 | 13F | Harbour Investments, Inc. | 322 | -12,97 | 4 | -25,00 | ||||
| 2026-02-10 | 13F | Envestnet Asset Management Inc | 10.746 | -32,01 | 121 | -34,07 | ||||
| 2026-02-17 | 13F | Man Group plc | 222.418 | 200,17 | 2.498 | 191,71 | ||||
| 2026-02-13 | 13F | William B. Walkup & Associates, Inc. | 23 | 0,00 | 0 | |||||
| 2026-02-12 | 13F | Skopos Labs, Inc. | 0 | -100,00 | 0 | |||||
| 2026-01-29 | 13F | Comerica Bank | 11.507 | -14,67 | 129 | -16,77 | ||||
| 2025-11-12 | 13F | Simplex Trading, Llc | 0 | -100,00 | 0 | |||||
| 2026-02-10 | 13F | Goldman Sachs Group Inc | 451.389 | -0,42 | 5.069 | -3,24 | ||||
| 2026-01-28 | 13F | Teacher Retirement System Of Texas | 26.320 | -8,77 | 296 | -11,41 | ||||
| 2026-01-30 | 13F | North Star Investment Management Corp. | 77 | 0,00 | 1 | |||||
| 2026-02-12 | 13F | EntryPoint Capital, LLC | 0 | -100,00 | 0 | |||||
| 2026-02-10 | 13F | Axq Capital, Lp | 27.757 | -9,48 | 312 | -12,15 | ||||
| 2026-02-11 | 13F | Fox Run Management, L.l.c. | 51.578 | 51,66 | 579 | 47,33 | ||||
| 2026-02-17 | 13F | California State Teachers Retirement System | 42.351 | -0,08 | 476 | -2,86 | ||||
| 2025-11-14 | 13F | Raymond James Financial Inc | 0 | -100,00 | 0 | |||||
| 2026-01-13 | 13F | Mather Group, Llc. | 0 | -100,00 | 0 | |||||
| 2026-02-11 | 13F | Parallel Advisors, LLC | 63 | -83,55 | 1 | -100,00 | ||||
| 2026-02-09 | 13F | Huntington National Bank | 1 | 0,00 | 0 | |||||
| 2026-02-18 | 13F | GWM Advisors LLC | 0 | -100,00 | 0 | |||||
| 2026-02-13 | 13F | MAI Capital Management | 60 | 300,00 | 1 | |||||
| 2026-01-12 | 13F | AllSquare Wealth Management LLC | 9 | 0,00 | 0 | |||||
| 2026-01-16 | 13F | Louisiana State Employees Retirement System | 21.300 | 0,00 | 239 | -2,85 | ||||
| 2026-02-13 | 13F | Prudential Financial Inc | 88.214 | -65,23 | 991 | -66,23 | ||||
| 2025-11-14 | 13F | Wolverine Trading, Llc | Put | 0 | -100,00 | 0 | -100,00 | |||
| 2026-02-10 | 13F | Commonwealth Of Pennsylvania Public School Empls Retrmt Sys | 11.492 | -2,75 | 129 | -5,15 | ||||
| 2026-02-17 | 13F | Millennium Management Llc | 731.900 | -18,34 | 8.219 | -20,67 | ||||
| 2026-02-19 | 13F | Invesco Ltd. | 223.252 | -31,06 | 2.507 | -33,02 | ||||
| 2026-02-02 | 13F | CX Institutional | 531 | 0,00 | 0 | |||||
| 2026-02-10 | 13F | Quantbot Technologies LP | 31.108 | 37,85 | 349 | 34,23 | ||||
| 2026-02-11 | 13F | Los Angeles Capital Management Llc | 297 | 3 | ||||||
| 2026-02-17 | 13F | Boreal Capital Management LLC | 2 | 0,00 | 0 | |||||
| 2026-02-13 | 13F | Police & Firemen's Retirement System of New Jersey | 12.361 | 0,00 | 139 | -2,82 | ||||
| 2026-01-20 | 13F | Harbor Capital Advisors, Inc. | 27.567 | -1,80 | 0 | |||||
| 2026-02-13 | 13F | Sei Investments Co | 75.873 | 852 | ||||||
| 2026-02-17 | 13F | Gotham Asset Management, LLC | 0 | -100,00 | 0 | |||||
| 2026-01-08 | 13F | Wealth Enhancement Advisory Services, Llc | 19.367 | -34,20 | 227 | -31,63 | ||||
| 2026-01-29 | 13F | UBS Group AG | 415.107 | 7,87 | 4.662 | 4,79 | ||||
| 2025-11-12 | 13F | NewSquare Capital LLC | 0 | -100,00 | 0 | |||||
| 2026-02-17 | 13F | Moore Capital Management, Lp | 101.885 | 15,44 | 1.144 | 12,16 | ||||
| 2025-11-12 | 13F | Pitcairn Co | 0 | -100,00 | 0 | |||||
| 2026-02-05 | 13F | Williams & Novak, LLC | 34.312 | 1,86 | 385 | -1,03 | ||||
| 2026-02-02 | 13F | Core Alternative Capital | 0 | -100,00 | 0 | |||||
| 2026-02-11 | 13F | Barrow Hanley Mewhinney & Strauss Llc | 438 | -29,81 | 5 | -42,86 | ||||
| 2026-01-28 | 13F | Universal- Beteiligungs- und Servicegesellschaft mbH | 18.550 | 40,11 | 208 | 35,95 | ||||
| 2026-02-05 | 13F | Thrivent Financial For Lutherans | 212.215 | 38,01 | 2 | 100,00 | ||||
| 2026-02-10 | 13F | Easterly Investment Partners Llc | 75.131 | 16,17 | 844 | 12,85 | ||||
| 2026-02-17 | 13F | Armistice Capital, Llc | 3.200.000 | 28,00 | 35.936 | 24,35 | ||||
| 2026-02-17 | 13F | Two Sigma Investments, Lp | 165.278 | 1.856 | ||||||
| 2026-02-17 | 13F | Lazard Asset Management Llc | 251.688 | -1,91 | 2.826 | -4,72 | ||||
| 2026-03-16 | 13F/A | Rockefeller Capital Management L.P. | 40 | 53,85 | 0 | |||||
| 2025-10-29 | 13F | Maryland State Retirement & Pension System | 0 | -100,00 | 0 | -100,00 | ||||
| 2026-02-17 | 13F | Ameriprise Financial Inc | 582.585 | -1,45 | 6.542 | -4,27 | ||||
| 2026-02-02 | 13F | Sachetta, LLC | 1 | 0,00 | 0 | |||||
| 2025-11-07 | 13F | First National Bank Of Omaha | 0 | -100,00 | 0 | -100,00 | ||||
| 2026-01-27 | 13F/A | Tributary Capital Management, LLC | 0 | -100,00 | 0 | -100,00 | ||||
| 2025-10-16 | 13F | Rice Hall James & Associates, Llc | 0 | -100,00 | 0 | |||||
| 2026-02-13 | 13F | Aigen Investment Management, Lp | 0 | -100,00 | 0 | |||||
| 2026-02-13 | 13F | Rhumbline Advisers | 133.927 | -28,48 | 1.504 | -30,55 | ||||
| 2026-01-23 | 13F | State of Alaska, Department of Revenue | 25.704 | -0,40 | 0 | |||||
| 2026-02-12 | 13F | Mark Sheptoff Financial Planning, Llc | 700 | 8 | ||||||
| 2026-02-17 | 13F | Public Employees Retirement System Of Ohio | 1.975 | 9,97 | 22 | 10,00 | ||||
| 2026-02-09 | 13F | Cary Street Partners Financial Llc | 16.750 | -9,34 | 188 | -11,74 | ||||
| 2026-02-13 | 13F | Brown Advisory Inc | 1.935.802 | -13,07 | 21.739 | -15,55 | ||||
| 2026-02-17 | 13F | Bridgeway Capital Management Inc | 311.479 | 7,16 | 3.498 | 4,08 | ||||
| 2026-01-16 | 13F | Ronald Blue Trust, Inc. | 51 | -12,07 | 1 | |||||
| 2026-02-13 | 13F | Great West Life Assurance Co /can/ | 35.623 | -55,40 | 0 | |||||
| 2025-11-12 | 13F/A | Norges Bank | 174.235 | -30,15 | 4.187 | -15,74 | ||||
| 2026-02-12 | 13F | Federation des caisses Desjardins du Quebec | 58 | 0,00 | 1 | |||||
| 2025-11-12 | 13F | Headlands Technologies LLC | 0 | -100,00 | 0 | |||||
| 2026-02-20 | 13F | Sunbelt Securities, Inc. | 90 | 260,00 | 1 | |||||
| 2026-02-09 | 13F | Royce & Associates Lp | 60.703 | 88,40 | 682 | 83,06 | ||||
| 2026-02-17 | 13F | Alliancebernstein L.p. | 42.475 | -19,06 | 477 | -21,45 | ||||
| 2025-12-09 | 13F/A | Tudor Investment Corp Et Al | 71.893 | 509,57 | 831 | 477,08 | ||||
| 2025-11-14 | 13F | Wood Tarver Financial Group, LLC | 0 | -100,00 | 0 | |||||
| 2025-11-10 | 13F | Hillsdale Investment Management Inc. | 0 | -100,00 | 0 | -100,00 | ||||
| 2026-01-28 | 13F | Financial Perspectives, Inc | 0 | -100,00 | 0 | |||||
| 2026-02-17 | 13F | Engineers Gate Manager LP | 117.063 | 98,17 | 1.315 | 92,67 | ||||
| 2026-02-10 | 13F | Acadian Asset Management Llc | 952.975 | 123,10 | 11 | 150,00 | ||||
| 2026-02-13 | 13F | Walleye Capital LLC | 39.848 | 447 | ||||||
| 2026-01-08 | 13F | True Wealth Design, LLC | 236 | -67,27 | 3 | -75,00 | ||||
| 2026-02-13 | 13F | Charles Schwab Investment Management Inc | 1.040.666 | 20,45 | 11.687 | 17,01 | ||||
| 2026-02-12 | 13F | Swiss National Bank | 91.500 | 2,12 | 1.028 | -0,77 | ||||
| 2026-01-20 | 13F | American National Bank | 76 | 0,00 | 1 | |||||
| 2026-01-26 | 13F | Cwm, Llc | 32.754 | -27,86 | 0 | |||||
| 2026-02-03 | 13F | SummerHaven Investment Management, LLC | 69.452 | 0,00 | 780 | -2,87 | ||||
| 2026-02-17 | 13F | T. Rowe Price Investment Management, Inc. | 1.746.884 | -62,94 | 20 | -64,81 | ||||
| 2026-02-06 | 13F | Lsv Asset Management | 74.793 | 0,00 | 1 | |||||
| 2026-02-11 | 13F | Allianz Asset Management GmbH | 141.369 | 137,46 | 1.588 | 130,67 | ||||
| 2025-10-30 | 13F | Twin Peaks Wealth Advisors, LLC | 0 | -100,00 | 0 | |||||
| 2026-02-10 | 13F | Savant Capital, LLC | 0 | -100,00 | 0 | |||||
| 2025-10-17 | 13F | Fortitude Family Office, LLC | 0 | -100,00 | 0 | |||||
| 2026-01-26 | 13F | Private Trust Co Na | 0 | -100,00 | 0 | |||||
| 2026-02-06 | 13F | FourThought Financial Partners, LLC | 0 | -100,00 | 0 | |||||
| 2026-02-13 | 13F | Victory Capital Management Inc | 81.489 | 0,19 | 915 | -2,66 | ||||
| 2026-01-09 | 13F | SG Americas Securities, LLC | 78.892 | 31,52 | 1 | |||||
| 2025-10-29 | 13F | Caldwell Securities, Inc | 0 | -100,00 | 0 | |||||
| 2025-11-06 | 13F | Costello Asset Management, INC | 0 | -100,00 | 0 | |||||
| 2026-02-03 | 13F | Coston, McIsaac & Partners | 8 | -38,46 | 0 | |||||
| 2026-02-04 | 13F | Ameritas Advisory Services, LLC | 0 | -100,00 | 0 | |||||
| 2025-11-14 | 13F | Occudo Quantitative Strategies Lp | 0 | -100,00 | 0 | |||||
| 2026-02-04 | 13F | Oregon Public Employees Retirement Fund | 10.603 | 1,92 | 119 | -0,83 | ||||
| 2026-02-06 | 13F | Entrust Financial Llc | 25 | 0 | ||||||
| 2026-02-09 | 13F | Key FInancial Inc | 84 | -7,69 | 1 | -100,00 | ||||
| 2026-02-17 | 13F | Fmr Llc | 365.545 | 34,88 | 4.105 | 31,07 | ||||
| 2025-10-07 | 13F | Heritage Family Offices, LLP | 0 | -100,00 | 0 | -100,00 | ||||
| 2026-01-16 | 13F | Piscataqua Savings Bank | 40 | 0,00 | 0 | |||||
| 2026-02-17 | 13F | Magnetar Financial LLC | 43.687 | 28,18 | 491 | 24,37 | ||||
| 2026-01-15 | 13F | Nisa Investment Advisors, Llc | 681 | -19,22 | 8 | -22,22 | ||||
| 2026-02-12 | 13F | McMillan Office, Inc. | 850 | 10 | ||||||
| 2026-02-13 | 13F | Parkside Financial Bank & Trust | 170 | 112,50 | 2 | |||||
| 2026-02-12 | 13F | State Board Of Administration Of Florida Retirement System | 13.203 | 0,00 | 148 | -2,63 | ||||
| 2026-02-10 | 13F | Intech Investment Management Llc | 20.627 | -21,57 | 232 | -24,01 | ||||
| 2026-02-09 | 13F | Cary Street Partner Investment Advisory Llc | 260 | -15,03 | 3 | -33,33 | ||||
| 2026-02-10 | 13F | Natixis Advisors, L.p. | 0 | -100,00 | 0 | |||||
| 2026-02-10 | 13F/A | Northwestern Mutual Wealth Management Co | 947 | 1,50 | 11 | 0,00 | ||||
| 2026-02-17 | 13F | Boothbay Fund Management, Llc | 46.920 | 527 | ||||||
| 2025-11-14 | 13F | Evelyn Partners Investment Management Services Ltd | 0 | -100,00 | 0 | |||||
| 2026-02-13 | 13F | Panagora Asset Management Inc | 48.232 | -0,02 | 542 | -2,87 | ||||
| 2026-02-13 | 13F | Blackhill Capital Inc | 2.375 | -23,34 | 27 | -25,71 | ||||
| 2025-11-14 | 13F | Citadel Advisors Llc | Put | 0 | -100,00 | 0 | -100,00 | |||
| 2026-02-12 | 13F | Marex Group plc | 25.800 | 0,00 | 290 | -3,02 | ||||
| 2026-02-17 | 13F | Advisory Services Network, LLC | 0 | -100,00 | 0 | |||||
| 2026-02-18 | 13F | Vident Advisory, LLC | 52.049 | 585 | ||||||
| 2026-02-13 | 13F | Transamerica Financial Advisors, Inc. | 7 | 0 | ||||||
| 2026-02-17 | 13F | Mercer Global Advisors Inc /adv | 15.364 | -15,76 | 173 | -18,10 | ||||
| 2026-02-17 | 13F | Qube Research & Technologies Ltd | 702.915 | -3,42 | 7.894 | -6,18 | ||||
| 2025-11-14 | 13F | J. Goldman & Co LP | 0 | -100,00 | 0 | |||||
| 2026-01-28 | 13F | N.E.W. Advisory Services LLC | 97 | 0,00 | 1 | 0,00 | ||||
| 2025-10-09 | 13F | Bartlett & Co. Wealth Management Llc | 0 | -100,00 | 0 | |||||
| 2026-02-12 | 13F | Dimensional Fund Advisors Lp | 2.157.531 | -8,29 | 24.229 | -10,91 | ||||
| 2026-01-20 | 13F | Signaturefd, Llc | 487 | 208,23 | 5 | 400,00 | ||||
| 2026-02-13 | 13F | Diametric Capital, LP | 20.440 | 230 | ||||||
| 2026-02-17 | 13F | Quantinno Capital Management LP | 149.923 | 118,89 | 1.684 | 112,77 | ||||
| 2026-02-02 | 13F | Cornerstone Planning Group LLC | 170 | 0,00 | 2 | 100,00 | ||||
| 2026-02-17 | 13F | Numerai GP LLC | 45.257 | -61,93 | 508 | -63,03 | ||||
| 2025-11-14 | 13F | Polymer Capital Management (US) LLC | 0 | -100,00 | 0 | |||||
| 2025-11-06 | 13F | ProShare Advisors LLC | 0 | -100,00 | 0 | |||||
| 2026-02-12 | 13F | CIBC Private Wealth Group, LLC | 1.200 | 52,87 | 13 | 44,44 | ||||
| 2026-02-13 | 13F | National Bank Of Canada /fi/ | 18 | 0,00 | 0 | |||||
| 2026-02-13 | 13F | BNP Paribas Asset Management Holding S.A. | 1.175 | 35,52 | 0 | |||||
| 2025-11-14 | 13F | Glen Eagle Advisors, LLC | 0 | -100,00 | 0 | |||||
| 2026-02-09 | 13F | Hantz Financial Services, Inc. | 1.115 | 221,33 | 0 | |||||
| 2026-01-22 | 13F | Harwood Advisory Group, LLC | 25 | 0,00 | 0 | |||||
| 2026-02-13 | 13F | Squarepoint Ops LLC | 0 | -100,00 | 0 | |||||
| 2026-02-17 | 13F | Tower Research Capital LLC (TRC) | 1.194 | -77,28 | 13 | -78,33 | ||||
| 2026-02-17 | 13F | Trexquant Investment LP | 29.186 | -78,29 | 328 | -78,94 | ||||
| 2026-02-17 | 13F | Jump Financial, LLC | 42.309 | -74,75 | 475 | -75,46 | ||||
| 2026-01-21 | 13F | Capital Advisors, Ltd. LLC | 3 | 0 | ||||||
| 2026-01-23 | 13F | Farther Finance Advisors, LLC | 378 | 139,24 | 4 | 300,00 | ||||
| 2026-02-11 | 13F | Inceptionr Llc | 0 | -100,00 | 0 | |||||
| 2026-01-21 | 13F | Westfuller Advisors, LLC | 6 | 0,00 | 0 | |||||
| 2026-02-05 | 13F | Td Private Client Wealth Llc | 13 | 0 | ||||||
| 2026-02-13 | 13F | Caitong International Asset Management Co., Ltd | 0 | -100,00 | 0 | |||||
| 2026-01-26 | 13F | Ckw Financial Group | 12 | 0,00 | 0 | |||||
| 2026-02-04 | 13F | Virginia Retirement Systems Et Al | 58.804 | 19,03 | 660 | 15,59 | ||||
| 2025-11-12 | 13F | Transce3nd, LLC | 0 | -100,00 | 0 | |||||
| 2026-02-03 | 13F | SBI Securities Co., Ltd. | 96 | 0,00 | 1 | 0,00 | ||||
| 2026-02-06 | 13F | Pnc Financial Services Group, Inc. | 5.471 | -21,26 | 61 | -23,75 | ||||
| 2026-02-05 | 13F | Bessemer Group Inc | 197 | 0 | ||||||
| 2026-02-03 | 13F | Strengthening Families & Communities, LLC | 0 | -100,00 | 0 | |||||
| 2026-02-11 | 13F | Picton Mahoney Asset Management | 48 | 0,00 | 1 | |||||
| 2026-02-12 | 13F | Advisors Asset Management, Inc. | 151 | 2,03 | 2 | 0,00 | ||||
| 2026-02-06 | 13F | IFP Advisors, Inc | 597 | 1,70 | 7 | 0,00 | ||||
| 2026-02-12 | 13F | Nuveen, LLC | 95.792 | -6,18 | 1.076 | -8,90 | ||||
| 2026-03-12 | 13F/A | Peak6 Llc | Call | 21.200 | 238 | |||||
| 2026-02-12 | 13F | Wealthspire Advisors, LLC | 0 | -100,00 | 0 | |||||
| 2026-02-10 | 13F | Tidemark, LLC | 17 | 0,00 | 0 | |||||
| 2026-02-09 | 13F | Quest Partners LLC | 50.147 | -41,24 | 563 | -42,90 | ||||
| 2026-02-11 | 13F | Nemes Rush Group LLC | 51 | 0,00 | 1 | |||||
| 2026-02-12 | 13F | Renaissance Technologies Llc | 0 | -100,00 | 0 | |||||
| 2026-02-17 | 13F | Captrust Financial Advisors | 10.966 | -22,97 | 123 | -25,00 | ||||
| 2026-01-08 | 13F | Armstrong Advisory Group, Inc | 90 | 0,00 | 1 | 0,00 | ||||
| 2026-02-06 | 13F | Gsa Capital Partners Llp | 52.802 | 1 | ||||||
| 2026-03-05 | 13F | Bayban | 8 | 0 | ||||||
| 2026-02-13 | 13F | Smartleaf Asset Management LLC | 12 | 0 | ||||||
| 2026-02-17 | 13F | MIRAE ASSET GLOBAL ETFS HOLDINGS Ltd. | 20.805 | -0,80 | 234 | -3,72 | ||||
| 2026-01-23 | 13F | Avion Wealth | 30 | 0,00 | 0 | |||||
| 2026-02-09 | 13F | Keating Financial Advisory Services, Inc. | 17 | 0 | ||||||
| 2026-02-17 | 13F | Russell Investments Group, Ltd. | 111.702 | 25,64 | 1.254 | 22,10 | ||||
| 2026-02-13 | 13F | Morgan Stanley | 1.094.036 | 31,42 | 12.286 | 27,67 | ||||
| 2026-02-13 | 13F | Dynamic Technology Lab Private Ltd | 24.916 | 280 | ||||||
| 2026-02-17 | 13F | Bank Of America Corp /de/ | 85.211 | 13,11 | 957 | 9,89 | ||||
| 2026-02-12 | 13F | Brown Brothers Harriman & Co | 0 | -100,00 | 0 | |||||
| 2026-02-17 | 13F | Brevan Howard Capital Management LP | 0 | -100,00 | 0 | |||||
| 2025-11-14 | 13F | Jain Global LLC | 0 | -100,00 | 0 | |||||
| 2026-02-11 | 13F | Empowered Funds, LLC | 214.362 | 10,75 | 2.407 | 7,60 | ||||
| 2026-02-17 | 13F | Price T Rowe Associates Inc /md/ | 62.531 | 23,66 | 1 | |||||
| 2026-02-11 | 13F | Jessup Wealth Management, Inc | 27 | 0 | ||||||
| 2026-02-17 | 13F | Deerfield Management Company, L.p. (series C) | 167.061 | 35,93 | 1.876 | 32,11 | ||||
| 2026-02-12 | 13F | New York State Common Retirement Fund | 6.490 | 0,00 | 73 | -4,00 | ||||
| 2026-02-17 | 13F | Algert Global Llc | 84.031 | 17,28 | 1 | |||||
| 2025-11-13 | 13F | Arrowstreet Capital, Limited Partnership | 0 | -100,00 | 0 | -100,00 | ||||
| 2026-02-12 | 13F | Steward Partners Investment Advisory, Llc | 12 | 0,00 | 0 | |||||
| 2026-01-05 | 13F | GAMMA Investing LLC | 1.418 | 15,38 | 16 | 7,14 | ||||
| 2026-01-29 | 13F | Inscription Capital, LLC | 36.990 | 215,96 | 415 | 207,41 | ||||
| 2026-02-05 | 13F | Allworth Financial LP | 666 | -49,16 | 7 | -53,33 | ||||
| 2025-11-14 | 13F | Point72 (DIFC) Ltd | 0 | -100,00 | 0 | -100,00 | ||||
| 2026-02-12 | 13F | Counterpoint Mutual Funds LLC | 48.083 | 62,44 | 540 | 57,60 | ||||
| 2025-10-27 | 13F | Janney Montgomery Scott LLC | 0 | -100,00 | 0 | |||||
| 2026-01-30 | 13F | Us Bancorp \de\ | 2.297 | -50,22 | 26 | -52,83 | ||||
| 2026-01-21 | 13F | Azzad Asset Management Inc /adv | 0 | -100,00 | 0 | |||||
| 2026-02-03 | 13F | Farmers & Merchants Investments Inc | 36 | 0,00 | 0 | |||||
| 2026-02-17 | 13F | Susquehanna International Group, Llp | 16.736 | -49,97 | 188 | -51,55 | ||||
| 2026-02-17 | 13F | Royal Bank Of Canada | 42.880 | -77,43 | 481 | -78,10 | ||||
| 2026-01-08 | 13F | Versant Capital Management, Inc | 4.859 | 80,50 | 55 | 74,19 | ||||
| 2026-02-02 | 13F | Principal Financial Group Inc | 292.832 | 7,95 | 3.289 | 4,88 | ||||
| 2025-12-18 | 13F | Danske Bank A/s | 0 | -100,00 | 0 | |||||
| 2026-02-13 | 13F | Sterling Capital Management LLC | 33.233 | 974,81 | 373 | 965,71 | ||||
| 2026-01-28 | 13F | Arizona State Retirement System | 12.950 | -5,36 | 145 | -8,23 | ||||
| 2026-02-13 | 13F | Martingale Asset Management L P | 157.970 | 15,46 | 1.774 | 12,21 | ||||
| 2026-01-30 | 13F | Archer Investment Corp | 0 | -100,00 | 0 | |||||
| 2025-11-12 | 13F | Group One Trading, L.p. | Put | 0 | -100,00 | 0 | -100,00 | |||
| 2026-02-13 | 13F | Umb Bank N A/mo | 401 | -48,72 | 5 | -55,56 | ||||
| 2026-02-17 | 13F | Petrus Trust Company, LTA | 0 | -100,00 | 0 | -100,00 | ||||
| 2026-02-06 | 13F | Creative Financial Designs Inc /adv | 4 | 0,00 | 0 | |||||
| 2026-02-26 | 13F/A | Alpine Global Management, LLC | 15.773 | 177 | ||||||
| 2026-02-02 | 13F | New England Capital Financial Advisors LLC | 6 | 0,00 | 0 | |||||
| 2026-02-13 | 13F | Ubs Asset Management Americas Inc | 203.257 | -5,61 | 2.283 | -8,32 | ||||
| 2026-02-17 | 13F | Aqr Capital Management Llc | 727.696 | -20,40 | 8.172 | -22,66 | ||||
| 2026-02-02 | 13F | Fifth Third Bancorp | 222 | -0,89 | 2 | 0,00 | ||||
| 2026-02-09 | 13F | Smithfield Trust Co | 608 | 0,00 | 0 | |||||
| 2026-02-09 | 13F | Hartland & Co., LLC | 10 | -99,21 | 0 | -100,00 | ||||
| 2026-02-12 | 13F | Colonial Trust Co / SC | 12 | 0,00 | 0 | |||||
| 2026-02-13 | 13F | Mariner, LLC | 18.958 | -6,09 | 213 | -8,58 | ||||
| 2026-02-12 | 13F | BRYN MAWR TRUST Co | 0 | -100,00 | 0 | -100,00 | ||||
| 2026-02-13 | 13F | Wells Fargo & Company/mn | 53.971 | 42,34 | 606 | 38,36 | ||||
| 2025-10-22 | 13F | Red Tortoise LLC | 0 | -100,00 | 0 | |||||
| 2025-11-13 | 13F | Cove Street Capital, LLC | 112.081 | 430,74 | 1.296 | 401,94 | ||||
| 2026-02-11 | 13F | Jpmorgan Chase & Co | 273.718 | -52,63 | 3.074 | -54,00 | ||||
| 2026-02-13 | 13F | Verition Fund Management LLC | 17.600 | -69,52 | 198 | -70,46 | ||||
| 2026-02-17 | 13F | Punch & Associates Investment Management, Inc. | 270.000 | 3.032 | ||||||
| 2026-02-12 | 13F | Federated Hermes, Inc. | 25.774 | 2,75 | 289 | 0,00 | ||||
| 2026-01-27 | 13F | TD Waterhouse Canada Inc. | 12 | 0,00 | 0 | |||||
| 2026-01-28 | 13F | Salomon & Ludwin, LLC | 727 | -1,22 | 8 | 0,00 | ||||
| 2026-02-10 | 13F | Bank of New York Mellon Corp | 306.077 | -2,30 | 3.437 | -5,08 | ||||
| 2025-11-14 | 13F | Sherbrooke Park Advisers Llc | 0 | -100,00 | 0 | -100,00 | ||||
| 2026-02-17 | 13F | Quadrature Capital Ltd | 14.296 | 161 | ||||||
| 2026-02-13 | 13F | 1 North Wealth Services Llc | 14 | 0,00 | 0 | |||||
| 2026-02-04 | 13F | Boyd Watterson Asset Management Llc/oh | 8 | 0,00 | 0 | |||||
| 2026-02-13 | 13F | Wexford Capital Lp | 0 | -100,00 | 0 | |||||
| 2026-01-16 | 13F | Bangor Savings Bank | 31 | 0,00 | 0 | |||||
| 2026-02-11 | 13F | Illinois Municipal Retirement Fund | 25.590 | 5,67 | 287 | 2,87 | ||||
| 2026-02-12 | 13F | MetLife Investment Management, LLC | 26.010 | -4,31 | 292 | -7,01 | ||||
| 2026-01-21 | 13F | Newbridge Financial Services Group, Inc. | 12 | 0,00 | 0 | |||||
| 2026-02-02 | 13F | Strs Ohio | 34.500 | 0,00 | 387 | -2,76 | ||||
| 2026-02-17 | 13F | Optiver Holding B.V. | 162 | 0,00 | 2 | 0,00 | ||||
| 2026-01-13 | 13F | CoreCap Advisors, LLC | 20 | 0,00 | 0 | |||||
| 2026-02-06 | 13F | Bare Financial Services, Inc | 43 | 4,88 | 0 | |||||
| 2026-01-27 | 13F | Zurcher Kantonalbank (Zurich Cantonalbank) | 17.594 | 198 | ||||||
| 2026-01-07 | 13F | Massmutual Trust Co Fsb/adv | 505 | -22,78 | 6 | -28,57 | ||||
| 2026-02-10 | 13F | Rothschild Investment Llc | 156 | -35,27 | 2 | -50,00 | ||||
| 2026-02-13 | 13F | Monograph Wealth Advisors, Llc | 29.289 | 0,00 | 329 | -2,96 | ||||
| 2025-11-14 | 13F | State Of Wisconsin Investment Board | 0 | -100,00 | 0 | |||||
| 2025-11-14 | 13F | ExodusPoint Capital Management, LP | 364.193 | -70,82 | 4.210 | 27.966,67 | ||||
| 2026-02-13 | 13F | Pinnacle Wealth Planning Services, Inc. | 953 | 11 | ||||||
| 2026-02-11 | 13F | Deutsche Bank Ag\ | 267.734 | 0,23 | 3.007 | -2,62 | ||||
| 2026-02-17 | 13F | Advisor Group Holdings, Inc. | 4.855 | -16,51 | 55 | -21,74 | ||||
| 2026-02-11 | 13F | Franklin Resources Inc | 75.816 | 102,15 | 851 | 96,54 | ||||
| 2026-02-17 | 13F | Prelude Capital Management, Llc | 33.767 | 62,83 | 379 | 58,58 | ||||
| 2026-02-02 | 13F | Eq Wealth Advisors, Llc | 100 | 1 | ||||||
| 2026-01-08 | 13F | Tompkins Financial Corp | 2 | -97,50 | 0 | -100,00 | ||||
| 2026-02-23 | 13F | Virtu Financial LLC | 0 | -100,00 | 0 | |||||
| 2026-01-05 | 13F | Holos Integrated Wealth LLC | 97 | 0,00 | 1 | 0,00 | ||||
| 2026-02-09 | 13F | North Star Asset Management Inc | 20.553 | 0,00 | 231 | -2,95 | ||||
| 2026-02-09 | 13F | Legal & General Group Plc | 122.357 | -2,00 | 1.374 | -4,78 | ||||
| 2026-01-14 | 13F | Spire Wealth Management | 0 | -100,00 | 0 | |||||
| 2026-02-10 | 13F | IAG Wealth Partners, LLC | 2 | 0,00 | 0 | |||||
| 2025-10-07 | 13F | Thurston, Springer, Miller, Herd & Titak, Inc. | 0 | -100,00 | 0 | |||||
| 2025-11-14 | 13F | Cubist Systematic Strategies, LLC | 0 | -100,00 | 0 | -100,00 | ||||
| 2026-02-12 | 13F | Jane Street Group, Llc | 19.297 | -80,32 | 217 | -80,94 | ||||
| 2026-02-17 | 13F | Citadel Advisors Llc | 478.620 | -16,63 | 5.375 | -19,02 | ||||
| 2026-01-29 | 13F | UMA Financial Services, Inc. | 87 | 0,00 | 1 | -100,00 | ||||
| 2026-02-12 | 13F | Clark Estates Inc/ny | 888.880 | 13,39 | 9.982 | 10,16 | ||||
| 2026-02-19 | 13F | CI Private Wealth, LLC | 20.953 | 234 | ||||||
| 2026-02-10 | 13F | Bnp Paribas Arbitrage, Sa | 184.699 | -7,56 | 2.074 | -10,18 | ||||
| 2026-02-13 | 13F | Y-Intercept (Hong Kong) Ltd | 40.675 | 18,19 | 457 | 14,86 | ||||
| 2026-02-13 | 13F | Wilkerson Advisory Group LLC | 9 | 0 | ||||||
| 2026-01-21 | 13F | Yousif Capital Management, Llc | 12.759 | -12,97 | 158 | -7,10 | ||||
| 2026-02-12 | 13F | Ensign Peak Advisors, Inc | 8.289 | -65,30 | 93 | -66,30 | ||||
| 2026-02-18 | 13F | Mackenzie Financial Corp | 0 | -100,00 | 0 | |||||
| 2025-11-10 | 13F/A | Flaharty Asset Management, LLC | 0 | -100,00 | 0 | |||||
| 2026-02-09 | 13F | MTM Investment Management, LLC | 53 | 0,00 | 1 | |||||
| 2026-02-03 | 13F | Kestrel Investment Management Corp | 141.050 | -3,42 | 2 | 0,00 | ||||
| 2026-02-17 | 13F | D. E. Shaw & Co., Inc. | 1.210.456 | -6,82 | 13.593 | -9,48 | ||||
| 2026-02-06 | 13F | Diamond Hill Capital Management Inc | 509.702 | 17,26 | 5.724 | 13,91 | ||||
| 2026-02-12 | 13F | Quadrant Capital Group Llc | 265 | 40,96 | 3 | 0,00 | ||||
| 2026-02-12 | 13F | Hm Payson & Co | 1.250 | 0,00 | 14 | 0,00 | ||||
| 2026-02-09 | 13F | Geode Capital Management, Llc | 1.084.504 | 1,59 | 12.180 | -1,31 | ||||
| 2026-02-12 | 13F | Principal Securities, Inc. | 0 | -100,00 | 0 | |||||
| 2025-10-20 | 13F | Paradice Investment Management LLC | 0 | -100,00 | 0 | -100,00 | ||||
| 2026-02-12 | 13F | Ankerstar Wealth, LLC | 4 | 0 | ||||||
| 2026-02-13 | 13F | State Street Corp | 1.954.785 | 2,82 | 21.952 | -0,12 | ||||
| 2026-02-23 | 13F | Mv Capital Management, Inc. | 40 | 0,00 | 0 | |||||
| 2026-02-03 | 13F | Winch Advisory Services, LLC | 67 | 0,00 | 1 | |||||
| 2026-02-11 | 13F | Simplex Trading, Llc | Call | 1.400 | -94,76 | 16 | ||||
| 2026-01-30 | 13F | New York State Teachers Retirement System | 61.233 | -2,00 | 1 | |||||
| 2026-02-04 | 13F | Pacer Advisors, Inc. | 0 | -100,00 | 0 | |||||
| 2026-02-11 | 13F | Cerity Partners LLC | 19.664 | -50,79 | 221 | -52,28 | ||||
| 2025-11-14 | 13F | AXA Investment Managers S.A. | 11.886 | 137 |
Other Listings
| DE:8HH | 11,10 € |