Grundlæggende statistik
| Institutionelle ejere | 132 total, 132 long only, 0 short only, 0 long/short - change of 4,76% MRQ |
| Gennemsnitlig porteføljeallokering | 1.0759 % - change of -5,56% MRQ |
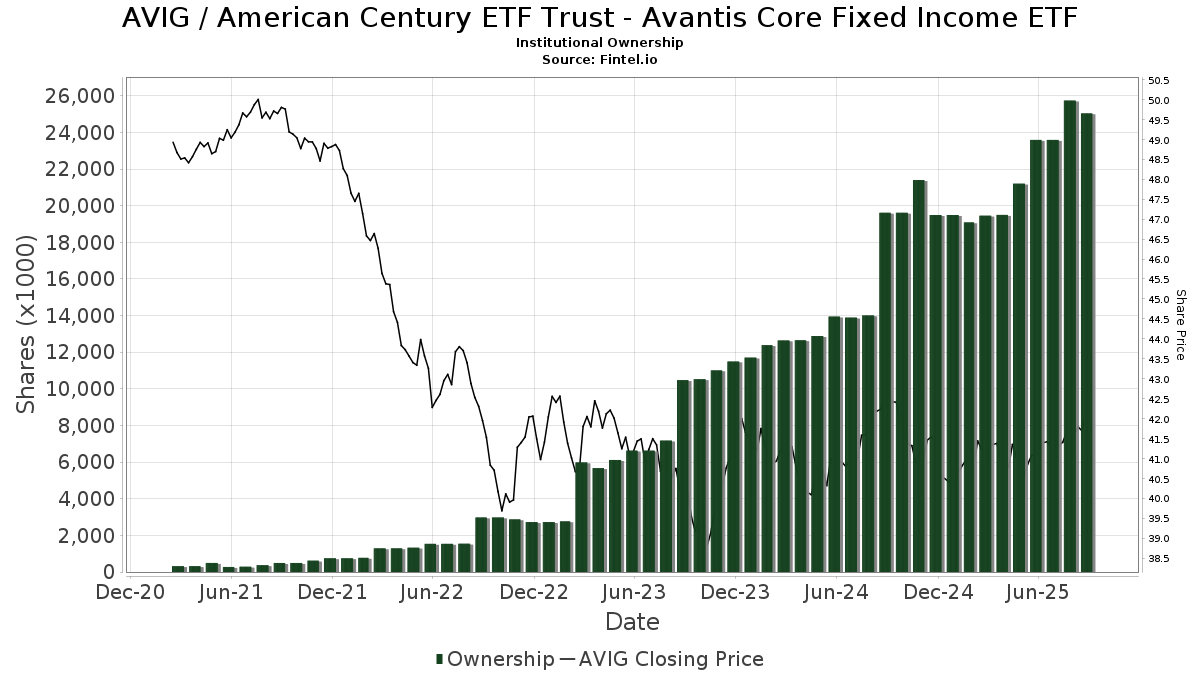
| Institutionelle aktier (lange) | 25.037.539 (ex 13D/G) - change of 1,45MM shares 6,14% MRQ |
| Institutionel værdi (lang) | $ 977.185 USD ($1000) |
Institutionelt ejerskab og aktionærer
American Century ETF Trust - Avantis Core Fixed Income ETF (US:AVIG) har 132 institutionelle ejere og aktionærer, der har indsendt 13D/G- eller 13F-formularer til Securities Exchange Commission (SEC). Disse institutioner har i alt 25,037,539 aktier. Største aktionærer omfatter AE Wealth Management LLC, Simplicity Wealth,LLC, Verus Financial Partners, Inc., Hill Investment Group Partners, LLC, Pacific Life Fund Advisors LLC, PACIFIC SELECT FUND - PSF DFA Balanced Allocation Portfolio Class D, Envestnet Asset Management Inc, LPL Financial LLC, SRS Capital Advisors, Inc., and BCR Wealth Strategies, LLC .
American Century ETF Trust - Avantis Core Fixed Income ETF (ARCA:AVIG) institutionel ejerskabsstruktur viser aktuelle positioner i virksomheden efter institutioner og fonde, samt seneste ændringer i positionsstørrelse. Større aktionærer kan omfatte individuelle investorer, investeringsforeninger, hedgefonde eller institutioner. Skema 13D angiver, at investoren besidder (eller besidder) mere end 5 % af virksomheden og har til hensigt (eller har til hensigt at) aktivt at forfølge en ændring i forretningsstrategi. Skema 13G indikerer en passiv investering på over 5%.
The share price as of September 17, 2025 is 42,25 / share. Previously, on September 18, 2024, the share price was 42,58 / share. This represents a decline of 0,78% over that period.
Fondens stemningsscore
Fund Sentiment Score (fka Ownership Accumulation Score) finder de aktier, der bliver mest købt af fonde. Det er resultatet af en sofistikeret, multi-faktor kvantitativ model, der identificerer virksomheder med de højeste niveauer af institutionel akkumulering. Scoringsmodellen bruger en kombination af den samlede stigning i oplyste ejere, ændringerne i porteføljeallokeringer i disse ejere og andre målinger. Tallet går fra 0 til 100, hvor højere tal indikerer et højere niveau af akkumulering for sine jævnaldrende, og 50 er gennemsnittet.
Opdateringsfrekvens: Dagligt
Se Ownership Explorer, som giver en liste over højest rangerende virksomheder.
Institutionel Put/Call-forhold
Ud over at indberette standardaktie- og gældsudstedelser skal institutter med mere end 100 mill. aktiver under forvaltning også oplyse deres put- og call-optionsbeholdninger. Da salgsoptioner generelt indikerer negativ stemning, og købsoptioner indikerer positiv stemning, kan vi få en fornemmelse af den overordnede institutionelle stemning ved at plotte forholdet mellem put og kald. Diagrammet til højre viser det historiske put/call-forhold for dette instrument.
Brug af Put/Call Ratio som en indikator for investorernes stemning overvinder en af de vigtigste mangler ved at bruge totalt institutionelt ejerskab, som er, at en betydelig mængde af aktiver under forvaltning investeres passivt for at spore indekser. Passivt forvaltede fonde køber typisk ikke optioner, så indikatoren for put/call-forholdet følger mere nøje følelsen af aktivt forvaltede fonde.
13F og NPORT arkivering
Detaljer om 13F-arkivering er gratis. Detaljer om NP-ansøgninger kræver et premium-medlemskab. Grønne rækker angiver nye positioner. Røde rækker angiver lukkede positioner. Klik på linket ikon for at se den fulde transaktionshistorik.
Opgrader
for at låse premium-data op og eksportere til Excel ![]() .
.
| Fil dato | Kilde | Investor | Type | Gennemsnitlig pris (Øst) |
Aktier | Δ Aktier (%) |
Rapporteret Værdi ($1000) |
Δ Værdi (%) |
Port Alloc (%) |
|
|---|---|---|---|---|---|---|---|---|---|---|
| 2025-07-17 | 13F | Mattern Wealth Management LLC | 117.364 | -2,11 | 4.885 | -1,57 | ||||
| 2025-07-25 | 13F | BCR Wealth Strategies, LLC | 622.639 | 4,67 | 26 | 4,17 | ||||
| 2025-07-24 | 13F | PDS Planning, Inc | 0 | -100,00 | 0 | |||||
| 2025-07-25 | 13F | Index Fund Advisors, Inc. | 58.252 | 0,28 | 2.424 | 0,83 | ||||
| 2025-07-23 | 13F | Quarry Hill Advisors, Llc | 17.379 | 5,03 | 723 | 5,70 | ||||
| 2025-07-28 | 13F | Morris Financial Concepts, Inc. | 5.259 | 0,10 | 219 | 0,46 | ||||
| 2025-08-13 | 13F | WCG Wealth Advisors LLC | 34.000 | 10,41 | 1.415 | 11,07 | ||||
| 2025-05-02 | 13F | Capital A Wealth Management, LLC | 34 | 0,00 | 1 | 0,00 | ||||
| 2025-08-05 | 13F | Allodium Investment Consultants, LLC | 204.927 | 17,98 | 8.529 | 18,64 | ||||
| 2025-05-08 | 13F | Plante Moran Financial Advisors, LLC | 0 | -100,00 | 0 | |||||
| 2025-08-14 | 13F | Comerica Bank | 2.335 | 0,00 | 97 | 1,04 | ||||
| 2025-07-15 | 13F | FLP Wealth Management, LLC | 0 | -100,00 | 0 | |||||
| 2025-07-25 | 13F | Lion Street Advisors, LLC | 38.552 | 11,71 | 1.605 | 12,32 | ||||
| 2025-08-12 | 13F | Global Retirement Partners, LLC | 558 | 1,82 | 23 | 4,55 | ||||
| 2025-08-14 | 13F | Citadel Advisors Llc | 51.935 | 66,73 | 2.162 | 67,65 | ||||
| 2025-07-23 | 13F | Morey & Quinn Wealth Partners, LLC | 11.399 | 114,07 | 474 | 115,45 | ||||
| 2025-08-11 | 13F | Mach-1 Financial Group, Inc. | 0 | -100,00 | 0 | |||||
| 2025-08-14 | 13F | Hrt Financial Lp | 15.375 | 1 | ||||||
| 2025-07-28 | 13F | WealthPlan Investment Management, LLC | 32.201 | 1.340 | ||||||
| 2025-08-15 | 13F | Kestra Advisory Services, LLC | 8.290 | -6,36 | 345 | -5,74 | ||||
| 2025-08-14 | 13F | Aqr Capital Management Llc | 30.100 | 0,00 | 1.253 | 0,56 | ||||
| 2025-07-11 | 13F | SILVER OAK SECURITIES, Inc | 64.826 | 1,76 | 2.698 | 2,55 | ||||
| 2025-07-24 | 13F | Us Bancorp \de\ | 1.954 | 0,00 | 81 | 1,25 | ||||
| 2025-08-12 | 13F | SRS Capital Advisors, Inc. | 687.001 | 6,45 | 28.593 | 7,04 | ||||
| 2025-08-13 | 13F | Jones Financial Companies Lllp | 6.376 | 30,90 | 264 | 31,34 | ||||
| 2025-08-08 | 13F | Creative Planning | 460.006 | 2,60 | 19.145 | 3,17 | ||||
| 2025-08-13 | 13F | Balance Wealth, LLC | 14.960 | -1,40 | 623 | -0,96 | ||||
| 2025-08-12 | 13F | Jpmorgan Chase & Co | 1.352 | 56 | ||||||
| 2025-08-14 | 13F | Susquehanna International Group, Llp | 72.606 | 21,27 | 3.022 | 21,91 | ||||
| 2025-07-15 | 13F | Bannerman Wealth Management Group, Llc | 55.463 | 925,95 | 2.308 | 934,98 | ||||
| 2025-08-08 | 13F | Tortoise Investment Management, LLC | 50 | 0,00 | 2 | 0,00 | ||||
| 2025-08-08 | 13F | Kingsview Wealth Management, LLC | 5.218 | 217 | ||||||
| 2025-07-15 | 13F | Regatta Capital Group, Llc | 503.211 | 1,98 | 20.944 | 2,55 | ||||
| 2025-08-14 | 13F | Diversify Wealth Management, Llc | 14.211 | 10,09 | 591 | 10,67 | ||||
| 2025-05-01 | 13F | Quest 10 Wealth Builders, Inc. | 688 | 2,84 | 28 | 3,70 | ||||
| 2025-08-05 | 13F | Strategic Financial Concepts, LLC | 224.932 | 10,67 | 9.362 | 11,28 | ||||
| 2025-07-08 | 13F | Apella Capital, LLC | 26.433 | -35,17 | 1.089 | -34,63 | ||||
| 2025-08-06 | 13F | Spurstone Advisory Services, LLC | 15 | 0,00 | 1 | |||||
| 2025-08-13 | 13F | Baird Financial Group, Inc. | 8.023 | 0,00 | 334 | 0,30 | ||||
| 2025-07-28 | NP | AVMA - Avantis Moderate Allocation ETF | 147.284 | -6,39 | 6.053 | -7,40 | ||||
| 2025-07-17 | 13F | KWB Wealth | 5.492 | -10,10 | 227 | -8,10 | ||||
| 2025-07-16 | 13F | Plancorp, LLC | 142.407 | 0,62 | 5.927 | 1,16 | ||||
| 2025-08-01 | 13F | Rossby Financial, LCC | 302 | 0,00 | 13 | 0,00 | ||||
| 2025-08-18 | 13F/A | Kestra Investment Management, LLC | 100.230 | 112,07 | 4.172 | 113,24 | ||||
| 2025-08-08 | 13F | Pacific Life Fund Advisors LLC | 1.129.233 | 13,28 | 46.999 | 13,91 | ||||
| 2025-08-07 | 13F | Summit X, LLC | 40.885 | -0,71 | 1.702 | -0,18 | ||||
| 2025-08-08 | 13F | Larson Financial Group LLC | 49 | 2,08 | 2 | 0,00 | ||||
| 2025-08-14 | 13F | UBS Group AG | 299 | -33,85 | 12 | -33,33 | ||||
| 2025-07-23 | 13F | L.K. Benson & Company, P.C. | 30.537 | -20,94 | 1.271 | -20,53 | ||||
| 2025-08-12 | 13F | Change Path, LLC | 12.466 | -68,94 | 519 | -68,81 | ||||
| 2025-07-31 | 13F | Buckingham Strategic Partners | 447.245 | 5.333,01 | 18.614 | 5.374,71 | ||||
| 2025-08-08 | 13F | Good Life Advisors, LLC | 78.419 | -1,35 | 3.264 | -0,82 | ||||
| 2025-07-10 | 13F | Wealth Enhancement Advisory Services, Llc | 5.673 | 235 | ||||||
| 2025-08-12 | 13F | BWM Planning, LLC | 0 | -100,00 | 0 | |||||
| 2025-08-14 | 13F | Wiley Bros.-aintree Capital, Llc | 97.976 | 4.078 | ||||||
| 2025-08-14 | 13F | Jane Street Group, Llc | 131.114 | 1.712,47 | 5.457 | 1.724,75 | ||||
| 2025-08-14 | 13F | Visionary Wealth Advisors | 7.967 | -82,96 | 332 | -82,89 | ||||
| 2025-07-15 | 13F | Signet Financial Management, Llc | 0 | -100,00 | 0 | -100,00 | ||||
| 2025-07-16 | 13F | Leading Edge Financial Planning LLC | 15.466 | 41,06 | 644 | 41,94 | ||||
| 2025-08-14 | 13F | Beaird Harris Wealth Management, LLC | 11.870 | -1,25 | 494 | -0,60 | ||||
| 2025-04-28 | 13F | Great Point Wealth Advisors, LLC | 9.266 | 0,00 | 384 | 2,13 | ||||
| 2025-07-31 | 13F | Curio Wealth, Llc | 1.349 | 67.350,00 | 56 | 0,00 | ||||
| 2025-08-12 | 13F | Park Square Financial Group, LLC | 14.798 | 562,40 | 616 | 568,48 | ||||
| 2025-07-09 | 13F | Tounjian Advisory Partners, Llc | 57.622 | -0,47 | 2.385 | -0,46 | ||||
| 2025-08-07 | 13F | Allworth Financial LP | 6.901 | -6,67 | 287 | -5,28 | ||||
| 2025-07-15 | 13F | Traction Financial Partners, LLC | 6.265 | 261 | ||||||
| 2025-07-21 | 13F | Mattern Capital Management, Llc | 141.794 | 17,93 | 5.901 | 18,59 | ||||
| 2025-08-06 | 13F | AE Wealth Management LLC | 4.188.949 | 11,90 | 174.344 | 12,52 | ||||
| 2025-08-14 | 13F | Cardiff Park Advisors, Llc | 4.595 | 0,00 | 191 | 0,53 | ||||
| 2025-05-05 | 13F | Nwam Llc | 0 | -100,00 | 0 | |||||
| 2025-05-15 | 13F | Two Sigma Securities, Llc | 0 | -100,00 | 0 | |||||
| 2025-08-14 | 13F | Herold Advisors, Inc. | 137.227 | -14,60 | 5.711 | -14,13 | ||||
| 2025-07-10 | 13F | Pacific Asset Management, LLC | 34.305 | 4,73 | 1.428 | 5,31 | ||||
| 2025-08-01 | 13F | Winebrenner Capital Management Llc | 7.119 | 296 | ||||||
| 2025-07-08 | 13F | Ehrlich Financial Group | 0 | -100,00 | 0 | |||||
| 2025-04-18 | 13F | Creative Capital Management Investments LLC | 0 | -100,00 | 0 | |||||
| 2025-08-01 | 13F | Red Lighthouse Investment Management, Llc | 81.411 | -9,70 | 3.388 | -8,90 | ||||
| 2025-08-08 | 13F | Gts Securities Llc | 0 | -100,00 | 0 | |||||
| 2025-08-12 | 13F | LPL Financial LLC | 767.656 | 15,62 | 31.950 | 16,26 | ||||
| 2025-05-13 | 13F | EverSource Wealth Advisors, LLC | 0 | -100,00 | 0 | |||||
| 2025-07-31 | 13F | Cambridge Investment Research Advisors, Inc. | 94.506 | 28,69 | 4 | 0,00 | ||||
| 2025-08-13 | 13F | Cresset Asset Management, LLC | 168.486 | 6,68 | 7.012 | 7,28 | ||||
| 2025-07-29 | 13F | Werba Rubin Papier Wealth Management | 14.509 | 604 | ||||||
| 2025-08-14 | 13F | Betterment LLC | 18.305 | 1,02 | 1 | |||||
| 2025-08-14 | 13F | Mml Investors Services, Llc | 115.842 | -5,51 | 5 | -20,00 | ||||
| 2025-07-28 | 13F | Mutual Advisors, LLC | 6.969 | -5,24 | 288 | -4,64 | ||||
| 2025-07-11 | 13F | Quantum Financial Advisors, LLC | 105.697 | -1,69 | 4.399 | -1,12 | ||||
| 2025-07-15 | 13F | Elevated Capital Advisors, LLC | 21.965 | 0,00 | 909 | 0,00 | ||||
| 2025-08-14 | 13F | Raymond James Financial Inc | 348.825 | 6,28 | 14.518 | 6,87 | ||||
| 2025-07-17 | 13F | Beacon Capital Management, LLC | 1.864 | 78 | ||||||
| 2025-08-12 | 13F | Proequities, Inc. | 0 | 0 | ||||||
| 2025-05-16 | 13F | Coppell Advisory Solutions LLC | 0 | -100,00 | 0 | |||||
| 2025-08-13 | 13F | Flow Traders U.s. Llc | 0 | -100,00 | 0 | |||||
| 2025-08-14 | 13F | Planwiser Financial, Llc | 74.854 | -9,10 | 3.092 | -8,50 | ||||
| 2025-08-18 | NP | PACIFIC SELECT FUND - PSF DFA Balanced Allocation Portfolio Class D | 1.129.233 | 13,28 | 46.999 | 13,91 | ||||
| 2025-07-16 | 13F | Meredith Wealth Planning | 5.657 | 1,14 | 235 | 1,73 | ||||
| 2025-07-21 | 13F | Verus Financial Partners, Inc. | 1.354.347 | 3,22 | 55.935 | 4,46 | ||||
| 2025-07-22 | 13F | Echo Wealth Management, LLC | 516.788 | 30,42 | 21.509 | 31,14 | ||||
| 2025-07-18 | 13F | Dogwood Wealth Management LLC | 127.151 | -5,79 | 5.230 | -6,37 | ||||
| 2025-07-28 | 13F | Axxcess Wealth Management, Llc | 212.879 | 0,73 | 8.860 | 1,29 | ||||
| 2025-07-14 | 13F | Park Avenue Securities Llc | 464.250 | 8,33 | 19 | 11,76 | ||||
| 2025-08-18 | 13F/A | National Bank Of Canada /fi/ | 5.204 | 89,51 | 216 | 91,96 | ||||
| 2025-07-17 | 13F | LexAurum Advisors, LLC | 405.379 | 7,36 | 16.872 | 7,95 | ||||
| 2025-08-08 | 13F | Schwarz Dygos Wheeler Investment Advisors Llc | 19.173 | 3,74 | 798 | 4,31 | ||||
| 2025-07-22 | 13F | Wealthcare Advisory Partners LLC | 9.252 | 1,15 | 385 | 1,85 | ||||
| 2025-08-15 | 13F | CI Private Wealth, LLC | 409.239 | -80,59 | 17.033 | -80,48 | ||||
| 2025-07-24 | 13F | Endeavor Private Wealth, Inc. | 122.019 | 26,26 | 5.078 | 26,95 | ||||
| 2025-08-15 | 13F | Morgan Stanley | 3.640 | 113,36 | 151 | 115,71 | ||||
| 2025-07-17 | 13F | Oceanside Advisors LLC | 7.962 | -0,85 | 331 | -0,30 | ||||
| 2025-07-17 | 13F | SC&H Financial Advisors, Inc. | 65.881 | 4,18 | 2.742 | 4,74 | ||||
| 2025-08-14 | 13F | Wells Fargo & Company/mn | 111.883 | -45,50 | 4.657 | -45,20 | ||||
| 2025-08-21 | 13F | Aveo Capital Partners, LLC | 0 | -100,00 | 0 | |||||
| 2025-08-11 | 13F | Kingdom Financial Group LLC. | 14.464 | 602 | ||||||
| 2025-08-14 | 13F | CoreCap Advisors, LLC | 73.440 | 35,50 | 3.057 | 36,25 | ||||
| 2025-04-14 | 13F | Farther Finance Advisors, LLC | 0 | -100,00 | 0 | -100,00 | ||||
| 2025-08-14 | 13F | Mariner, LLC | 159.685 | 12,45 | 6.646 | 13,08 | ||||
| 2025-07-09 | 13F | Bank of New Hampshire | 12.450 | 518 | ||||||
| 2025-08-04 | 13F | Arcadia Wealth Management, Inc. | 60.929 | 6,01 | 2.536 | 6,60 | ||||
| 2025-08-14 | 13F | Eaton-Cambridge Inc. | 32.981 | -16,39 | 1.373 | -15,93 | ||||
| 2025-08-15 | 13F | Keel Point, LLC | 4.863 | 0,00 | 202 | 0,50 | ||||
| 2025-07-24 | 13F | WMG Financial Advisors, LLC | 37.046 | 6,29 | 1.542 | 6,87 | ||||
| 2025-07-25 | 13F | Cwm, Llc | 8.725 | -14,69 | 0 | |||||
| 2025-07-17 | 13F | Centennial Wealth Advisory LLC | 476.954 | 3,97 | 19.858 | 4,59 | ||||
| 2025-07-23 | 13F | Allegiance Financial Group Advisory Services LLC | 436.308 | 6,41 | 18.159 | 7,00 | ||||
| 2025-08-11 | 13F | Trajan Wealth LLC | 179.275 | -1,92 | 7.461 | -1,37 | ||||
| 2025-08-14 | 13F | Royal Bank Of Canada | 424.828 | 18,96 | 17.682 | 19,63 | ||||
| 2025-08-07 | 13F | Tillman Hartley LLC | 16.779 | 48,34 | 698 | 49,15 | ||||
| 2025-07-08 | 13F | Goldstone Financial Group, LLC | 19.560 | -5,03 | 809 | -5,16 | ||||
| 2025-07-21 | 13F | Keb Asset Management, Llc | 7.722 | 0,00 | 321 | 0,63 | ||||
| 2025-08-06 | 13F | Commonwealth Equity Services, Llc | 203.931 | 5,39 | 8 | 0,00 | ||||
| 2025-08-08 | 13F | Truepoint, Inc. | 51.540 | 5,61 | 2.145 | 6,24 | ||||
| 2025-08-12 | 13F | Nemes Rush Group LLC | 315 | 0,00 | 13 | 0,00 | ||||
| 2025-07-08 | 13F | Atwood & Palmer Inc | 6.635 | 0,00 | 276 | 0,73 | ||||
| 2025-07-09 | 13F | Dynamic Advisor Solutions LLC | 46.436 | 1.933 | ||||||
| 2025-07-31 | 13F | CVA Family Office, LLC | 2.170 | 0,00 | 90 | 1,12 | ||||
| 2025-07-22 | 13F | Simplicity Wealth,LLC | 2.191.612 | 112,45 | 91.215 | 113,63 | ||||
| 2025-09-04 | 13F/A | Advisor Group Holdings, Inc. | 547 | 1,30 | 23 | 0,00 | ||||
| 2025-07-31 | 13F | Orion Capital Management LLC | 1.463 | 61 | ||||||
| 2025-08-01 | 13F | Envestnet Asset Management Inc | 1.090.700 | 12,71 | 45.395 | 13,33 | ||||
| 2025-07-23 | 13F | Wealth Management Nebraska | 14.618 | -14,32 | 606 | -14,16 | ||||
| 2025-04-28 | 13F | Clune & Associates, Ltd. | 0 | -100,00 | 0 | |||||
| 2025-08-06 | 13F | Golden State Wealth Management, LLC | 15.852 | 4,95 | 660 | 5,44 | ||||
| 2025-05-06 | 13F | Financial Partners Group, Inc | 0 | -100,00 | 0 | -100,00 | ||||
| 2025-08-12 | 13F | Hill Investment Group Partners, LLC | 1.210.640 | -2,03 | 50.387 | -1,49 | ||||
| 2025-08-14 | 13F | Great Valley Advisor Group, Inc. | 110.272 | -10,95 | 4.589 | -10,46 | ||||
| 2025-08-12 | 13F | American Century Companies Inc | 178.198 | 10,90 | 7.417 | 11,52 | ||||
| 2025-08-13 | 13F | B&D White Capital Company, LLC | 128.882 | 1,75 | 5.364 | 2,33 | ||||
| 2025-07-15 | 13F | Highland Financial Advisors, LLC | 507.944 | 0,79 | 21.141 | 1,35 | ||||
| 2025-07-24 | 13F | Grand Wealth Management, Llc | 33.597 | -23,95 | 1.398 | -23,52 | ||||
| 2025-08-14 | 13F | IHT Wealth Management, LLC | 64.365 | 20,42 | 2.679 | 21,07 | ||||
| 2025-08-07 | 13F | Resources Investment Advisors, LLC. | 7.959 | -1,00 | 331 | -0,30 | ||||
| 2025-05-13 | 13F | Steward Partners Investment Advisory, Llc | 0 | -100,00 | 0 |