Grundlæggende statistik
| Institutionelle ejere | 123 total, 123 long only, 0 short only, 0 long/short - change of 14,95% MRQ |
| Gennemsnitlig porteføljeallokering | 0.4329 % - change of 12,43% MRQ |
| Institutionelle aktier (lange) | 6.394.493 (ex 13D/G) - change of 4,38MM shares 217,77% MRQ |
| Institutionel værdi (lang) | $ 212.960 USD ($1000) |
Institutionelt ejerskab og aktionærer
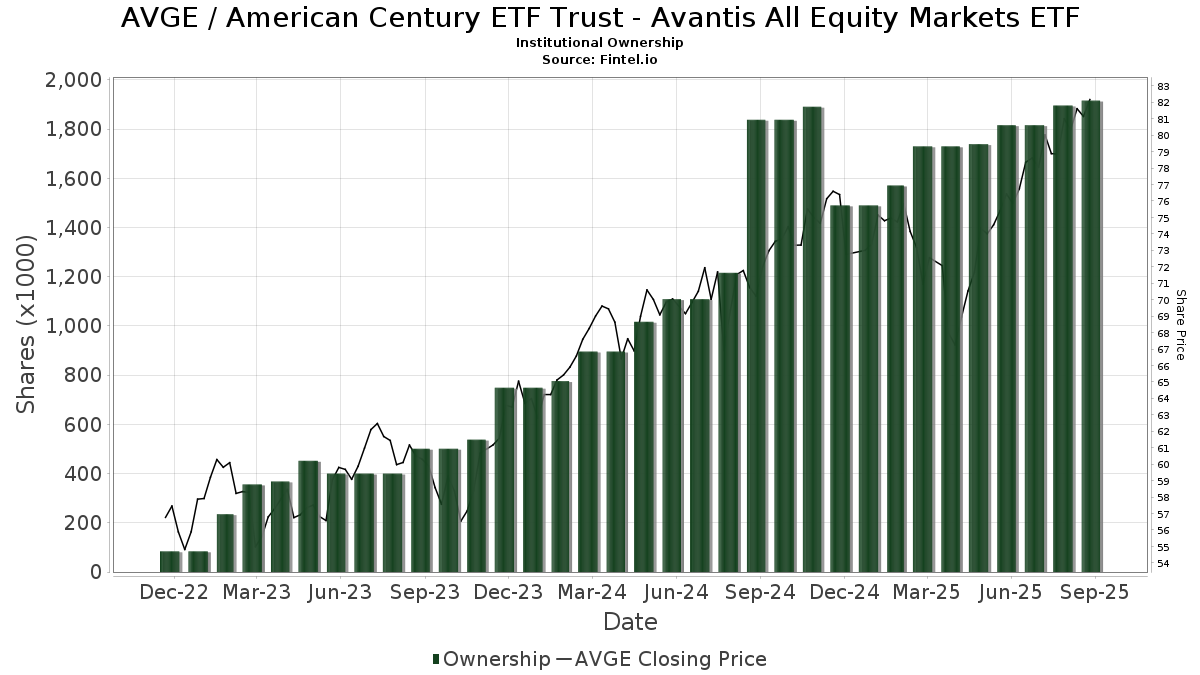
American Century ETF Trust - Avantis All Equity Markets ETF (US:AVGE) har 123 institutionelle ejere og aktionærer, der har indsendt 13D/G- eller 13F-formularer til Securities Exchange Commission (SEC). Disse institutioner har i alt 6,394,493 aktier. Største aktionærer omfatter Align Financial, LLC, Meredith Wealth Planning, Greenspring Advisors, LLC, Wealthstream Advisors, Inc., BIP Wealth, LLC, Nova R Wealth, Inc., LPL Financial LLC, Index Fund Advisors, Inc., Pacific Asset Management, LLC, and Compass Ion Advisors, LLC .
American Century ETF Trust - Avantis All Equity Markets ETF (ARCA:AVGE) institutionel ejerskabsstruktur viser aktuelle positioner i virksomheden efter institutioner og fonde, samt seneste ændringer i positionsstørrelse. Større aktionærer kan omfatte individuelle investorer, investeringsforeninger, hedgefonde eller institutioner. Skema 13D angiver, at investoren besidder (eller besidder) mere end 5 % af virksomheden og har til hensigt (eller har til hensigt at) aktivt at forfølge en ændring i forretningsstrategi. Skema 13G indikerer en passiv investering på over 5%.
The share price as of March 13, 2026 is 87,58 / share. Previously, on March 17, 2025, the share price was 72,37 / share. This represents an increase of 21,02% over that period.
Fondens stemningsscore
Fund Sentiment Score (fka Ownership Accumulation Score) finder de aktier, der bliver mest købt af fonde. Det er resultatet af en sofistikeret, multi-faktor kvantitativ model, der identificerer virksomheder med de højeste niveauer af institutionel akkumulering. Scoringsmodellen bruger en kombination af den samlede stigning i oplyste ejere, ændringerne i porteføljeallokeringer i disse ejere og andre målinger. Tallet går fra 0 til 100, hvor højere tal indikerer et højere niveau af akkumulering for sine jævnaldrende, og 50 er gennemsnittet.
Opdateringsfrekvens: Dagligt
Se Ownership Explorer, som giver en liste over højest rangerende virksomheder.
AI+ Ask Fintel’s AI assistant about American Century ETF Trust - Avantis All Equity Markets ETF.
Select a question to share a public post with an AI-crafted answer.
Thinking of good questions…
Institutionel Put/Call-forhold
Ud over at indberette standardaktie- og gældsudstedelser skal institutter med mere end 100 mill. aktiver under forvaltning også oplyse deres put- og call-optionsbeholdninger. Da salgsoptioner generelt indikerer negativ stemning, og købsoptioner indikerer positiv stemning, kan vi få en fornemmelse af den overordnede institutionelle stemning ved at plotte forholdet mellem put og kald. Diagrammet til højre viser det historiske put/call-forhold for dette instrument.
Brug af Put/Call Ratio som en indikator for investorernes stemning overvinder en af de vigtigste mangler ved at bruge totalt institutionelt ejerskab, som er, at en betydelig mængde af aktiver under forvaltning investeres passivt for at spore indekser. Passivt forvaltede fonde køber typisk ikke optioner, så indikatoren for put/call-forholdet følger mere nøje følelsen af aktivt forvaltede fonde.
13F og NPORT arkivering
Detaljer om 13F-arkivering er gratis. Detaljer om NP-ansøgninger kræver et premium-medlemskab. Grønne rækker angiver nye positioner. Røde rækker angiver lukkede positioner. Klik på linket ikon for at se den fulde transaktionshistorik.
Opgrader
for at låse premium-data op og eksportere til Excel ![]() .
.
| Fil dato | Kilde | Investor | Type | Gennemsnitlig pris (Øst) |
Aktier | Δ Aktier (%) |
Rapporteret Værdi ($1000) |
Δ Værdi (%) |
Port Alloc (%) |
|
|---|---|---|---|---|---|---|---|---|---|---|
| 2026-01-12 | 13F | Arlington Financial Advisors, LLC | 3.786 | 4,04 | 325 | 7,26 | ||||
| 2026-01-27 | 13F | Elevate Wealth Advisory, Inc | 109 | 303,70 | 9 | 350,00 | ||||
| 2026-02-13 | 13F | Mml Investors Services, Llc | 2.506 | 215 | ||||||
| 2026-01-07 | 13F | WESPAC Advisors SoCal, LLC | 2.914 | -4,02 | 250 | -1,19 | ||||
| 2026-01-26 | 13F | Austin Wealth Management, LLC | 45.820 | 7,44 | 4.041 | 13,64 | ||||
| 2026-01-12 | 13F | Canvas Wealth Advisors, LLC | 3.949 | 10,90 | 339 | 13,38 | ||||
| 2026-02-03 | 13F | McIlrath & Eck, LLC | 82 | -15,46 | 7 | -12,50 | ||||
| 2026-02-17 | 13F | Modern Wealth Management, LLC | 20.908 | 0,80 | 1.796 | 3,82 | ||||
| 2026-01-08 | 13F | Hutchens & Kramer Investment Management Group, LLC | 28.459 | 6,51 | 2.445 | 9,69 | ||||
| 2026-02-17 | 13F | Equitable Holdings, Inc. | 6.851 | 589 | ||||||
| 2026-02-13 | 13F | Morgan Stanley | 4 | 0,00 | 0 | |||||
| 2025-11-03 | 13F | SYM FINANCIAL Corp | 0 | -100,00 | 0 | |||||
| 2026-01-21 | 13F | BIP Wealth, LLC | 103.796 | 11,22 | 8.917 | 14,57 | ||||
| 2025-11-06 | 13F | Wealthstream Advisors, Inc. | 169.428 | 3,36 | 14.132 | 11,26 | ||||
| 2026-02-09 | 13F | Collaborative Wealth Managment Inc. | 32.937 | -7,93 | 2.830 | -5,19 | ||||
| 2026-01-16 | 13F | Ronald Blue Trust, Inc. | 1 | 0,00 | 0 | |||||
| 2026-01-20 | 13F | Global Trust Asset Management, LLC | 38 | -87,33 | 3 | -88,00 | ||||
| 2026-01-22 | 13F | Fmb Wealth Management | 62.780 | 0,33 | 5.393 | 3,33 | ||||
| 2026-01-26 | 13F | Cwm, Llc | 21.039 | 2,75 | 2 | 0,00 | ||||
| 2026-01-26 | 13F | Intelligent Financial Strategies | 65.294 | -0,01 | 5.609 | 2,99 | ||||
| 2026-01-23 | 13F | Fonville Wealth Management LLC | 2.945 | 7,95 | 253 | 11,45 | ||||
| 2026-01-29 | 13F | UMA Financial Services, Inc. | 3.041 | 0,86 | 261 | 3,98 | ||||
| 2026-01-14 | 13F | Accurate Wealth Management, LLC | 3.210 | 285 | ||||||
| 2026-01-15 | 13F | PFG Private Wealth Management, LLC | 0 | -100,00 | 0 | |||||
| 2026-02-05 | 13F | Yardley Wealth Management LLC | 30.115 | 12,52 | 2.587 | 15,91 | ||||
| 2026-02-12 | 13F | Commonwealth Equity Services, Llc | 64.701 | 2,66 | 5.558 | 111.060,00 | ||||
| 2026-01-27 | 13F | Holcombe Financial, Inc. | 5.254 | 1,37 | 451 | 4,40 | ||||
| 2026-01-23 | 13F | Farther Finance Advisors, LLC | 10.710 | 920 | ||||||
| 2026-02-13 | 13F | Entrewealth, Llc | 29.151 | 1,71 | 2.689 | 12,51 | ||||
| 2026-01-08 | 13F | Ridgeline Wealth, LLC | 27.879 | 19,48 | 2.395 | 23,07 | ||||
| 2026-02-02 | 13F | TCI Wealth Advisors, Inc. | 6.225 | 1,73 | 535 | 4,71 | ||||
| 2026-01-12 | 13F | Rialto Wealth Management, LLC | 0 | -100,00 | 0 | |||||
| 2026-02-06 | 13F | Global Retirement Partners, LLC | 141 | 0,71 | 12 | 9,09 | ||||
| 2026-01-21 | 13F | SC&H Financial Advisors, Inc. | 27.695 | 1,60 | 2.379 | 4,66 | ||||
| 2026-02-05 | 13F | Allworth Financial LP | 1.832 | 14,50 | 157 | 18,05 | ||||
| 2026-02-18 | 13F | Beacon Pointe Advisors, LLC | 14.261 | 25,88 | 1.225 | 29,77 | ||||
| 2026-01-14 | 13F | Northwest Wealth Management, Llc | 2.704 | -0,55 | 232 | 2,65 | ||||
| 2026-01-20 | 13F | Savvy Advisors, Inc. | 3.967 | 341 | ||||||
| 2026-01-30 | 13F | Valued Wealth Advisors LLC | 1.172 | 10,46 | 101 | 13,64 | ||||
| 2026-02-05 | 13F | Cambridge Investment Research Advisors, Inc. | 11.608 | -3,02 | 1 | |||||
| 2026-02-10 | 13F | Envestnet Asset Management Inc | 5.492 | 2,29 | 472 | 5,37 | ||||
| 2026-02-11 | 13F | Curio Wealth, Llc | 20.570 | 72,68 | 1.786 | 79,86 | ||||
| 2026-01-26 | 13F | Frankly Finances, LLC | 51.639 | 4.436 | ||||||
| 2026-01-29 | 13F | Index Fund Advisors, Inc. | 76.081 | 7,61 | 6.536 | 10,84 | ||||
| 2026-02-17 | 13F | Pacific Financial Group Inc | 0 | -100,00 | 0 | |||||
| 2026-02-13 | 13F | Three Arch Wealth Management LLC | 3.912 | 336 | ||||||
| 2026-02-17 | 13F | Aqr Capital Management Llc | 8.145 | 700 | ||||||
| 2026-02-18 | 13F | GWM Advisors LLC | 262 | 29,70 | 23 | 37,50 | ||||
| 2026-02-19 | 13F | CI Private Wealth, LLC | 36.956 | -0,16 | 3.175 | 2,82 | ||||
| 2026-01-29 | 13F | Aprio Wealth Management, LLC | 4.285 | 368 | ||||||
| 2026-01-12 | 13F | Sax Wealth Advisors, Llc | 4.643 | -17,12 | 399 | -14,78 | ||||
| 2026-01-16 | 13F | Meredith Wealth Planning | 232.703 | 44,93 | 19.992 | 49,28 | ||||
| 2026-01-21 | 13F | Apella Capital, LLC | 15.729 | 25,04 | 1.351 | 29,90 | ||||
| 2026-01-28 | 13F | Financial Plan, Inc. | 10.498 | 902 | ||||||
| 2026-02-12 | 13F | Jane Street Group, Llc | 0 | -100,00 | 0 | |||||
| 2026-01-12 | 13F | CVA Family Office, LLC | 189 | 0,00 | 16 | 6,67 | ||||
| 2026-01-29 | 13F | Compass Ion Advisors, LLC | 68.266 | -8,52 | 5.865 | -5,78 | ||||
| 2026-02-11 | 13F | Buckingham Strategic Partners | 27.976 | 329,61 | 2.403 | 341,73 | ||||
| 2026-01-23 | 13F | Creative Capital Management Investments LLC | 6.463 | 4,06 | 555 | 7,14 | ||||
| 2026-02-17 | 13F | Cresset Asset Management, LLC | 14.001 | 2,90 | 1.203 | 6,00 | ||||
| 2026-02-13 | 13F | B&D White Capital Company, LLC | 45.162 | 0,00 | 3.880 | 3,00 | ||||
| 2026-01-08 | 13F | Bayshore Asset Management, Llc | 2.371 | -2,75 | 204 | 0,00 | ||||
| 2026-02-06 | 13F | EverSource Wealth Advisors, LLC | 2.805 | 4,78 | 241 | 7,62 | ||||
| 2026-02-10 | 13F | WCG Wealth Advisors LLC | 24.595 | -0,01 | 2.113 | 2,97 | ||||
| 2026-02-12 | 13F | Annandale Capital, LLC | 2.699 | -0,04 | 0 | -100,00 | ||||
| 2026-02-05 | 13F | Plancorp, LLC | 9.545 | 2,26 | 820 | 5,27 | ||||
| 2026-01-30 | 13F | Torren Management, LLC | 420 | 36 | ||||||
| 2026-01-08 | 13F | Fermata Advisors, LLC | 40.589 | 13,38 | 3.487 | 16,78 | ||||
| 2026-02-10 | 13F | Greenspring Advisors, LLC | 174.276 | 14.972 | ||||||
| 2026-02-19 | 13F/A | Axxcess Wealth Management, Llc | 26.819 | 2.304 | ||||||
| 2026-02-23 | 13F | Beaird Harris Wealth Management, LLC | 2.095 | 1,40 | 180 | 4,07 | ||||
| 2025-11-06 | 13F | Ameritas Advisory Services, LLC | 0 | -100,00 | 0 | -100,00 | ||||
| 2026-02-02 | 13F | Vawter Financial, Ltd. | 6.896 | 3,70 | 592 | 6,86 | ||||
| 2026-02-02 | 13F | Integrity Wealth Solutions LLC | 15.275 | 54,03 | 1.312 | 58,65 | ||||
| 2026-01-05 | 13F | Catherine Avery Investment Management LLC | 0 | -100,00 | 0 | -100,00 | ||||
| 2026-02-12 | 13F | Betterment LLC | 28.905 | 16,56 | 2 | 0,00 | ||||
| 2026-02-13 | 13F | North Ridge Wealth Advisors, Inc. | 0 | -100,00 | 0 | |||||
| 2026-02-10 | 13F | Cogent Private Wealth, Inc. | 30.338 | 2.606 | ||||||
| 2026-02-06 | 13F | Magnolia Private Wealth, LLC | 37.310 | 0,22 | 3.205 | 3,22 | ||||
| 2026-01-09 | 13F | GEM Asset Management, LLC | 6.114 | 4,44 | 537 | 9,61 | ||||
| 2026-02-06 | 13F | Ferguson Johnson Wealth Management Inc | 6.410 | 1 | ||||||
| 2026-01-23 | 13F | BCR Wealth Strategies, LLC | 3.659 | 1,61 | 0 | |||||
| 2026-01-15 | 13F | Foster & Motley Inc | 4.724 | 21,10 | 0 | |||||
| 2026-01-16 | 13F | Red Lighthouse Investment Management, Llc | 3.213 | 36,09 | 276 | 40,82 | ||||
| 2026-02-03 | 13F | Navigoe, LLC | 155 | 0,00 | 0 | |||||
| 2026-01-08 | 13F | Versant Capital Management, Inc | 7.144 | 5,54 | 614 | 8,69 | ||||
| 2026-02-13 | 13F | Wilkerson Advisory Group LLC | 31.157 | 2.677 | ||||||
| 2026-02-13 | 13F | Eaton-Cambridge Inc. | 7.136 | -9,65 | 613 | -6,84 | ||||
| 2026-01-15 | 13F | Barlow Wealth Partners, Inc. | 4.472 | 0,00 | 397 | 6,45 | ||||
| 2026-02-17 | 13F | Advisor Group Holdings, Inc. | 1.585 | 374,55 | 137 | 403,70 | ||||
| 2026-01-30 | 13F | Strategic Blueprint, LLC | 9.989 | 9,18 | 858 | 12,45 | ||||
| 2026-02-11 | 13F | LPL Financial LLC | 77.045 | 1,81 | 6.619 | 4,85 | ||||
| 2026-01-26 | 13F | AE Wealth Management LLC | 2.867 | 0,00 | 246 | 2,93 | ||||
| 2026-02-13 | 13F | SRS Capital Advisors, Inc. | 662 | 57 | ||||||
| 2026-01-14 | 13F | Meritas Wealth Management, LLC | 3.437 | 29,89 | 295 | 34,09 | ||||
| 2026-01-26 | 13F | Great Point Wealth Advisors, LLC | 3.369 | -1,69 | 289 | 1,40 | ||||
| 2026-01-28 | 13F | Pacific Asset Management, LLC | 69.919 | 33,48 | 6.007 | 37,47 | ||||
| 2026-01-23 | 13F | Lam Group, Inc. | 12.467 | 0,78 | 1.071 | 3,88 | ||||
| 2026-01-28 | 13F | WMG Financial Advisors, LLC | 15.898 | -4,53 | 1.366 | -1,73 | ||||
| 2026-02-11 | 13F | Nemes Rush Group LLC | 8.740 | 0,48 | 751 | 3,45 | ||||
| 2026-02-13 | 13F | Wells Fargo & Company/mn | 341 | -11,43 | 29 | -9,37 | ||||
| 2025-10-24 | 13F | Oak Wealth Advisors LLC | 3.331 | 1,93 | 278 | 9,49 | ||||
| 2026-01-26 | 13F | Private Trust Co Na | 1.045 | 83,33 | 90 | 89,36 | ||||
| 2026-01-07 | 13F | Henrickson Nauta Wealth Advisors, Inc. | 4.718 | 417 | ||||||
| 2026-02-17 | 13F | Susquehanna International Group, Llp | 0 | -100,00 | 0 | |||||
| 2026-02-03 | 13F | Orion Capital Management LLC | 1.160 | 0,87 | 100 | 4,21 | ||||
| 2026-02-17 | 13F | Advisory Services Network, LLC | 9.377 | -4,09 | 806 | -1,23 | ||||
| 2026-01-12 | 13F | Paragon Advisors, LLC | 62.817 | -22,83 | 5.397 | -20,52 | ||||
| 2026-01-21 | 13F | Modera Wealth Management, LLC | 9.402 | 0,00 | 808 | 2,93 | ||||
| 2026-01-23 | 13F | Private Wealth Management Group, LLC | 1.219 | 62,97 | 105 | 67,74 | ||||
| 2026-02-17 | 13F | TCG Advisory Services, LLC | 10.094 | 867 | ||||||
| 2026-01-14 | 13F | Nova R Wealth, Inc. | 99.899 | -2,13 | 8.582 | 0,81 | ||||
| 2026-02-13 | 13F | marrick wealth, LLC | 4.506 | 387 | ||||||
| 2026-02-17 | 13F | McCartney Wealth Management LLC | 2.889 | 248 | ||||||
| 2026-01-07 | 13F | Magnus Financial Group LLC | 2.431 | 209 | ||||||
| 2026-02-04 | 13F | LRI Investments, LLC | 1.441 | 0,84 | 124 | 3,36 | ||||
| 2025-11-13 | 13F | Strategic Financial Concepts, LLC | 0 | -100,00 | 0 | |||||
| 2026-01-30 | 13F | Sage Rhino Capital Llc | 5.813 | 19,66 | 499 | 23,21 | ||||
| 2026-01-26 | 13F | Oceanside Advisors LLC | 17.458 | 2,83 | 1.500 | 5,86 | ||||
| 2026-02-13 | 13F | Kestra Advisory Services, LLC | 0 | -100,00 | 0 | |||||
| 2026-02-11 | 13F | Jpmorgan Chase & Co | 488 | -26,40 | 42 | -25,45 | ||||
| 2026-02-02 | 13F | Vista Capital Partners, Inc. | 2.698 | 0,97 | 232 | 4,05 | ||||
| 2026-02-05 | 13F | Avantax Planning Partners, Inc. | 12.701 | 22,53 | 1.091 | 26,27 | ||||
| 2026-02-09 | 13F | Arq Wealth Advisors, Llc | 10.213 | 76,88 | 877 | 82,33 | ||||
| 2026-02-17 | 13F | Mercer Global Advisors Inc /adv | 16.229 | 0,54 | 1.394 | 3,57 | ||||
| 2026-01-12 | 13F | Evanson Asset Management, LLC | 32.261 | 10,44 | 2.772 | 13,75 | ||||
| 2026-01-28 | 13F | Atwood & Palmer Inc | 109 | 9 | ||||||
| 2026-01-13 | 13F | Team Financial Group, LLC | 85 | 7 | ||||||
| 2026-01-27 | 13F | Werba Rubin Papier Wealth Management | 0 | -100,00 | 0 | |||||
| 2026-01-08 | 13F | Sprinkle Financial Consultants LLC | 55.876 | 0,94 | 4.801 | 3,96 | ||||
| 2026-02-12 | 13F | Prudent Man Investment Management, Inc. | 169 | -67,25 | 15 | -62,16 | ||||
| 2026-02-17 | 13F | Align Financial, LLC | 3.880.077 | 3.880 | ||||||
| 2026-01-14 | 13F | Moisand Fitzgerald Tamayo, LLC | 717 | -0,55 | 62 | 1,67 | ||||
| 2026-02-17 | 13F | Creative Planning | 9.526 | 3,18 | 818 | 6,23 | ||||
| 2026-01-21 | 13F | SJS Investment Consulting Inc. | 19 | 0,00 | 2 | 0,00 |