Grundlæggende statistik
| Institutionelle ejere | 246 total, 243 long only, 0 short only, 3 long/short - change of -5,73% MRQ |
| Gennemsnitlig porteføljeallokering | 0.1540 % - change of -22,30% MRQ |
| Institutionelle aktier (lange) | 4.587.280 (ex 13D/G) - change of 0,02MM shares 0,51% MRQ |
| Institutionel værdi (lang) | $ 628.574 USD ($1000) |
Institutionelt ejerskab og aktionærer
ARK ETF Trust - ARK Next Generation Internet ETF (US:ARKW) har 246 institutionelle ejere og aktionærer, der har indsendt 13D/G- eller 13F-formularer til Securities Exchange Commission (SEC). Disse institutioner har i alt 4,587,280 aktier. Største aktionærer omfatter Morgan Stanley, Foundations Investment Advisors, LLC, Bank Of America Corp /de/, LPL Financial LLC, Gradient Investments LLC, Northwestern Mutual Wealth Management Co, Two Sigma Investments, Lp, Cwm, Llc, Serenus Wealth Advisors, LLC, and Anfield Capital Management, LLC .
ARK ETF Trust - ARK Next Generation Internet ETF (BATS:ARKW) institutionel ejerskabsstruktur viser aktuelle positioner i virksomheden efter institutioner og fonde, samt seneste ændringer i positionsstørrelse. Større aktionærer kan omfatte individuelle investorer, investeringsforeninger, hedgefonde eller institutioner. Skema 13D angiver, at investoren besidder (eller besidder) mere end 5 % af virksomheden og har til hensigt (eller har til hensigt at) aktivt at forfølge en ændring i forretningsstrategi. Skema 13G indikerer en passiv investering på over 5%.
The share price as of March 10, 2026 is 129,70 / share. Previously, on March 11, 2025, the share price was 93,59 / share. This represents an increase of 38,58% over that period.

Fondens stemningsscore
Fund Sentiment Score (fka Ownership Accumulation Score) finder de aktier, der bliver mest købt af fonde. Det er resultatet af en sofistikeret, multi-faktor kvantitativ model, der identificerer virksomheder med de højeste niveauer af institutionel akkumulering. Scoringsmodellen bruger en kombination af den samlede stigning i oplyste ejere, ændringerne i porteføljeallokeringer i disse ejere og andre målinger. Tallet går fra 0 til 100, hvor højere tal indikerer et højere niveau af akkumulering for sine jævnaldrende, og 50 er gennemsnittet.
Opdateringsfrekvens: Dagligt
Se Ownership Explorer, som giver en liste over højest rangerende virksomheder.
AI+ Ask Fintel’s AI assistant about ARK ETF Trust - ARK Next Generation Internet ETF.
Select a question to share a public post with an AI-crafted answer.
Thinking of good questions…
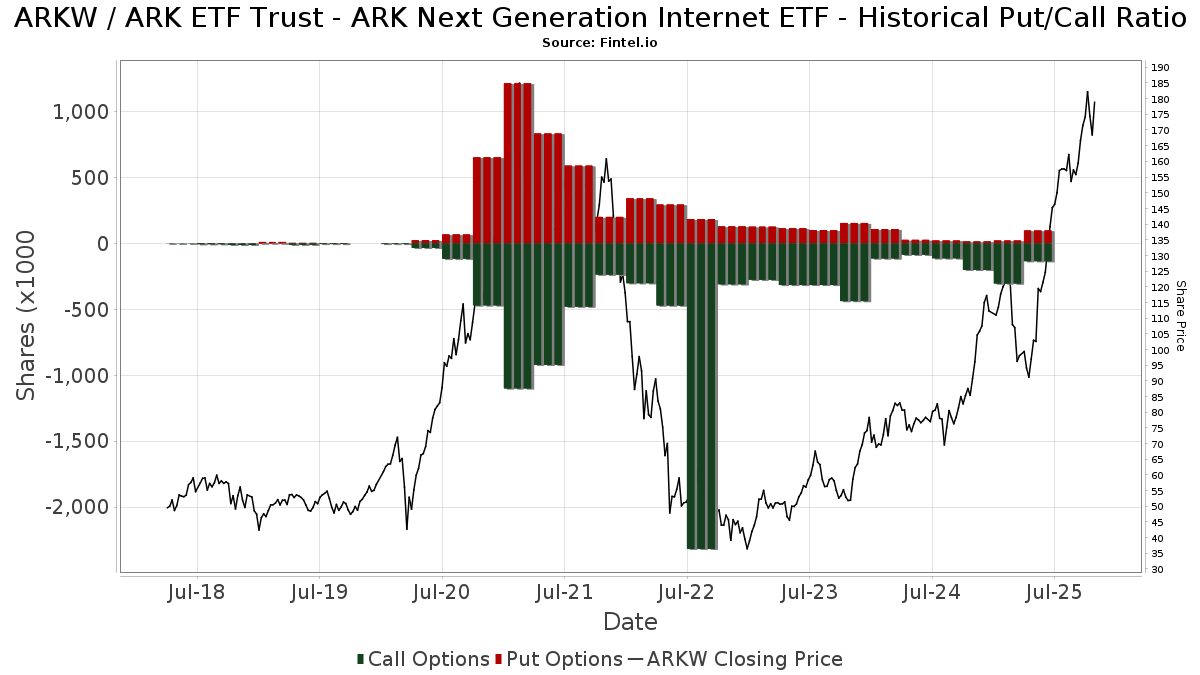
Institutionel Put/Call-forhold
Ud over at indberette standardaktie- og gældsudstedelser skal institutter med mere end 100 mill. aktiver under forvaltning også oplyse deres put- og call-optionsbeholdninger. Da salgsoptioner generelt indikerer negativ stemning, og købsoptioner indikerer positiv stemning, kan vi få en fornemmelse af den overordnede institutionelle stemning ved at plotte forholdet mellem put og kald. Diagrammet til højre viser det historiske put/call-forhold for dette instrument.
Brug af Put/Call Ratio som en indikator for investorernes stemning overvinder en af de vigtigste mangler ved at bruge totalt institutionelt ejerskab, som er, at en betydelig mængde af aktiver under forvaltning investeres passivt for at spore indekser. Passivt forvaltede fonde køber typisk ikke optioner, så indikatoren for put/call-forholdet følger mere nøje følelsen af aktivt forvaltede fonde.
13F og NPORT arkivering
Detaljer om 13F-arkivering er gratis. Detaljer om NP-ansøgninger kræver et premium-medlemskab. Grønne rækker angiver nye positioner. Røde rækker angiver lukkede positioner. Klik på linket ikon for at se den fulde transaktionshistorik.
Opgrader
for at låse premium-data op og eksportere til Excel ![]() .
.
| Fil dato | Kilde | Investor | Type | Gennemsnitlig pris (Øst) |
Aktier | Δ Aktier (%) |
Rapporteret Værdi ($1000) |
Δ Værdi (%) |
Port Alloc (%) |
|
|---|---|---|---|---|---|---|---|---|---|---|
| 2026-02-12 | 13F | Jane Street Group, Llc | Put | 0 | -100,00 | 0 | -100,00 | |||
| 2026-02-12 | 13F | Triumph Capital Management | 25 | 0,00 | 4 | -25,00 | ||||
| 2026-01-28 | 13F | Loring Wolcott & Coolidge Fiduciary Advisors Llp/ma | 1.086 | 0,00 | 158 | -15,51 | ||||
| 2026-02-06 | 13F | HighTower Advisors, LLC | 32.402 | -3,89 | 4.787 | -18,69 | ||||
| 2026-01-12 | 13F | AllSquare Wealth Management LLC | 468 | 0,00 | 82 | 17,39 | ||||
| 2026-01-15 | 13F | Jaffetilchin Investment Partners, LLC | 2.533 | -72,85 | 374 | -77,04 | ||||
| 2026-02-13 | 13F | 17 Capital Partners, Llc | 6.923 | -7,82 | 1.023 | -22,04 | ||||
| 2026-01-20 | 13F | Sovran Advisors, LLC | 3.289 | -32,44 | 491 | -41,20 | ||||
| 2026-01-22 | 13F | Financial Consulate, Inc | 466 | 0,65 | 69 | -15,00 | ||||
| 2026-02-17 | 13F | Two Sigma Securities, Llc | 4.702 | 179,05 | 695 | 136,05 | ||||
| 2026-02-11 | 13F | Jpmorgan Chase & Co | 5.401 | -62,74 | 798 | -68,50 | ||||
| 2026-01-23 | 13F | Brown, Lisle/cummings, Inc. | 300 | 0,00 | 44 | -15,38 | ||||
| 2026-02-13 | 13F | Ausdal Financial Partners, Inc. | 1.810 | -12,35 | 267 | -25,83 | ||||
| 2026-01-28 | 13F | Geneos Wealth Management Inc. | 15.737 | 0,00 | 2.325 | -15,40 | ||||
| 2026-02-11 | 13F | Deutsche Bank Ag\ | 35 | 5 | ||||||
| 2026-02-06 | 13F | Ignite Planners, LLC | 1.516 | -1,43 | 208 | -22,76 | ||||
| 2026-02-13 | 13F | Citigroup Inc | 72 | -11,11 | 11 | -28,57 | ||||
| 2026-02-02 | 13F | Breakwater Investment Management | 300 | 0,00 | 44 | -15,38 | ||||
| 2026-01-13 | 13F | Synergy Financial Management, LLC | 0 | -100,00 | 0 | |||||
| 2026-02-17 | 13F | Susquehanna International Group, Llp | Call | 7.300 | -70,45 | 1.078 | -75,00 | |||
| 2026-01-12 | 13F | Focus Financial Network, Inc. | 0 | -100,00 | 0 | |||||
| 2026-02-17 | 13F | Cresset Asset Management, LLC | 1.968 | 7,42 | 291 | -9,09 | ||||
| 2026-02-13 | 13F | Smartleaf Asset Management LLC | 29 | 4 | ||||||
| 2026-02-11 | 13F | Mattson Financial Services, LLC | 29.401 | 7,87 | 4.343 | -8,74 | ||||
| 2026-02-17 | 13F | Susquehanna International Group, Llp | 25.730 | -52,17 | 3.801 | -59,54 | ||||
| 2026-02-17 | 13F | Susquehanna International Group, Llp | Put | 9.500 | -44,77 | 1.403 | -53,28 | |||
| 2026-01-30 | 13F | Urban Wealth Management, LLC | 0 | -100,00 | 0 | -100,00 | ||||
| 2026-02-17 | 13F | Per Stirling Capital Management, LLC. | 0 | -100,00 | 0 | |||||
| 2026-02-11 | 13F | Group One Trading, L.p. | 54 | 8 | ||||||
| 2026-02-02 | 13F | Truist Financial Corp | 4.681 | 30,39 | 692 | 10,38 | ||||
| 2026-02-23 | 13F | Walser Wealth Management Company, A Ltd Liability Co | 1.597 | 236 | ||||||
| 2026-02-05 | 13F | Intrua Financial, LLC | 4.850 | -3,00 | 716 | -17,98 | ||||
| 2026-02-12 | 13F | Steward Partners Investment Advisory, Llc | 20.284 | 4,53 | 2.997 | -11,57 | ||||
| 2026-03-03 | 13F | NWF Advisory Services Inc. | 2.052 | -0,63 | 303 | -15,83 | ||||
| 2026-02-13 | 13F | Pathstone Holdings, LLC | 3.717 | 0,00 | 549 | -15,41 | ||||
| 2026-02-13 | 13F | Advyzon Investment Management, LLC | 2.694 | 85,79 | 398 | 56,92 | ||||
| 2026-02-06 | 13F | IFP Advisors, Inc | 207 | -62,84 | 31 | -69,07 | ||||
| 2026-02-12 | 13F | Brown Brothers Harriman & Co | 125 | 0,00 | 18 | -14,29 | ||||
| 2026-01-29 | 13F | DecisionPoint Financial, LLC | 20 | 3 | ||||||
| 2026-02-13 | 13F | Walleye Trading LLC | Call | 0 | -100,00 | 0 | ||||
| 2026-01-30 | 13F | Us Bancorp \de\ | 262 | 24,17 | 39 | 5,56 | ||||
| 2026-03-02 | 13F | Sankala Group LLC | 29 | 4 | ||||||
| 2026-01-23 | 13F | Westside Investment Management, Inc. | 975 | 0,00 | 144 | -15,29 | ||||
| 2025-11-14 | 13F | Prosperity Wealth Management, Inc. | 12.973 | 7,80 | 2.265 | 27,53 | ||||
| 2026-02-05 | 13F | HighMark Wealth Management LLC | 78 | 1,30 | 12 | -15,38 | ||||
| 2026-01-21 | 13F | Albion Financial Group /ut | 58 | 1,75 | 9 | -20,00 | ||||
| 2025-10-23 | 13F | Coastal Investment Advisors, Inc. | 0 | -100,00 | 0 | -100,00 | ||||
| 2025-11-12 | 13F | Transce3nd, LLC | 0 | -100,00 | 0 | |||||
| 2026-02-12 | 13F | Bank Of Montreal /can/ | 562 | -35,55 | 83 | -45,39 | ||||
| 2026-03-09 | 13F | EMC Capital Management | 4.880 | -1,11 | 1 | |||||
| 2026-02-11 | 13F | Commonwealth Retirement Investments LLC | 50 | 7 | ||||||
| 2026-02-06 | 13F | Pnc Financial Services Group, Inc. | 47 | -74,32 | 7 | -80,65 | ||||
| 2026-02-12 | 13F | Jane Street Group, Llc | 9.402 | -50,24 | 1.389 | -57,93 | ||||
| 2026-01-13 | 13F | Signal Advisors Wealth, LLC | 0 | -100,00 | 0 | |||||
| 2026-02-17 | 13F | VestGen Advisors, LLC | 10.033 | 1.482 | ||||||
| 2026-02-17 | 13F | Brown Financial Advisors | 2.141 | 6,89 | 316 | -9,46 | ||||
| 2025-10-20 | 13F | James J. Burns & Company, LLC | 0 | -100,00 | 0 | |||||
| 2026-02-12 | 13F | Jane Street Group, Llc | Call | 23.100 | -30,84 | 3.413 | -41,49 | |||
| 2026-02-13 | 13F | Bleichroeder LP | 0 | -100,00 | 0 | |||||
| 2026-01-21 | 13F | Flagship Harbor Advisors, Llc | 46 | 7 | ||||||
| 2026-01-26 | 13F | AE Wealth Management LLC | 543 | -9,35 | 80 | -23,08 | ||||
| 2026-02-13 | 13F | Glen Eagle Advisors, LLC | 140 | 0,00 | 21 | -16,67 | ||||
| 2025-10-16 | 13F | Kingstone Capital Partners Texas, LLC | 0 | -100,00 | 0 | -100,00 | ||||
| 2026-01-23 | 13F | Diversify Advisory Services, LLC | 1.870 | 5,35 | 278 | -10,65 | ||||
| 2026-01-12 | 13F | Certified Advisory Corp | 0 | -100,00 | 0 | |||||
| 2026-03-04 | 13F | SHP Wealth Management | 35 | 5 | ||||||
| 2026-02-17 | 13F | D. E. Shaw & Co., Inc. | 28.940 | -2,77 | 4.270 | -17,84 | ||||
| 2026-02-17 | 13F | Cetera Investment Advisers | 57.965 | -11,28 | 8.563 | -24,94 | ||||
| 2026-02-12 | 13F | Brinker Capital Investments, LLC | 3.757 | 160,00 | 555 | 120,24 | ||||
| 2026-01-21 | 13F | Sound Income Strategies, LLC | 177 | 41,60 | 26 | 18,18 | ||||
| 2026-02-17 | 13F | Creative Planning | 2.707 | -10,90 | 400 | -24,72 | ||||
| 2026-01-12 | 13F | Perkins Coie Trust Co | 0 | -100,00 | 0 | |||||
| 2026-02-10 | 13F | Clear Harbor Asset Management, LLC | 3.345 | 0,00 | 494 | -15,41 | ||||
| 2026-02-05 | 13F | Cambridge Investment Research Advisors, Inc. | 23.782 | -5,81 | 4 | -25,00 | ||||
| 2025-11-14 | 13F | Wolverine Trading, Llc | Put | 3.200 | -11,11 | 559 | 6,68 | |||
| 2026-02-05 | 13F | Cornerstone Wealth Management, LLC | 3.899 | 31,77 | 576 | 11,43 | ||||
| 2026-02-10 | 13F | Goldman Sachs Group Inc | 7.013 | 19,19 | 1.036 | 0,88 | ||||
| 2026-02-11 | 13F | Prudential Plc | 43.650 | -24,42 | 6.448 | -36,05 | ||||
| 2025-11-14 | 13F | Wolverine Trading, Llc | Call | 10.200 | 64,52 | 1.783 | 97,34 | |||
| 2026-01-27 | 13F | Belpointe Asset Management LLC | 2.967 | 3,16 | 438 | -12,75 | ||||
| 2026-01-12 | 13F | Wealth Management Partners, LLC | 32.645 | 37,16 | 4.823 | 16,05 | ||||
| 2026-01-28 | 13F | City State Bank | 10 | 0,00 | 1 | 0,00 | ||||
| 2026-02-09 | 13F | Kuhn & Co Investment Counsel | 2.000 | 295 | ||||||
| 2026-02-09 | 13F | Marshall Investment Management, Llc | 19.091 | -5,11 | 2.820 | -19,73 | ||||
| 2026-01-14 | 13F | Waldron Private Wealth LLC | 2.578 | 1,50 | 381 | -14,22 | ||||
| 2026-01-08 | 13F | Versant Capital Management, Inc | 101 | 0,00 | 15 | -17,65 | ||||
| 2026-02-11 | 13F | Janney Montgomery Scott LLC | 70.014 | 2,90 | 10 | -9,09 | ||||
| 2026-02-12 | 13F | BlackRock, Inc. | 232 | 0,00 | 34 | -15,00 | ||||
| 2026-01-27 | 13F | PFG Advisors | 1.702 | -28,25 | 251 | -39,37 | ||||
| 2026-01-15 | 13F | Paladin Wealth, LLC | 2.433 | 91,73 | 359 | 62,44 | ||||
| 2026-02-12 | 13F | CIBC Private Wealth Group, LLC | 0 | -100,00 | 0 | |||||
| 2026-01-29 | 13F | Quadcap Wealth Management, LLC | 1.842 | -34,61 | 272 | -44,60 | ||||
| 2026-02-11 | 13F | Simplex Trading, Llc | 619 | 91 | ||||||
| 2026-02-13 | 13F | MAI Capital Management | 973 | -18,30 | 144 | -30,92 | ||||
| 2026-02-10 | 13F | JTC Employer Solutions Trusteee Ltd | 1.145 | 0,00 | 0 | |||||
| 2026-01-23 | 13F | Lam Group, Inc. | 3.100 | 13,14 | 458 | -4,39 | ||||
| 2026-02-13 | 13F | Stifel Financial Corp | 5.097 | 1,57 | 753 | -14,16 | ||||
| 2026-01-29 | 13F | Comerica Bank | 85 | -53,55 | 13 | -61,29 | ||||
| 2026-02-12 | 13F | Mosley Wealth Management | 6.462 | 1.177 | ||||||
| 2025-11-14 | 13F | Wexford Capital Lp | 0 | -100,00 | 0 | -100,00 | ||||
| 2026-02-17 | 13F | Private Advisor Group, LLC | 29.300 | -6,91 | 4.329 | -21,24 | ||||
| 2026-02-02 | 13F | Sachetta, LLC | 85 | 0,00 | 13 | -14,29 | ||||
| 2026-01-26 | 13F | Provenance Wealth Advisors, LLC | 3.718 | 0,00 | 549 | -15,41 | ||||
| 2026-02-05 | 13F | Mesirow Financial Investment Management, Inc. | 0 | -100,00 | 0 | |||||
| 2026-02-17 | 13F | Citadel Advisors Llc | Call | 26.300 | -20,54 | 3.885 | -32,77 | |||
| 2026-02-17 | 13F | Raymond James Financial Inc | 78.772 | 7,74 | 11.637 | -8,85 | ||||
| 2026-02-17 | 13F | Citadel Advisors Llc | Put | 6.300 | -68,02 | 931 | -72,96 | |||
| 2026-02-10 | 13F | Envestnet Asset Management Inc | 27.735 | -6,28 | 4.097 | -20,71 | ||||
| 2026-02-17 | 13F | Citadel Advisors Llc | 43.557 | 129,08 | 6.435 | 93,80 | ||||
| 2026-02-13 | 13F | W Advisors, Llc | 1.658 | 0,00 | 245 | -15,57 | ||||
| 2026-02-17 | 13F | Quadrature Capital Ltd | 0 | -100,00 | 0 | |||||
| 2026-01-30 | 13F | Sigma Planning Corp | 3.555 | 54,77 | 525 | 30,92 | ||||
| 2026-01-08 | 13F | Gradient Investments LLC | 190.317 | 14,91 | 28.115 | -2,78 | ||||
| 2026-02-17 | 13F | Advisor Group Holdings, Inc. | 79.509 | -11,83 | 11.750 | -18,60 | ||||
| 2026-02-10 | 13F | Lido Advisors, LLC | 1.297 | 211 | ||||||
| 2026-02-17 | 13F | MGB Wealth Management, LLC | 305 | 1,67 | 45 | -13,46 | ||||
| 2026-01-29 | 13F | Nbc Securities, Inc. | 71 | 129,03 | 10 | 100,00 | ||||
| 2026-02-13 | 13F | Peak6 Llc | Call | 0 | -100,00 | 0 | ||||
| 2026-02-17 | 13F | Two Sigma Investments, Lp | 142.927 | 480,37 | 21.115 | 391,02 | ||||
| 2026-01-23 | 13F | Optima Capital Llc | 20 | 3 | ||||||
| 2026-01-26 | 13F | Cwm, Llc | 140.200 | 20,10 | 21 | 0,00 | ||||
| 2026-02-13 | 13F | Bay Colony Advisory Group, Inc d/b/a Bay Colony Advisors | 2.254 | -0,84 | 333 | -16,16 | ||||
| 2026-02-17 | 13F | GeoWealth Management, LLC | 0 | -100,00 | 0 | -100,00 | ||||
| 2026-02-04 | 13F | Nwam Llc | 4.105 | 0,00 | 597 | -16,39 | ||||
| 2026-02-13 | 13F | Golden State Wealth Management, LLC | 868 | 247,20 | 128 | 197,67 | ||||
| 2026-02-18 | 13F | GWM Advisors LLC | 7.107 | 26,46 | 1.050 | 6,93 | ||||
| 2026-02-02 | 13F | Montag A & Associates Inc | 189 | 0,00 | 28 | -18,18 | ||||
| 2025-10-24 | 13F | Opal Wealth Advisors, LLC | 0 | -100,00 | 0 | |||||
| 2025-10-07 | 13F | Thurston, Springer, Miller, Herd & Titak, Inc. | 0 | -100,00 | 0 | |||||
| 2025-10-31 | 13F | National Asset Management, Inc. | 0 | -100,00 | 0 | |||||
| 2026-02-10 | 13F | Crescent Grove Advisors, LLC | 33.158 | -10,16 | 4.898 | -23,99 | ||||
| 2026-02-19 | 13F | Birchwood Financial Partners, Inc. | 14 | 2 | ||||||
| 2026-01-08 | 13F | Wealth Enhancement Advisory Services, Llc | 13.048 | 16,96 | 1.986 | 0,40 | ||||
| 2026-01-26 | 13F | PFG Investments, LLC | 2.700 | -0,07 | 399 | -15,50 | ||||
| 2026-02-17 | 13F | Advisory Services Network, LLC | 2.483 | 3,07 | 367 | -12,86 | ||||
| 2026-02-12 | 13F | Hrt Financial Lp | 6.344 | 94,48 | 1 | |||||
| 2026-02-05 | 13F | Atria Investments Llc | 8.838 | 10,82 | 1.306 | -6,25 | ||||
| 2026-02-17 | 13F | Cdkv Holdings Llc | 16 | 2 | ||||||
| 2026-01-30 | 13F | Wealthfront Advisers Llc | 18.519 | 5,90 | 2.736 | -10,42 | ||||
| 2026-02-10 | 13F | One Capital Management, LLC | 10.838 | -13,02 | 1.601 | -26,39 | ||||
| 2026-02-20 | 13F | White Knight Strategic Wealth Advisors, LLC | 2.797 | 24,87 | 413 | 5,63 | ||||
| 2026-02-11 | 13F | VVR Holdings LLC | 1.871 | 276 | ||||||
| 2026-01-22 | 13F | Phoenix Wealth Advisors | 10.973 | -0,29 | 1.621 | -15,62 | ||||
| 2026-01-21 | 13F | Elwood & Goetz Wealth Advisory Group, LLC | 3.901 | 106,51 | 576 | 75,08 | ||||
| 2026-02-06 | 13F | Copia Wealth Management | 13.032 | -3,01 | 1.925 | -17,95 | ||||
| 2026-02-12 | 13F | StoneX Group Inc. | 6.182 | 8,32 | 913 | -8,33 | ||||
| 2026-02-13 | 13F | Aptus Capital Advisors, LLC | 24.275 | -8,04 | 3.586 | -22,20 | ||||
| 2026-01-20 | 13F | Relyea Zuckerberg Hanson LLC | 56.039 | -0,09 | 8.279 | -15,48 | ||||
| 2026-02-12 | 13F | Bradley Foster & Sargent Inc/ct | 2.058 | 0,00 | 304 | -15,32 | ||||
| 2026-02-14 | 13F | Whipplewood Advisors, LLC | 875 | 0,00 | 129 | -15,13 | ||||
| 2026-02-17 | 13F | Royal Bank Of Canada | 23.674 | 0,67 | 3.497 | -14,85 | ||||
| 2026-01-21 | 13F | Register Financial Advisors LLC | 0 | -100,00 | 0 | |||||
| 2025-12-09 | 13F/A | Tudor Investment Corp Et Al | 0 | -100,00 | 0 | |||||
| 2026-02-13 | 13F | Oxford Financial Group Ltd | 657 | 0,00 | 97 | -14,91 | ||||
| 2026-02-03 | 13F | Bokf, Na | 341 | 0,00 | 50 | -15,25 | ||||
| 2025-11-06 | 13F | Abich Financial Wealth Management LLC | 9 | 2 | ||||||
| 2026-02-12 | 13F | Renaissance Technologies Llc | 9.100 | -66,04 | 1.344 | -71,28 | ||||
| 2026-01-27 | 13F | Atlantic Edge Private Wealth Management, LLC | 25 | 0,00 | 4 | -25,00 | ||||
| 2026-02-09 | 13F | Collaborative Wealth Managment Inc. | 1.742 | 1,40 | 257 | -14,05 | ||||
| 2026-02-13 | 13F | Arkadios Wealth Advisors | 0 | -100,00 | 0 | |||||
| 2026-02-20 | 13F | Sunbelt Securities, Inc. | 62 | 0,00 | 9 | -10,00 | ||||
| 2026-01-26 | 13F | Financial Guidance Group, Inc. | 24.179 | -8,08 | 3.572 | -22,23 | ||||
| 2026-02-03 | 13F | Manske Wealth Management | 5.692 | -5,01 | 841 | -19,69 | ||||
| 2026-02-04 | 13F | Atlantic Union Bankshares Corp | 13 | 8,33 | 2 | -50,00 | ||||
| 2025-11-10 | 13F | Lion Street Advisors, LLC | 2.499 | 392 | ||||||
| 2026-02-17 | 13F | Mercer Global Advisors Inc /adv | 8.393 | 30,73 | 1.240 | 10,63 | ||||
| 2026-01-27 | 13F | Sterling Investment Counsel, LLC | 9.853 | 8,47 | 1.456 | -8,26 | ||||
| 2026-02-27 | 13F | Strategic Investment Solutions, Inc. /IL | 24 | 0,00 | 4 | -25,00 | ||||
| 2025-11-13 | 13F | Barometer Capital Management Inc. | 0 | -100,00 | 0 | -100,00 | ||||
| 2025-11-14 | 13F | Summit Financial, LLC | 0 | -100,00 | 0 | |||||
| 2026-02-17 | 13F | Jones Financial Companies Lllp | 6 | -98,91 | 1 | -100,00 | ||||
| 2026-01-23 | 13F | Assetmark, Inc | 106 | 0,00 | 16 | -16,67 | ||||
| 2026-02-17 | 13F | Quantitative Investment Management, LLC | 0 | -100,00 | 0 | |||||
| 2026-01-21 | 13F | Crews Bank & Trust | 400 | 0,00 | 59 | -14,49 | ||||
| 2026-02-04 | 13F | Horizon Wealth Management, LLC | 0 | -100,00 | 0 | |||||
| 2025-11-07 | 13F | Beacon Capital Management, LLC | 0 | -100,00 | 0 | |||||
| 2026-01-09 | 13F | Tactive Advisors, LLC | 0 | -100,00 | 0 | |||||
| 2025-11-14 | 13F | Millennium Management Llc | Put | 0 | -100,00 | 0 | ||||
| 2026-02-10 | 13F | Evolution Wealth Management Inc. | 40 | 0,00 | 6 | -16,67 | ||||
| 2026-01-29 | 13F | Ashton Thomas Private Wealth, LLC | 8.029 | 225,06 | 1.186 | 175,17 | ||||
| 2025-11-14 | 13F | Walleye Capital LLC | 0 | -100,00 | 0 | |||||
| 2026-02-04 | 13F | Biltmore Family Office, LLC | 2 | 0,00 | 0 | |||||
| 2026-02-10 | 13F/A | Northwestern Mutual Wealth Management Co | 154.089 | 3,60 | 22.763 | -12,35 | ||||
| 2026-02-12 | 13F | Betterment LLC | 6.695 | -14,22 | 1 | -100,00 | ||||
| 2026-02-13 | 13F | Barclays Plc | 0 | -100,00 | 0 | |||||
| 2026-01-21 | 13F | Hartford Financial Management Inc. | 47 | 2,17 | 7 | -25,00 | ||||
| 2026-02-03 | 13F | Anfield Capital Management, LLC | 95.116 | 124,10 | 14.051 | 89,60 | ||||
| 2026-02-12 | 13F | Federation des caisses Desjardins du Quebec | 759 | 0,00 | 112 | -15,91 | ||||
| 2026-01-14 | 13F | Global View Capital Management LLC | 0 | -100,00 | 0 | |||||
| 2026-01-28 | 13F | Serenus Wealth Advisors, LLC | 96.392 | 0,00 | 96 | 0,00 | ||||
| 2026-02-10 | 13F | Marshall & Sterling Wealth Advisors Inc. | 832 | -0,12 | 123 | -15,86 | ||||
| 2026-01-20 | 13F | Signaturefd, Llc | 37 | 0,00 | 5 | -16,67 | ||||
| 2026-02-09 | 13F | Prospera Financial Services Inc | 13.700 | -1,99 | 2.025 | -17,01 | ||||
| 2026-02-17 | 13F | Fmr Llc | 36 | 5 | ||||||
| 2025-11-12 | 13F | Headlands Technologies LLC | 0 | -100,00 | 0 | |||||
| 2026-02-05 | 13F | Pacific Sun Financial Corp | 6.582 | -5,32 | 972 | -19,87 | ||||
| 2026-02-10 | 13F | Ritter Daniher Financial Advisory LLC / DE | 81 | 12 | ||||||
| 2026-02-17 | 13F | SageView Advisory Group, LLC | 1.076 | 159 | ||||||
| 2026-02-17 | 13F | Fairscale Capital, LLC | 2.055 | 0,00 | 304 | -15,36 | ||||
| 2025-09-26 | 13F | Capital A Wealth Management, LLC | 423 | -84,77 | 32 | -87,79 | ||||
| 2026-01-23 | 13F | Avion Wealth | 347 | -4,14 | 0 | |||||
| 2026-01-26 | 13F | Nations Financial Group Inc, /ia/ /adv | 5.986 | -10,07 | 884 | -23,92 | ||||
| 2026-02-17 | 13F | Qube Research & Technologies Ltd | 22.575 | -43,35 | 3.335 | -52,06 | ||||
| 2026-02-12 | 13F | Rossby Financial, LCC | 142 | 0,00 | 21 | -16,67 | ||||
| 2026-02-03 | 13F | International Assets Investment Management, Llc | 0 | -100,00 | 0 | |||||
| 2026-02-12 | 13F | Principal Securities, Inc. | 0 | -100,00 | 0 | |||||
| 2026-01-21 | 13F/A | Winthrop Advisory Group LLC | 0 | -100,00 | 0 | |||||
| 2026-02-11 | 13F | Nemes Rush Group LLC | 100 | 0,00 | 15 | -17,65 | ||||
| 2026-01-29 | 13F | Concurrent Investment Advisors, LLC | 2.315 | 342 | ||||||
| 2026-02-17 | 13F | Gladstone Institutional Advisory LLC | 2.692 | 16,84 | 398 | -1,24 | ||||
| 2026-01-22 | 13F | Kennebec Savings Bank | 0 | -100,00 | 0 | |||||
| 2026-02-13 | 13F | Mariner, LLC | 21.394 | 5,19 | 3.160 | -11,01 | ||||
| 2025-09-26 | NP | Two Roads Shared Trust - Anfield U.S. Equity Sector Rotation ETF | 91.626 | 0,65 | 14.474 | 54,50 | ||||
| 2026-02-12 | 13F | Colonial Trust Advisors | 113 | 0,00 | 17 | -15,79 | ||||
| 2026-02-13 | 13F | Integrated Wealth Concepts LLC | 0 | -100,00 | 0 | |||||
| 2026-02-05 | 13F | Bessemer Group Inc | 7 | 0,00 | 0 | |||||
| 2025-10-21 | 13F | Optimum Investment Advisors | 15 | 0,00 | 3 | 0,00 | ||||
| 2026-02-14 | 13F | Rockefeller Capital Management L.P. | 2.077 | -12,80 | 307 | -26,27 | ||||
| 2026-02-17 | 13F | Captrust Financial Advisors | 2.988 | 1,49 | 441 | -14,20 | ||||
| 2025-11-04 | 13F | Thrivent Financial For Lutherans | 0 | -100,00 | 0 | |||||
| 2026-01-20 | 13F | Savvy Advisors, Inc. | 1.557 | 7,98 | 230 | -8,76 | ||||
| 2026-02-13 | 13F | Colony Group, LLC | 1.862 | 275 | ||||||
| 2026-01-23 | 13F | Farther Finance Advisors, LLC | 209 | 0,00 | 31 | -16,67 | ||||
| 2026-01-14 | 13F | Spire Wealth Management | 180 | 0,00 | 27 | -16,13 | ||||
| 2026-02-19 | 13F | Mcguire Capital Advisors Inc | 49 | 7 | ||||||
| 2026-01-29 | 13F | Concord Wealth Partners | 21 | 0,00 | 3 | 0,00 | ||||
| 2026-01-29 | 13F | UBS Group AG | 11.014 | -89,77 | 1.627 | -91,35 | ||||
| 2026-02-13 | 13F | Kestra Advisory Services, LLC | 0 | -100,00 | 0 | |||||
| 2026-02-06 | 13F | Global Retirement Partners, LLC | 514 | -0,19 | 76 | -15,73 | ||||
| 2026-02-13 | 13F | Blueshift Asset Management, LLC | 1.975 | 292 | ||||||
| 2026-01-20 | 13F | Stratos Wealth Partners, LTD. | 20.794 | -16,87 | 3.072 | -29,68 | ||||
| 2026-01-09 | 13F | Dynamic Advisor Solutions LLC | 1.730 | 0,00 | 256 | -15,56 | ||||
| 2026-01-27 | 13F | Purus Wealth Management, LLC | 12.637 | -3,61 | 1.867 | -18,48 | ||||
| 2026-02-10 | 13F | Foundations Investment Advisors, LLC | 537.572 | 200,95 | 79.416 | 154,63 | ||||
| 2026-01-27 | 13F | Financial Management Professionals, Inc. | 11.648 | -0,18 | 1.721 | -15,56 | ||||
| 2026-02-13 | 13F | Centaurus Financial, Inc. | 872 | -84,09 | 0 | |||||
| 2026-02-09 | 13F | Huntington National Bank | 20 | -13,04 | ||||||
| 2026-01-27 | 13F | TD Waterhouse Canada Inc. | 219 | -16,09 | 32 | -28,89 | ||||
| 2026-02-12 | 13F | Wealthspire Advisors, LLC | 1.720 | 0,35 | 254 | -15,05 | ||||
| 2026-01-20 | 13F | Global Trust Asset Management, LLC | 120 | -86,13 | 18 | -88,74 | ||||
| 2026-02-05 | 13F | Allworth Financial LP | 4.266 | -4,80 | 630 | -19,44 | ||||
| 2026-02-13 | 13F | Safeguard Investment Advisory Group, LLC | 0 | -100,00 | 0 | |||||
| 2026-02-13 | 13F | Ieq Capital, Llc | 0 | -100,00 | 0 | |||||
| 2026-02-02 | 13F | Mutual Advisors, LLC | 23.500 | 0,76 | 3.472 | -13,89 | ||||
| 2026-02-03 | 13F | Mma Asset Management Llc | 0 | -100,00 | 0 | |||||
| 2026-01-13 | 13F | CoreCap Advisors, LLC | 14.399 | -34,62 | 2.127 | -44,68 | ||||
| 2026-01-30 | 13F | Activest Wealth Management | 74 | 1,37 | 11 | -16,67 | ||||
| 2025-11-04 | 13F | Strategy Asset Managers Llc | 0 | -100,00 | 0 | |||||
| 2026-01-20 | 13F | AdvisorNet Financial, Inc | 35.067 | 34,13 | 5.180 | 13,47 | ||||
| 2026-02-05 | 13F | Western Wealth Management, LLC | 6.671 | 0,01 | 986 | -15,38 | ||||
| 2026-02-18 | 13F | EP Wealth Advisors, Inc. | 2.529 | 374 | ||||||
| 2026-02-09 | 13F | Harbour Investments, Inc. | 230 | 29,21 | 34 | 6,45 | ||||
| 2026-02-12 | 13F | Scotia Capital Inc. | 2.227 | 0,00 | 329 | -15,46 | ||||
| 2026-02-13 | 13F | Morgan Stanley | 780.087 | -0,43 | 115.242 | -15,76 | ||||
| 2026-01-28 | 13F | Financial Perspectives, Inc | 1.048 | -4,99 | 155 | -19,79 | ||||
| 2026-02-10 | 13F | Murphy & Mullick Capital Management Corp | 10 | 0,00 | 1 | 0,00 | ||||
| 2026-01-12 | 13F | Abound Wealth Management | 373 | 603,77 | 55 | 511,11 | ||||
| 2026-01-20 | 13F | Wall Street Access Asset Management, LLC | 7 | 0,00 | 1 | 0,00 | ||||
| 2026-02-09 | 13F | Keating Financial Advisory Services, Inc. | 10.123 | 1.495 | ||||||
| 2026-02-10 | 13F | Bnp Paribas Arbitrage, Sa | 20.750 | 72,87 | 3.065 | 46,30 | ||||
| 2025-11-14 | 13F | Wood Tarver Financial Group, LLC | 0 | -100,00 | 0 | |||||
| 2026-01-30 | 13F | Exencial Wealth Advisors, Llc | 0 | -100,00 | 0 | |||||
| 2026-01-15 | 13F | Victory Financial Group, Llc | 18.988 | 14,28 | 2.805 | -3,24 | ||||
| 2026-02-12 | 13F | Front Row Advisors LLC | 12 | 0,00 | 2 | -50,00 | ||||
| 2026-02-17 | 13F | Wealth Watch Advisors, INC | 1.106 | 302,18 | 163 | 239,58 | ||||
| 2026-01-29 | 13F | UMA Financial Services, Inc. | 129 | 0,00 | 19 | -13,64 | ||||
| 2026-02-11 | 13F | LPL Financial LLC | 295.571 | -8,46 | 43.665 | -22,55 | ||||
| 2026-02-12 | 13F | Hm Payson & Co | 135 | 0,00 | 20 | -17,39 | ||||
| 2026-02-17 | 13F | EFG International AG | 125 | 18 | ||||||
| 2026-02-13 | 13F | Mml Investors Services, Llc | 19.439 | 7,20 | 2.872 | -9,32 | ||||
| 2026-02-04 | 13F | Pensionmark Financial Group, Llc | 2.403 | 1,39 | 348 | -15,74 | ||||
| 2026-02-06 | 13F | GPS Wealth Strategies Group, LLC | 0 | -100,00 | 0 | |||||
| 2025-10-30 | 13F | Ridgewood Investments LLC | 0 | -100,00 | 0 | |||||
| 2026-02-10 | 13F | Calton & Associates, Inc. | 1.701 | -7,45 | 251 | -21,56 | ||||
| 2026-01-14 | 13F | Tradewinds Capital Management, LLC | 13 | 0,00 | 2 | -50,00 | ||||
| 2026-02-12 | 13F | Commonwealth Equity Services, Llc | 72.996 | 0,67 | 10.784 | 89.758,33 | ||||
| 2026-01-12 | 13F | Roble, Belko & Company, Inc | 10 | 0,00 | 0 | |||||
| 2026-01-16 | 13F | West Branch Capital LLC | 0 | -100,00 | 0 | -100,00 | ||||
| 2026-02-05 | 13F | Stephens Inc /ar/ | 3.000 | 0,00 | 443 | -15,30 | ||||
| 2026-02-17 | 13F | Bank Of America Corp /de/ | 355.365 | 10,62 | 52.498 | -6,41 | ||||
| 2026-01-29 | 13F | Kestra Private Wealth Services, Llc | 7.480 | 113,47 | 1.105 | 80,85 | ||||
| 2026-01-06 | 13F | Eagle Wealth Strategies Llc | 1.904 | 1,55 | 281 | -14,07 | ||||
| 2025-11-12 | 13F | Ameriflex Group, Inc. | 0 | -100,00 | 0 | |||||
| 2025-11-17 | 13F | Avondale Wealth Management | 0 | -100,00 | 0 | |||||
| 2026-02-09 | 13F | Integrity Alliance, Llc. | 5.078 | 2,40 | 750 | -13,29 | ||||
| 2026-02-17 | 13F | Equitable Holdings, Inc. | 0 | -100,00 | 0 | |||||
| 2026-02-10 | 13F | Verus Capital Partners, Llc | 1.535 | -31,47 | 227 | -42,20 | ||||
| 2026-02-13 | 13F | Umb Bank N A/mo | 593 | 0,00 | 88 | -15,53 | ||||
| 2026-02-10 | 13F | IAG Wealth Partners, LLC | 445 | -19,38 | 66 | -32,29 | ||||
| 2026-02-17 | 13F | Ameriprise Financial Inc | 4.101 | 606 | ||||||
| 2026-02-13 | 13F | Safe Harbor Wealth Advisors, LLC | 3.276 | 396 | ||||||
| 2026-02-05 | 13F | Tucker Asset Management Llc | 134 | 20 | ||||||
| 2026-02-10 | 13F | KERR FINANCIAL PLANNING Corp | 250 | 1,21 | 30 | -21,62 | ||||
| 2025-11-12 | 13F | Kingsview Wealth Management, LLC | 0 | -100,00 | 0 | |||||
| 2026-01-13 | 13F | Capital Investment Advisors, LLC | 1.359 | 4,30 | 201 | -11,89 | ||||
| 2026-02-13 | 13F | Gts Securities Llc | 23.067 | 9,54 | 3.408 | -7,32 | ||||
| 2026-02-10 | 13F | Root Financial Partners, LLC | 195 | -34,34 | 29 | -45,10 | ||||
| 2025-10-07 | 13F | EWG Elevate Inc. | 64.319 | 11.231 | ||||||
| 2026-01-15 | 13F | Brookstone Capital Management | 26.760 | 0,41 | 3.953 | -15,04 | ||||
| 2026-02-06 | 13F | Larson Financial Group LLC | 31 | 0,00 | 5 | -20,00 | ||||
| 2026-02-13 | 13F | Wells Fargo & Company/mn | 620 | 28,90 | 92 | 8,33 | ||||
| 2026-01-09 | 13F | First Heartland Consultants, Inc. | 2.185 | -3,02 | 323 | -18,07 | ||||
| 2026-01-09 | 13F | SG Americas Securities, LLC | 3.441 | 1 | ||||||
| 2026-02-10 | 13F | Belvedere Trading LLC | Call | 12.300 | 1.817 | |||||
| 2026-01-05 | 13F | Park Avenue Securities Llc | 0 | -100,00 | 0 | |||||
| 2026-02-04 | 13F | Ameritas Advisory Services, LLC | 7.464 | 2.196,62 | 1.103 | 1.867,86 | ||||
| 2026-02-13 | 13F | SRS Capital Advisors, Inc. | 162 | 0,62 | 24 | -17,86 | ||||
| 2026-02-11 | 13F | J.w. Cole Advisors, Inc. | 4.041 | 0,85 | 597 | -14,59 | ||||
| 2026-02-09 | 13F | Atlantic Trust, LLC | 4.016 | 0,45 | 593 | -15,04 | ||||
| 2026-02-12 | 13F | JPL Wealth Management, LLC | 0 | -100,00 | 0 | |||||
| 2026-02-17 | 13F | Tower Research Capital LLC (TRC) | 0 | -100,00 | 0 | |||||
| 2026-01-26 | 13F | Private Trust Co Na | 100 | 0,00 | 15 | -17,65 | ||||
| 2026-02-11 | 13F | Hilton Head Capital Partners, LLC | 95 | 14 | ||||||
| 2025-11-14 | 13F | Walleye Trading LLC | Put | 0 | -100,00 | 0 | -100,00 | |||
| 2025-10-02 | 13F | Caldwell Trust Co | 0 | -100,00 | 0 | -100,00 |