Grundlæggende statistik
| Institutionelle ejere | 115 total, 115 long only, 0 short only, 0 long/short - change of -2,54% MRQ |
| Gennemsnitlig porteføljeallokering | 0.0731 % - change of 1,67% MRQ |
| Institutionelle aktier (lange) | 856.515 (ex 13D/G) - change of -0,08MM shares -8,99% MRQ |
| Institutionel værdi (lang) | $ 96.687 USD ($1000) |
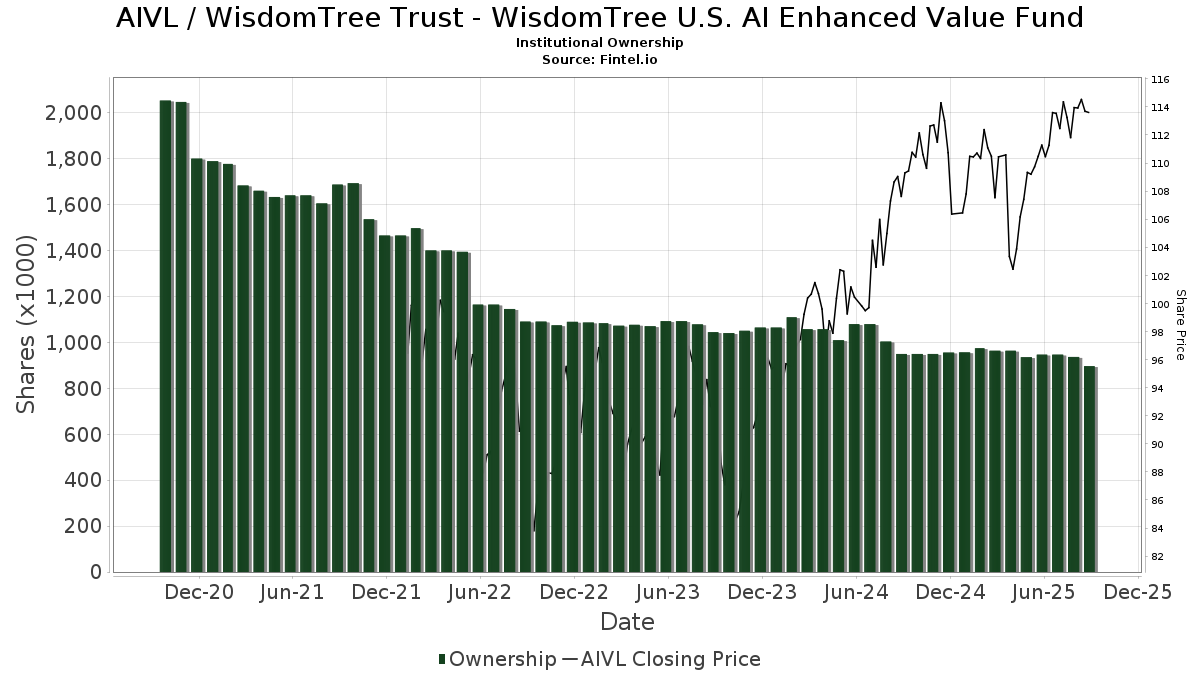
Institutionelt ejerskab og aktionærer
WisdomTree Trust - WisdomTree U.S. AI Enhanced Value Fund (US:AIVL) har 115 institutionelle ejere og aktionærer, der har indsendt 13D/G- eller 13F-formularer til Securities Exchange Commission (SEC). Disse institutioner har i alt 856,515 aktier. Største aktionærer omfatter Jaffetilchin Investment Partners, LLC, Noble Family Wealth, LLC, Morgan Stanley, LPL Financial LLC, Royal Bank Of Canada, Advisor Group Holdings, Inc., Commonwealth Equity Services, Llc, Salomon & Ludwin, LLC, Founders Grove Wealth Partners, Llc, and Wealthbridge Capital Management, Llc .
WisdomTree Trust - WisdomTree U.S. AI Enhanced Value Fund (ARCA:AIVL) institutionel ejerskabsstruktur viser aktuelle positioner i virksomheden efter institutioner og fonde, samt seneste ændringer i positionsstørrelse. Større aktionærer kan omfatte individuelle investorer, investeringsforeninger, hedgefonde eller institutioner. Skema 13D angiver, at investoren besidder (eller besidder) mere end 5 % af virksomheden og har til hensigt (eller har til hensigt at) aktivt at forfølge en ændring i forretningsstrategi. Skema 13G indikerer en passiv investering på over 5%.
The share price as of March 6, 2026 is 119,02 / share. Previously, on March 10, 2025, the share price was 109,00 / share. This represents an increase of 9,19% over that period.
Fondens stemningsscore
Fund Sentiment Score (fka Ownership Accumulation Score) finder de aktier, der bliver mest købt af fonde. Det er resultatet af en sofistikeret, multi-faktor kvantitativ model, der identificerer virksomheder med de højeste niveauer af institutionel akkumulering. Scoringsmodellen bruger en kombination af den samlede stigning i oplyste ejere, ændringerne i porteføljeallokeringer i disse ejere og andre målinger. Tallet går fra 0 til 100, hvor højere tal indikerer et højere niveau af akkumulering for sine jævnaldrende, og 50 er gennemsnittet.
Opdateringsfrekvens: Dagligt
Se Ownership Explorer, som giver en liste over højest rangerende virksomheder.
AI+ Ask Fintel’s AI assistant about WisdomTree Trust - WisdomTree U.S. AI Enhanced Value Fund.
Select a question to share a public post with an AI-crafted answer.
Thinking of good questions…
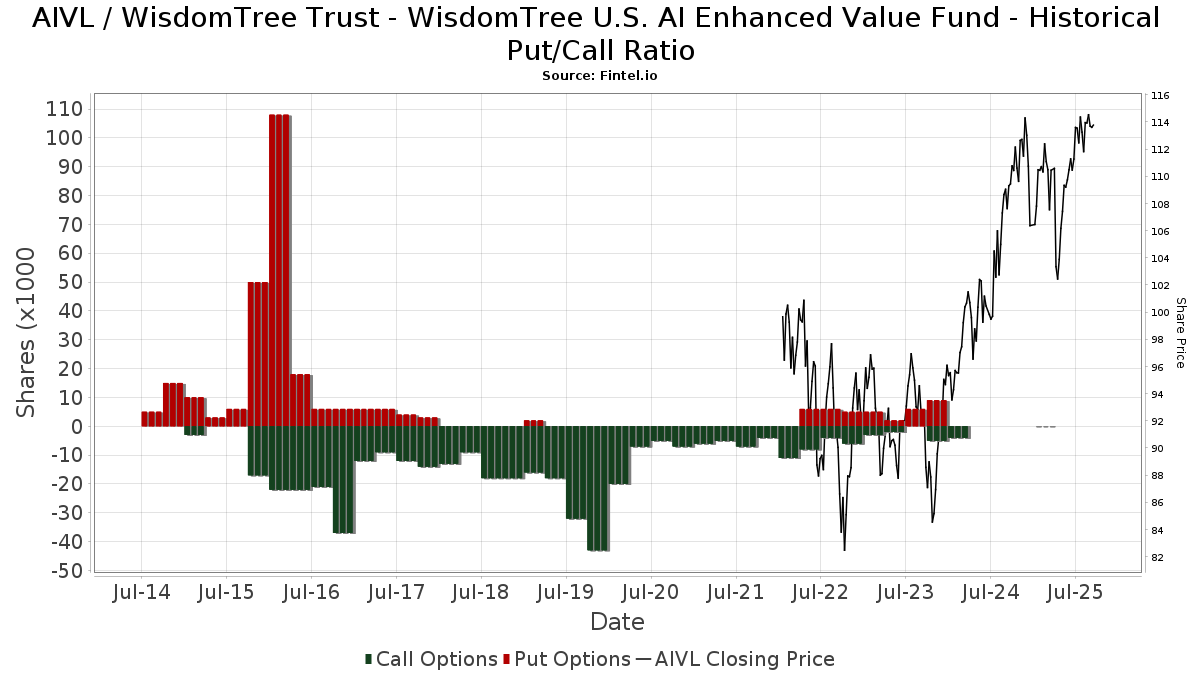
Institutionel Put/Call-forhold
Ud over at indberette standardaktie- og gældsudstedelser skal institutter med mere end 100 mill. aktiver under forvaltning også oplyse deres put- og call-optionsbeholdninger. Da salgsoptioner generelt indikerer negativ stemning, og købsoptioner indikerer positiv stemning, kan vi få en fornemmelse af den overordnede institutionelle stemning ved at plotte forholdet mellem put og kald. Diagrammet til højre viser det historiske put/call-forhold for dette instrument.
Brug af Put/Call Ratio som en indikator for investorernes stemning overvinder en af de vigtigste mangler ved at bruge totalt institutionelt ejerskab, som er, at en betydelig mængde af aktiver under forvaltning investeres passivt for at spore indekser. Passivt forvaltede fonde køber typisk ikke optioner, så indikatoren for put/call-forholdet følger mere nøje følelsen af aktivt forvaltede fonde.
13F og NPORT arkivering
Detaljer om 13F-arkivering er gratis. Detaljer om NP-ansøgninger kræver et premium-medlemskab. Grønne rækker angiver nye positioner. Røde rækker angiver lukkede positioner. Klik på linket ikon for at se den fulde transaktionshistorik.
Opgrader
for at låse premium-data op og eksportere til Excel ![]() .
.
| Fil dato | Kilde | Investor | Type | Gennemsnitlig pris (Øst) |
Aktier | Δ Aktier (%) |
Rapporteret Værdi ($1000) |
Δ Værdi (%) |
Port Alloc (%) |
|
|---|---|---|---|---|---|---|---|---|---|---|
| 2026-01-27 | 13F | Institute for Wealth Management, LLC. | 6.936 | -4,15 | 798 | -3,51 | ||||
| 2026-02-06 | 13F | McKinley Carter Wealth Services, Inc. | 2.688 | 0,00 | 309 | 0,65 | ||||
| 2025-11-14 | 13F | Mount Yale Investment Advisors, LLC | 0 | -100,00 | 0 | -100,00 | ||||
| 2026-02-26 | 13F | Anchor Investment Management, LLC | 353 | 0,57 | 41 | 0,00 | ||||
| 2026-02-11 | 13F | Jpmorgan Chase & Co | 490 | -20,97 | 56 | -20,00 | ||||
| 2025-10-24 | 13F | ORG Partners LLC | 0 | -100,00 | 0 | -100,00 | ||||
| 2026-02-05 | 13F | 1620 Investment Advisors, Inc. | 385 | -10,47 | 44 | -10,20 | ||||
| 2026-02-06 | 13F | Global Retirement Partners, LLC | 12.118 | 0,00 | 1.393 | 0,65 | ||||
| 2026-02-12 | 13F | Founders Financial Alliance, LLC | 0 | -100,00 | 0 | |||||
| 2026-02-09 | 13F | Hartland & Co., LLC | 973 | 0,00 | 112 | 0,00 | ||||
| 2026-01-12 | 13F | Sax Wealth Advisors, Llc | 2.057 | 0,00 | 237 | 0,43 | ||||
| 2026-02-10 | 13F | Ritter Daniher Financial Advisory LLC / DE | 305 | 35 | ||||||
| 2026-02-17 | 13F | Fmr Llc | 664 | 10,30 | 76 | 11,76 | ||||
| 2026-02-17 | 13F | Creative Planning | 3.507 | 0,00 | 403 | 0,75 | ||||
| 2026-02-17 | 13F | Cahill Financial Advisors Inc | 3.822 | 0,37 | 439 | 0,92 | ||||
| 2026-02-02 | 13F | Fifth Third Bancorp | 0 | -100,00 | 0 | |||||
| 2026-01-28 | 13F | Salomon & Ludwin, LLC | 25.498 | -1,00 | 2.967 | 0,03 | ||||
| 2026-02-11 | 13F | Hughes Financial Services, LLC | 253 | 0,00 | 29 | 3,57 | ||||
| 2026-02-17 | 13F | Tower Research Capital LLC (TRC) | 0 | -100,00 | 0 | |||||
| 2026-02-11 | 13F | Franklin Resources Inc | 740 | 0,00 | 85 | 1,19 | ||||
| 2026-01-15 | 13F | Arcadia Investment Advisors Llc | 643 | 0,00 | 74 | 0,00 | ||||
| 2026-02-03 | 13F | Emerald Investment Partners, Llc | 58 | 0,00 | 7 | 0,00 | ||||
| 2026-01-14 | 13F | Spire Wealth Management | 2.647 | -36,69 | 304 | -36,27 | ||||
| 2026-01-21 | 13F | Capital Investment Advisory Services, LLC | 180 | 0,00 | 21 | 0,00 | ||||
| 2026-02-06 | 13F | HighTower Advisors, LLC | 2.472 | 0,08 | 284 | 0,71 | ||||
| 2026-01-26 | 13F | Cwm, Llc | 2.550 | 0,00 | 0 | |||||
| 2026-02-13 | 13F | MAI Capital Management | 16.353 | -0,53 | 1.880 | 0,11 | ||||
| 2026-01-22 | 13F | Apollon Wealth Management, LLC | 14.176 | -1,13 | 1.630 | -0,55 | ||||
| 2026-01-16 | 13F | Augustine Asset Management Inc | 1.987 | 0,00 | 228 | 0,44 | ||||
| 2026-01-21 | 13F | Albion Financial Group /ut | 325 | -14,47 | 37 | -13,95 | ||||
| 2026-01-27 | 13F | Brighton Jones Llc | 0 | -100,00 | 0 | |||||
| 2026-01-26 | 13F | JNBA Financial Advisors | 295 | 0,00 | 34 | 0,00 | ||||
| 2026-02-19 | 13F/A | Axxcess Wealth Management, Llc | 1.763 | 203 | ||||||
| 2026-02-17 | 13F | Susquehanna International Group, Llp | 4.221 | 485 | ||||||
| 2026-02-13 | 13F | Morgan Stanley | 79.464 | -1,25 | 9.137 | -0,64 | ||||
| 2026-02-11 | 13F | O'shaughnessy Asset Management, Llc | 8.063 | 9,37 | 927 | 10,10 | ||||
| 2026-01-28 | 13F | Glassman Wealth Services | 357 | 0,00 | 41 | 2,50 | ||||
| 2025-11-04 | 13F | Flaharty Asset Management, LLC | 0 | -100,00 | 0 | -100,00 | ||||
| 2026-01-21 | 13F | Wealthbridge Capital Management, Llc | 21.082 | -0,08 | 2.424 | 0,50 | ||||
| 2026-02-13 | 13F | Avant Capital LLC | 2.026 | -3,52 | 233 | -3,33 | ||||
| 2026-02-14 | 13F | POM Investment Strategies, LLC | 340 | 0,00 | 39 | 2,63 | ||||
| 2025-11-12 | 13F | CIBC Bancorp USA Inc. | 3.765 | 430 | ||||||
| 2026-01-21 | 13F | Perfromance Wealth Partners, LLC | 3.747 | -1,13 | 431 | -0,69 | ||||
| 2026-01-26 | 13F | AE Wealth Management LLC | 36 | 4 | ||||||
| 2026-01-28 | 13F | Nadler Financial Group, Inc. | 4.055 | -20,96 | 466 | -20,48 | ||||
| 2026-02-17 | 13F | Raymond James Financial Inc | 20.276 | -1,22 | 2.331 | -0,60 | ||||
| 2026-02-14 | 13F | Rockefeller Capital Management L.P. | 816 | 0,00 | 94 | 0,00 | ||||
| 2026-01-16 | 13F | Perigon Wealth Management, LLC | 5.536 | 0,05 | 636 | 0,63 | ||||
| 2026-02-04 | 13F | Ameritas Advisory Services, LLC | 0 | -100,00 | 0 | |||||
| 2026-02-03 | 13F | RWM Asset Management, LLC | 6.120 | 0,00 | 735 | 5,01 | ||||
| 2025-10-16 | 13F | Lowe Wealth Advisors, LLC | 591 | 0,00 | 68 | 1,52 | ||||
| 2026-02-09 | 13F | Prospera Financial Services Inc | 10.980 | -5,25 | 1.263 | -4,68 | ||||
| 2026-02-13 | 13F | Mariner, LLC | 4.242 | 0,05 | 488 | 0,62 | ||||
| 2025-11-07 | 13F | Atticus Wealth Management, Llc | 0 | -100,00 | 0 | -100,00 | ||||
| 2025-11-14 | 13F | Wood Tarver Financial Group, LLC | 0 | -100,00 | 0 | |||||
| 2026-01-09 | 13F | Graves-Light Private Wealth Management, Inc. | 3.407 | 0,00 | 392 | 0,51 | ||||
| 2026-01-07 | 13F | Pps&v Asset Management Consultants, Inc. | 4.085 | 0,00 | 470 | 0,64 | ||||
| 2026-02-13 | 13F | Cladis Investment Advisory, LLC | 2.000 | 0,00 | 230 | 0,44 | ||||
| 2026-02-17 | 13F | Holt Capital Advisors, L.L.C. dba Holt Capital Partners, L.P. | 13.400 | 83,56 | 1.541 | 84,65 | ||||
| 2026-01-13 | 13F | Well Done, LLC | 13.125 | -1,57 | 1.509 | -0,92 | ||||
| 2026-02-17 | 13F | Bank Of America Corp /de/ | 333 | 38 | ||||||
| 2026-02-17 | 13F | Jones Financial Companies Lllp | 828 | 24,32 | 95 | 26,67 | ||||
| 2025-11-13 | 13F | Novus Advisors, Llc | 0 | -100,00 | 0 | -100,00 | ||||
| 2026-02-09 | 13F | MTM Investment Management, LLC | 50 | 0,00 | 6 | 0,00 | ||||
| 2026-02-09 | 13F | Harbour Investments, Inc. | 1.170 | 0,00 | 135 | 0,75 | ||||
| 2026-01-29 | 13F | UBS Group AG | 1.525 | -65,03 | 175 | -64,86 | ||||
| 2026-02-17 | 13F | Royal Bank Of Canada | 35.769 | -9,31 | 4.113 | -8,74 | ||||
| 2025-11-05 | 13F | Altrius Capital Management Inc | 0 | -100,00 | 0 | |||||
| 2026-02-12 | 13F | CIBC Private Wealth Group, LLC | 1.365 | 0,00 | 157 | 0,65 | ||||
| 2026-01-12 | 13F | Founders Grove Wealth Partners, Llc | 24.579 | -0,64 | 2.826 | 0,00 | ||||
| 2026-02-05 | 13F | Sequent Planning LLC | 0 | -100,00 | 0 | |||||
| 2026-01-20 | 13F | Signaturefd, Llc | 0 | -100,00 | 0 | |||||
| 2026-02-17 | 13F | Advisor Group Holdings, Inc. | 30.925 | 0,47 | 3.556 | 1,05 | ||||
| 2026-01-23 | 13F | Bellevue Asset Management, Llc | 1.270 | -7,16 | 146 | -6,41 | ||||
| 2026-02-13 | 13F | Kestra Advisory Services, LLC | 0 | -100,00 | 0 | |||||
| 2026-02-17 | 13F | Captrust Financial Advisors | 13.198 | 0,00 | 1.517 | 0,60 | ||||
| 2026-01-28 | 13F | Quaker Wealth Management, LLC | 226 | 0,00 | 26 | 0,00 | ||||
| 2026-02-09 | 13F | Lgl Partners, Llc | 2.928 | 0,48 | 337 | 0,90 | ||||
| 2026-02-17 | 13F | Mercer Global Advisors Inc /adv | 5.736 | -0,57 | 660 | 0,00 | ||||
| 2026-01-23 | 13F | Steigerwald, Gordon & Koch Inc. | 1.671 | 0,00 | 192 | 0,52 | ||||
| 2026-01-07 | 13F | Noble Family Wealth, LLC | 88.825 | -0,24 | 10.213 | 0,37 | ||||
| 2026-02-13 | 13F | Wells Fargo & Company/mn | 10.361 | 1,57 | 1.191 | 2,23 | ||||
| 2026-01-26 | 13F | Kelman-Lazarov, Inc. | 6.420 | -0,19 | 738 | 0,41 | ||||
| 2026-02-17 | 13F | RMB Capital Management, LLC | 12.143 | 0,00 | 1.396 | 0,65 | ||||
| 2026-02-18 | 13F | GWM Advisors LLC | 4.828 | -20,17 | 555 | -19,68 | ||||
| 2026-01-16 | 13F | Bouchey Financial Group Ltd | 2.840 | 0,00 | 327 | 0,62 | ||||
| 2026-01-16 | 13F | Trust Co Of Vermont | 2.300 | 0,00 | 264 | 0,76 | ||||
| 2026-02-12 | 13F | Commonwealth Equity Services, Llc | 25.741 | -15,84 | 2.960 | 98.533,33 | ||||
| 2026-01-23 | 13F | Webster Bank, N. A. | 3.030 | 0,00 | 348 | 0,58 | ||||
| 2026-02-11 | 13F | Cerity Partners LLC | 7.974 | 3,29 | 917 | 3,85 | ||||
| 2026-02-12 | 13F | Steward Partners Investment Advisory, Llc | 324 | 0,00 | 37 | 0,00 | ||||
| 2026-02-19 | 13F | CI Private Wealth, LLC | 2.256 | 260 | ||||||
| 2026-02-05 | 13F | Cambridge Investment Research Advisors, Inc. | 5.622 | -0,46 | 1 | |||||
| 2026-02-17 | 13F | VestGen Advisors, LLC | 0 | -100,00 | 0 | |||||
| 2026-02-09 | 13F | Key FInancial Inc | 1.838 | 0,05 | 211 | 0,48 | ||||
| 2025-11-17 | 13F | Pin Oak Investment Advisors Inc | 0 | -100,00 | 0 | |||||
| 2026-02-10 | 13F/A | Northwestern Mutual Wealth Management Co | 87 | 0,00 | 10 | 11,11 | ||||
| 2026-02-12 | 13F | Bank Of Montreal /can/ | 622 | -6,04 | 72 | -5,33 | ||||
| 2026-02-17 | 13F | Blair William & Co/il | 2.103 | 0,00 | 242 | 0,42 | ||||
| 2026-02-09 | 13F | Robinson Smith Wealth Advisors Llc | 7.623 | 0,00 | 876 | 0,57 | ||||
| 2026-01-20 | 13F | Independence Bank of Kentucky | 625 | 0,00 | 72 | 0,00 | ||||
| 2026-02-05 | 13F | Fingerlakes Wealth Management, Inc. | 2.507 | 0,48 | 288 | 1,05 | ||||
| 2026-02-13 | 13F | Baird Financial Group, Inc. | 6.247 | 0,00 | 718 | 0,70 | ||||
| 2026-02-05 | 13F | Allworth Financial LP | 288 | 0,00 | 33 | 3,13 | ||||
| 2026-02-13 | 13F | Mlp3, Llc | 3.762 | 433 | ||||||
| 2026-01-28 | 13F | Amarillo National Bank | 7.031 | 0,00 | 808 | 0,62 | ||||
| 2026-02-02 | 13F | Montag A & Associates Inc | 4.228 | 9,03 | 486 | 9,71 | ||||
| 2026-02-11 | 13F | SOUTH STATE Corp | 2.124 | 0,00 | 244 | 0,83 | ||||
| 2026-02-13 | 13F | Glen Eagle Advisors, LLC | 64 | -75,76 | 7 | -76,67 | ||||
| 2026-02-04 | 13F | Dynamic Wealth Strategies, LLC | 117 | 0,00 | 13 | 0,00 | ||||
| 2026-02-11 | 13F | Tradition Wealth Management, LLC | 2.875 | 0,00 | 331 | 0,61 | ||||
| 2026-02-17 | 13F | Wiley Bros.-aintree Capital, Llc | 2.903 | 0,00 | 334 | 0,60 | ||||
| 2026-02-13 | 13F | Biondo Investment Advisors, LLC | 13.418 | 5,84 | 1.543 | 6,49 | ||||
| 2026-02-11 | 13F | Janney Montgomery Scott LLC | 7.528 | -34,03 | 1 | -100,00 | ||||
| 2026-02-13 | 13F | Stifel Financial Corp | 2.492 | -0,88 | 286 | -0,35 | ||||
| 2026-02-03 | 13F | International Assets Investment Management, Llc | 230 | 26 | ||||||
| 2026-01-23 | 13F | Westside Investment Management, Inc. | 350 | -98,32 | 40 | -98,32 | ||||
| 2026-02-17 | 13F | Evergreen Wealth Solutions, LLC | 2.739 | 315 | ||||||
| 2026-02-17 | 13F | Warren Averett Asset Management, LLC | 3.937 | -5,70 | 453 | -5,24 | ||||
| 2026-02-17 | 13F | Cetera Investment Advisers | 5.667 | 3,19 | 652 | 3,83 | ||||
| 2026-02-17 | 13F | Aqr Capital Management Llc | 4.459 | 0,00 | 513 | 0,59 | ||||
| 2026-02-17 | 13F | Rs Crum Inc. | 0 | -100,00 | 0 | |||||
| 2026-01-23 | 13F | Farther Finance Advisors, LLC | 1.111 | 128 | ||||||
| 2025-10-24 | 13F | Bristlecone Advisors, LLC | 0 | -100,00 | 0 | |||||
| 2026-01-21 | 13F | Mezzasalma Advisors, LLC | 2.358 | 0,43 | 272 | 1,12 | ||||
| 2026-02-17 | 13F | Aspen Grove Capital, LLC | 3.000 | 0,00 | 345 | 0,58 | ||||
| 2026-02-11 | 13F | LPL Financial LLC | 48.178 | 17,68 | 5.539 | 18,41 | ||||
| 2026-02-10 | 13F | Envestnet Asset Management Inc | 0 | -100,00 | 0 | |||||
| 2026-02-17 | 13F | Citadel Advisors Llc | 2.554 | -89,09 | 294 | -89,05 | ||||
| 2026-02-13 | 13F | Resources Investment Advisors, LLC. | 4.000 | 0,00 | 460 | 0,44 | ||||
| 2026-03-05 | 13F | Mengis Capital Management, Inc. | 1.795 | 0,00 | 206 | 0,49 | ||||
| 2026-01-30 | 13F | North Star Investment Management Corp. | 286 | 0,00 | 33 | 0,00 | ||||
| 2026-02-13 | 13F | Colony Group, LLC | 5.043 | -1,12 | 580 | -0,52 | ||||
| 2025-10-29 | 13F | Element Wealth, LLC | 0 | -100,00 | 0 | -100,00 | ||||
| 2026-01-15 | 13F | Jaffetilchin Investment Partners, LLC | 89.862 | 0,48 | 10.332 | 1,10 | ||||
| 2026-02-12 | 13F | Principal Securities, Inc. | 0 | -100,00 | 0 | |||||
| 2026-02-17 | 13F | Agf Management Ltd | 2.255 | 0,00 | 259 | 0,78 |