Grundlæggende statistik
| Institutionelle aktier (lange) | 21.156.896 - 69,08% (ex 13D/G) - change of -0,91MM shares -4,11% MRQ |
| Institutionel værdi (lang) | $ 423.490 USD ($1000) |
Institutionelt ejerskab og aktionærer
Aehr Test Systems, Inc. (US:AEHR) har 154 institutionelle ejere og aktionærer, der har indsendt 13D/G- eller 13F-formularer til Securities Exchange Commission (SEC). Disse institutioner har i alt 21,156,896 aktier. Største aktionærer omfatter Fmr Llc, Vanguard Group Inc, BlackRock, Inc., AWM Investment Company, Inc., Baillie Gifford & Co, Susquehanna International Group, Llp, Wellington Management Group Llp, Geode Capital Management, Llc, Halter Ferguson Financial Inc., and State Street Corp .
Aehr Test Systems, Inc. (NasdaqCM:AEHR) institutionel ejerskabsstruktur viser aktuelle positioner i virksomheden efter institutioner og fonde, samt seneste ændringer i positionsstørrelse. Større aktionærer kan omfatte individuelle investorer, investeringsforeninger, hedgefonde eller institutioner. Skema 13D angiver, at investoren besidder (eller besidder) mere end 5 % af virksomheden og har til hensigt (eller har til hensigt at) aktivt at forfølge en ændring i forretningsstrategi. Skema 13G indikerer en passiv investering på over 5%.
The share price as of April 2, 2026 is 44,32 / share. Previously, on April 4, 2025, the share price was 7,26 / share. This represents an increase of 510,47% over that period.

Fondens stemningsscore
Fund Sentiment Score (fka Ownership Accumulation Score) finder de aktier, der bliver mest købt af fonde. Det er resultatet af en sofistikeret, multi-faktor kvantitativ model, der identificerer virksomheder med de højeste niveauer af institutionel akkumulering. Scoringsmodellen bruger en kombination af den samlede stigning i oplyste ejere, ændringerne i porteføljeallokeringer i disse ejere og andre målinger. Tallet går fra 0 til 100, hvor højere tal indikerer et højere niveau af akkumulering for sine jævnaldrende, og 50 er gennemsnittet.
Opdateringsfrekvens: Dagligt
Se Ownership Explorer, som giver en liste over højest rangerende virksomheder.
AI+ Ask Fintel’s AI assistant about Aehr Test Systems, Inc..
Select a question to share a public post with an AI-crafted answer.
Thinking of good questions…
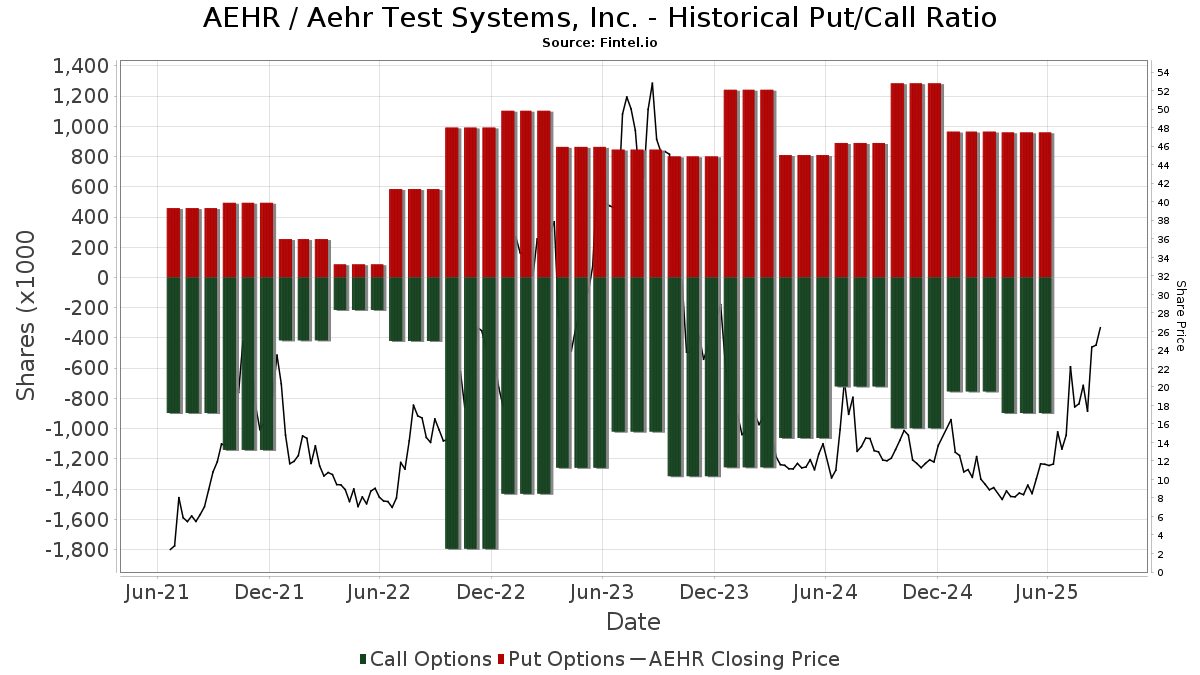
Institutionel Put/Call-forhold
Ud over at indberette standardaktie- og gældsudstedelser skal institutter med mere end 100 mill. aktiver under forvaltning også oplyse deres put- og call-optionsbeholdninger. Da salgsoptioner generelt indikerer negativ stemning, og købsoptioner indikerer positiv stemning, kan vi få en fornemmelse af den overordnede institutionelle stemning ved at plotte forholdet mellem put og kald. Diagrammet til højre viser det historiske put/call-forhold for dette instrument.
Brug af Put/Call Ratio som en indikator for investorernes stemning overvinder en af de vigtigste mangler ved at bruge totalt institutionelt ejerskab, som er, at en betydelig mængde af aktiver under forvaltning investeres passivt for at spore indekser. Passivt forvaltede fonde køber typisk ikke optioner, så indikatoren for put/call-forholdet følger mere nøje følelsen af aktivt forvaltede fonde.
13D/G-arkivering
Vi præsenterer 13D/G ansøgninger separat fra 13F ansøgninger på grund af den forskellige behandling af SEC. 13D/G-ansøgninger kan indgives af grupper af investorer (med én ledende), hvorimod 13F-ansøgninger ikke kan. Dette resulterer i situationer, hvor en investor kan indsende en 13D/G, der rapporterer én værdi for de samlede aktier (der repræsenterer alle de aktier, der ejes af investorgruppen), men derefter indsender en 13F, der rapporterer en anden værdi for de samlede aktier (der udelukkende repræsenterer deres egne) ejendomsret). Det betyder, at aktieejerskab af 13D/G-arkiver og 13F-arkiveringer ofte ikke er direkte sammenlignelige, så vi præsenterer dem separat.
Bemærk: Fra den 16. maj 2021 viser vi ikke længere ejere, der ikke har indsendt en 13D/G inden for det seneste år. Tidligere viste vi den fulde historie af 13D/G-arkiver. Generelt skal enheder, der er forpligtet til at indgive 13D/G-ansøgninger, indgive mindst årligt, før de indsender en afsluttende ansøgning. Dog forlader fonde nogle gange positioner uden at indsende en afsluttende ansøgning (dvs. de afvikler), så visning af den fulde historie resulterede nogle gange i forvirring om det nuværende ejerskab. For at undgå forvirring viser vi nu kun 'aktuelle' ejere - det vil sige - ejere, der har anmeldt inden for det seneste år.
Upgrade to unlock premium data.
| Fil dato | Form | Investor | Forrige Aktier |
Seneste Aktier |
Δ Aktier (Procent) |
Ejendomsret (Procent) |
Δ Ejerskab (Procent) |
|
|---|---|---|---|---|---|---|---|---|
| 2026-03-26 | VANGUARD GROUP INC | 2,138,760 | 0 | -100.00 | 0.00 | -100.00 | ||
| 2026-02-09 | BAILLIE GIFFORD & CO | 1,530,676 | 1,290,734 | -15.68 | 4.30 | -15.69 | ||
| 2025-11-05 | FMR LLC | 1,495,106 | 2,701,253 | 80.67 | 9.00 | 80.00 | ||
| 2025-05-07 | AWM Investment Company, Inc. | 1,328,713 | 1,587,936 | 19.51 | 5.30 | 10.42 |
13F og NPORT arkivering
Detaljer om 13F-arkivering er gratis. Detaljer om NP-ansøgninger kræver et premium-medlemskab. Grønne rækker angiver nye positioner. Røde rækker angiver lukkede positioner. Klik på linket ikon for at se den fulde transaktionshistorik.
Opgrader
for at låse premium-data op og eksportere til Excel ![]() .
.
| Fil dato | Kilde | Investor | Type | Gennemsnitlig pris (Øst) |
Aktier | Δ Aktier (%) |
Rapporteret Værdi ($1000) |
Δ Værdi (%) |
Port Alloc (%) |
|
|---|---|---|---|---|---|---|---|---|---|---|
| 2026-02-17 | 13F | CWM Advisors, LLC | 23.276 | 56,55 | 470 | 4,92 | ||||
| 2026-02-06 | 13F | Pnc Financial Services Group, Inc. | 1.043 | 21,99 | 21 | -16,00 | ||||
| 2026-02-09 | 13F | Quest Partners LLC | 3.220 | -26,63 | 65 | -50,76 | ||||
| 2026-02-17 | 13F | Sun Group Wealth Partners | 17.561 | 355 | ||||||
| 2026-01-20 | 13F | Signaturefd, Llc | 36 | 1 | ||||||
| 2026-02-13 | 13F | Rhumbline Advisers | 36.138 | -11,03 | 730 | -40,34 | ||||
| 2026-02-13 | 13F | Smartleaf Asset Management LLC | 58 | 1 | ||||||
| 2026-02-04 | 13F | Tsfg, Llc | 100 | 0,00 | 0 | |||||
| 2026-02-17 | 13F | Advisor Group Holdings, Inc. | 98.803 | 22,20 | 1.995 | -1,29 | ||||
| 2026-02-17 | 13F | Captrust Financial Advisors | 45.107 | 911 | ||||||
| 2026-02-12 | 13F | State Board Of Administration Of Florida Retirement System | 0 | -100,00 | 0 | |||||
| 2025-11-10 | 13F | Options Solutions, Llc | 0 | -100,00 | 0 | |||||
| 2026-01-27 | 13F | TD Waterhouse Canada Inc. | 1.250 | 0,00 | 25 | -39,02 | ||||
| 2025-11-03 | 13F | Hollencrest Capital Management | 0 | -100,00 | 0 | |||||
| 2026-02-10 | 13F | Goldman Sachs Group Inc | 176.042 | 52,33 | 3.554 | 2,16 | ||||
| 2026-02-17 | 13F | Balyasny Asset Management Llc | 24.775 | -14,52 | 500 | -42,66 | ||||
| 2026-02-09 | 13F | White Pine Capital Llc | 24.701 | -2,32 | 499 | -34,56 | ||||
| 2026-02-13 | 13F | Fortitude Advisory Group L.L.C. | 21.107 | -5,31 | 426 | -36,51 | ||||
| 2026-02-13 | 13F | Squarepoint Ops LLC | Put | 0 | -100,00 | 0 | -100,00 | |||
| 2026-02-12 | 13F | CIBC Private Wealth Group, LLC | 544 | 13.500,00 | 11 | |||||
| 2026-01-16 | 13F | FNY Investment Advisers, LLC | 0 | -100,00 | 0 | |||||
| 2026-02-13 | 13F | Walleye Capital LLC | Put | 6.700 | -90,58 | 135 | -93,69 | |||
| 2026-01-23 | 13F | Farther Finance Advisors, LLC | 966 | 12,98 | 20 | -24,00 | ||||
| 2026-02-12 | 13F | Wedbush Securities Inc | 0 | -100,00 | 0 | |||||
| 2026-02-12 | 13F | Nuveen, LLC | 69.133 | 4,89 | 1.396 | -29,69 | ||||
| 2026-02-13 | 13F | Walleye Capital LLC | 4.707 | 6,18 | 95 | -28,57 | ||||
| 2026-02-13 | 13F | Walleye Capital LLC | Call | 53.500 | -8,08 | 1.080 | -38,36 | |||
| 2026-02-23 | 13F | Virtu Financial LLC | 0 | -100,00 | 0 | -100,00 | ||||
| 2026-02-13 | 13F | Manufacturers Life Insurance Company, The | 0 | -100,00 | 0 | |||||
| 2025-11-14 | 13F | Cascades Capital Asset Management, LLC | 0 | -100,00 | 0 | |||||
| 2026-02-12 | 13F | Gould Capital, LLC | 1.000 | 0,00 | 20 | -33,33 | ||||
| 2026-02-17 | 13F | MIRAE ASSET GLOBAL ETFS HOLDINGS Ltd. | 13.260 | 1,30 | 268 | -32,23 | ||||
| 2025-11-14 | 13F | Lazard Asset Management Llc | 0 | -100,00 | 0 | |||||
| 2026-02-20 | 13F | Sunbelt Securities, Inc. | 650 | -27,78 | 13 | -51,85 | ||||
| 2026-01-27 | 13F | Zurcher Kantonalbank (Zurich Cantonalbank) | 8.920 | 180 | ||||||
| 2026-01-15 | 13F | Nisa Investment Advisors, Llc | 1.782 | 18,72 | 36 | -22,22 | ||||
| 2026-02-13 | 13F | Kestra Advisory Services, LLC | 0 | -100,00 | 0 | |||||
| 2026-02-17 | 13F | Wellington Management Group Llp | 830.664 | 129,93 | 16.771 | 54,19 | ||||
| 2026-02-17 | 13F | Millennium Management Llc | 59.219 | 0,84 | 1.196 | -32,41 | ||||
| 2026-02-17 | 13F | Harvest Investment Services, LLC | 24.909 | -7,99 | 503 | -38,40 | ||||
| 2025-11-14 | 13F | SWAN Capital LLC | 0 | -100,00 | 0 | |||||
| 2026-02-13 | 13F | BNP Paribas Asset Management Holding S.A. | 366 | 0 | ||||||
| 2026-02-13 | 13F | Sterling Capital Management LLC | 480 | 8,35 | 10 | -30,77 | ||||
| 2026-01-30 | 13F | Us Bancorp \de\ | 10 | 0 | ||||||
| 2026-02-13 | 13F | Next Century Growth Investors Llc | 552.506 | 99,93 | 11.155 | 34,07 | ||||
| 2026-02-17 | 13F | Russell Investments Group, Ltd. | 2.494 | 1,88 | 50 | -31,51 | ||||
| 2026-02-12 | 13F | New York State Common Retirement Fund | 47.050 | 89,78 | 950 | 27,21 | ||||
| 2025-11-14 | 13F | StoneX Group Inc. | 0 | -100,00 | 0 | -100,00 | ||||
| 2026-02-17 | 13F | Fmr Llc | 2.507.920 | -7,16 | 50.635 | -37,75 | ||||
| 2026-02-03 | 13F | Pier Capital, LLC | 211.619 | -42,95 | 4.273 | -61,75 | ||||
| 2026-02-13 | 13F | Essex Investment Management Co Llc | 0 | -100,00 | 0 | |||||
| 2026-02-13 | 13F | Integrated Wealth Concepts LLC | 0 | -100,00 | 0 | |||||
| 2026-02-13 | 13F | National Bank Of Canada /fi/ | 206.011 | -2,04 | 4.159 | -34,32 | ||||
| 2026-02-03 | 13F | Costello Asset Management, INC | 50 | 1 | ||||||
| 2026-02-17 | 13F | Tower Research Capital LLC (TRC) | 3.224 | 103,41 | 65 | 38,30 | ||||
| 2026-01-14 | 13F | ORG Partners LLC | 30 | 0,00 | 1 | |||||
| 2026-02-09 | 13F | William Blair Investment Management, Llc | 495.672 | -44,56 | 10.008 | -62,83 | ||||
| 2026-02-18 | 13F | Cim, Llc | 0 | -100,00 | 0 | -100,00 | ||||
| 2026-01-15 | 13F | Fortitude Family Office, LLC | 60 | 0,00 | 1 | 0,00 | ||||
| 2026-02-12 | 13F | MetLife Investment Management, LLC | 16.702 | 0,00 | 337 | -32,87 | ||||
| 2026-02-17 | 13F | Gilder Gagnon Howe & Co Llc | 317.948 | -1,88 | 6.419 | -34,20 | ||||
| 2026-02-04 | 13F | KLCM Advisors, Inc. | 75.000 | 0,00 | 1.514 | -32,95 | ||||
| 2025-11-14 | 13F | Cubist Systematic Strategies, LLC | Put | 220.400 | 6.636 | |||||
| 2026-02-17 | 13F | Capital Fund Management S.a. | Call | 42.400 | -0,70 | 856 | -33,39 | |||
| 2025-11-14 | 13F | Cubist Systematic Strategies, LLC | Call | 123.900 | 3.731 | |||||
| 2026-02-13 | 13F | Ubs Asset Management Americas Inc | 29.002 | 586 | ||||||
| 2026-01-28 | 13F | Klp Kapitalforvaltning As | 6.100 | 123 | ||||||
| 2026-02-10 | 13F | Bank of New York Mellon Corp | 89.755 | -8,66 | 1.812 | -38,74 | ||||
| 2026-02-17 | 13F | Bank Of America Corp /de/ | Put | 0 | -100,00 | 0 | ||||
| 2026-02-11 | 13F | MCF Advisors LLC | 637 | 97,21 | 13 | 33,33 | ||||
| 2026-01-26 | 13F | Cwm, Llc | 5.889 | -18,65 | 0 | |||||
| 2026-02-13 | 13F | Headlands Technologies LLC | 42.946 | -4,39 | 867 | -35,87 | ||||
| 2026-02-11 | 13F | Ameritas Investment Partners, Inc. | 2.571 | 52 | ||||||
| 2025-11-13 | 13F | Diversify Advisory Services, LLC | 0 | -100,00 | 0 | |||||
| 2026-02-18 | 13F | GWM Advisors LLC | 12.804 | -19,77 | 259 | -46,25 | ||||
| 2026-02-05 | 13F | Halter Ferguson Financial Inc. | 642.129 | 41,75 | 12.965 | -4,96 | ||||
| 2026-02-17 | 13F | Tudor Investment Corp Et Al | 181.500 | 3.664 | ||||||
| 2026-02-13 | 13F | Verition Fund Management LLC | 24.191 | -40,85 | 488 | -60,36 | ||||
| 2026-01-29 | 13F | IMC-Chicago, LLC | 30.238 | 34,83 | 611 | -9,63 | ||||
| 2025-10-06 | 13F | NWF Advisory Services Inc. | 0 | -100,00 | 0 | -100,00 | ||||
| 2026-02-17 | 13F | Parallax Volatility Advisers, L.P. | 0 | -100,00 | 0 | |||||
| 2026-02-13 | 13F | Bard Associates Inc | 179.793 | -1,01 | 3.630 | -33,61 | ||||
| 2025-11-10 | 13F | Colonial Trust Advisors | 0 | -100,00 | 0 | |||||
| 2026-02-06 | 13F | Kingdom Financial Group LLC. | 50 | 1 | ||||||
| 2026-02-13 | 13F | AWM Investment Company, Inc. | 1.536.771 | -1,91 | 31.027 | -34,23 | ||||
| 2026-02-17 | 13F | Caption Management, LLC | 0 | -100,00 | 0 | |||||
| 2026-02-06 | 13F | IFP Advisors, Inc | 0 | -100,00 | 0 | -100,00 | ||||
| 2025-11-06 | 13F | Ameritas Advisory Services, LLC | 0 | -100,00 | 0 | -100,00 | ||||
| 2026-02-05 | 13F | Cambridge Investment Research Advisors, Inc. | 32.480 | -38,69 | 1 | -100,00 | ||||
| 2026-02-17 | 13F | Caption Management, LLC | Call | 0 | -100,00 | 0 | ||||
| 2026-01-09 | 13F | SG Americas Securities, LLC | 0 | -100,00 | 0 | |||||
| 2026-02-17 | 13F | Aquatic Capital Management LLC | 23.067 | 466 | ||||||
| 2026-02-17 | 13F | Two Sigma Advisers, Lp | 85.001 | 1.716 | ||||||
| 2026-02-06 | 13F | Covestor Ltd | 5 | -78,26 | 0 | |||||
| 2026-02-12 | 13F | Jane Street Group, Llc | Call | 264.000 | -8,93 | 5.330 | -38,93 | |||
| 2026-02-17 | 13F | State Of Wisconsin Investment Board | 35.819 | 104,82 | 723 | 37,45 | ||||
| 2026-02-12 | 13F | Jane Street Group, Llc | 240.438 | 4.854 | ||||||
| 2026-02-12 | 13F | Jane Street Group, Llc | Put | 148.300 | -34,73 | 2.994 | -56,23 | |||
| 2025-11-13 | 13F | Parallel Advisors, LLC | 0 | -100,00 | 0 | |||||
| 2026-01-23 | 13F | Bouvel Investment Partners, LLC | 53.796 | -2,33 | 1.086 | -34,50 | ||||
| 2026-02-06 | 13F | HighTower Advisors, LLC | 0 | -100,00 | 0 | |||||
| 2026-02-17 | 13F | ExodusPoint Capital Management, LP | 0 | -100,00 | 0 | -100,00 | ||||
| 2026-01-05 | 13F | GAMMA Investing LLC | 1.570 | 7,09 | 32 | -29,55 | ||||
| 2026-02-17 | 13F | Royal Bank Of Canada | 51.971 | -5,64 | 1.050 | -36,71 | ||||
| 2026-02-13 | 13F | Kilter Group LLC | 13 | 0 | ||||||
| 2026-02-17 | 13F | Susquehanna International Group, Llp | Put | 459.600 | -19,04 | 9.279 | -45,71 | |||
| 2026-02-17 | 13F | D. E. Shaw & Co., Inc. | Put | 19.900 | 2,58 | 402 | -31,34 | |||
| 2026-02-17 | 13F | Susquehanna International Group, Llp | Call | 1.195.600 | 28,50 | 24.139 | -13,83 | |||
| 2026-02-14 | 13F | Rockefeller Capital Management L.P. | 1.583 | 0,00 | 32 | -34,04 | ||||
| 2026-02-17 | 13F | Clear Street Markets Llc | 213 | 4 | ||||||
| 2026-02-17 | 13F | Susquehanna International Group, Llp | 111.259 | 703,49 | 2.246 | 439,90 | ||||
| 2026-02-17 | 13F | D. E. Shaw & Co., Inc. | 290.291 | 23,86 | 5.861 | -16,96 | ||||
| 2026-02-17 | 13F | D. E. Shaw & Co., Inc. | Call | 371.900 | 1,72 | 7.509 | -31,80 | |||
| 2026-02-11 | 13F | Franklin Resources Inc | 13.251 | -18,34 | 268 | -45,29 | ||||
| 2026-01-08 | 13F | Versant Capital Management, Inc | 1.321 | 15,88 | 27 | -23,53 | ||||
| 2026-02-17 | 13F | Advisory Services Network, LLC | 0 | -100,00 | 0 | |||||
| 2026-01-06 | 13F | Penbrook Management LLC | 114.900 | -1,16 | 2.320 | -33,74 | ||||
| 2026-02-12 | 13F | Federation des caisses Desjardins du Quebec | 794 | 0,00 | 16 | -30,43 | ||||
| 2026-02-09 | 13F | Royce & Associates Lp | 42.102 | -24,04 | 850 | -49,04 | ||||
| 2026-02-13 | 13F | Sculptor Capital LP | Put | 300.000 | 0,00 | 6.057 | -32,95 | |||
| 2026-02-13 | 13F | Sculptor Capital LP | 300.000 | 0,00 | 6.057 | -32,95 | ||||
| 2026-02-11 | 13F | Horizon Kinetics Asset Management Llc | 21.300 | 38,31 | 430 | -7,13 | ||||
| 2026-02-12 | 13F | Polen Capital Management Llc | 0 | -100,00 | 0 | |||||
| 2026-02-17 | 13F | Janus Henderson Group Plc | 15.000 | 303 | ||||||
| 2026-02-13 | 13F | Victory Capital Management Inc | 69.540 | 0,00 | 1.404 | -32,92 | ||||
| 2026-02-10 | 13F | State of Wyoming | 7.113 | 156,14 | 144 | 72,29 | ||||
| 2025-11-14 | 13F | Wolverine Trading, Llc | Put | 127.600 | 176,19 | 3.885 | 572,15 | |||
| 2026-02-06 | 13F | Heritage Investors Management Corp | 48.413 | 0,00 | 1 | -100,00 | ||||
| 2026-03-26 | 13F | Leonteq Securities AG | 0 | -100,00 | 0 | |||||
| 2026-02-17 | 13F | Jones Financial Companies Lllp | 1.029 | 0,00 | 21 | -35,48 | ||||
| 2025-11-14 | 13F | Wolverine Trading, Llc | 20.531 | -50,67 | 625 | 19,96 | ||||
| 2025-11-14 | 13F | Wolverine Trading, Llc | Call | 181.700 | 152,71 | 5.533 | 514,67 | |||
| 2026-02-13 | 13F | Sei Investments Co | 31.921 | 644 | ||||||
| 2026-02-10 | 13F | Intech Investment Management Llc | 10.677 | -13,66 | 216 | -42,20 | ||||
| 2026-02-13 | 13F | Walleye Trading LLC | Put | 24.000 | -45,58 | 485 | -63,53 | |||
| 2026-02-13 | 13F | Walleye Trading LLC | Call | 40.300 | 13,84 | 814 | -23,66 | |||
| 2026-02-09 | 13F | Legal & General Group Plc | 28.994 | 329,48 | 585 | 188,18 | ||||
| 2025-11-07 | 13F | Gsa Capital Partners Llp | 0 | -100,00 | 0 | |||||
| 2026-02-13 | 13F | State Street Corp | 624.085 | 3,65 | 12.600 | -30,50 | ||||
| 2026-02-11 | 13F | Los Angeles Capital Management Llc | 132 | 3 | ||||||
| 2026-02-10 | 13F | Rothschild Investment Llc | 100 | 0,00 | 2 | -33,33 | ||||
| 2026-02-11 | 13F | Deutsche Bank Ag\ | 21.454 | 10,57 | 433 | -25,86 | ||||
| 2026-02-06 | 13F | Larson Financial Group LLC | 584 | 320,14 | 12 | 175,00 | ||||
| 2026-02-10 | 13F | Quantbot Technologies LP | 19.856 | 401 | ||||||
| 2026-01-14 | 13F | Net Worth Advisory Group | 13.225 | 0,14 | 267 | -32,75 | ||||
| 2026-02-13 | 13F | SRS Capital Advisors, Inc. | 834 | 17 | ||||||
| 2026-02-17 | 13F | Brevan Howard Capital Management LP | 31.960 | 129,33 | 645 | 53,94 | ||||
| 2026-02-17 | 13F | Creative Planning | 0 | -100,00 | 0 | |||||
| 2026-02-17 | 13F | Bank Of America Corp /de/ | 70.662 | -28,05 | 1.427 | -51,78 | ||||
| 2026-02-11 | 13F | LPL Financial LLC | 12.240 | -5,30 | 247 | -36,50 | ||||
| 2025-11-14 | 13F | Skopos Labs, Inc. | 0 | -100,00 | 0 | |||||
| 2026-02-17 | 13F | Citadel Advisors Llc | Put | 287.600 | -9,42 | 5.807 | -39,26 | |||
| 2026-02-17 | 13F | Northern Trust Corp | 239.872 | 3,96 | 4.843 | -30,29 | ||||
| 2026-02-13 | 13F | FORA Capital, LLC | 0 | -100,00 | 0 | -100,00 | ||||
| 2025-10-06 | 13F | Venture Visionary Partners LLC | 0 | -100,00 | 0 | |||||
| 2026-02-03 | 13F | SBI Securities Co., Ltd. | 629 | -6,81 | 13 | -40,00 | ||||
| 2026-02-13 | 13F | Squarepoint Ops LLC | 100.199 | 2.023 | ||||||
| 2026-02-06 | 13F | EverSource Wealth Advisors, LLC | 310 | 532,65 | 6 | 500,00 | ||||
| 2026-02-13 | 13F | Wells Fargo & Company/mn | 35.219 | 61,57 | 711 | 8,38 | ||||
| 2026-02-17 | 13F | Citadel Advisors Llc | Call | 548.500 | 3,41 | 11.074 | -30,66 | |||
| 2026-02-17 | 13F | Optiver Holding B.V. | 0 | -100,00 | 0 | |||||
| 2026-02-17 | 13F | Citadel Advisors Llc | 220.779 | -1,12 | 4.458 | -33,70 | ||||
| 2026-02-19 | 13F | Invesco Ltd. | 28.219 | -92,30 | 570 | -94,84 | ||||
| 2025-10-06 | 13F | Venture Visionary Partners LLC | Call | 0 | -100,00 | 0 | ||||
| 2026-02-17 | 13F | Gratia Capital, Llc | Call | 400.000 | 0,00 | 8.076 | -32,95 | |||
| 2026-02-17 | 13F | Gratia Capital, Llc | 137.560 | -1,43 | 2.777 | -33,91 | ||||
| 2026-02-13 | 13F | Police & Firemen's Retirement System of New Jersey | 8.480 | 2,27 | 171 | -31,33 | ||||
| 2026-01-29 | 13F | UBS Group AG | 243.129 | 55,74 | 4.909 | 4,43 | ||||
| 2026-02-13 | 13F | Kennedy Capital Management, Inc. | 360.234 | 40,38 | 7.273 | -5,86 | ||||
| 2026-01-22 | 13F | Harwood Advisory Group, LLC | 57 | 0,00 | 1 | 0,00 | ||||
| 2026-03-30 | 13F/A | Barclays Plc | Put | 0 | -100,00 | 0 | ||||
| 2026-02-05 | 13F | ARS Investment Partners, LLC | 0 | -100,00 | 0 | |||||
| 2026-02-13 | 13F | Caitong International Asset Management Co., Ltd | 1.229 | 25 | ||||||
| 2026-02-10 | 13F | Bnp Paribas Arbitrage, Sa | 6.090 | 10,07 | 123 | -26,51 | ||||
| 2026-02-09 | 13F | Geode Capital Management, Llc | 685.694 | 0,82 | 13.846 | -32,40 | ||||
| 2026-02-17 | 13F | Engineers Gate Manager LP | 15.101 | 305 | ||||||
| 2026-01-30 | 13F | Rachor Investment Advisory Services, LLC | 18 | 0 | ||||||
| 2026-01-23 | 13F | State of Alaska, Department of Revenue | 18.675 | 0 | ||||||
| 2026-02-05 | 13F | Amalgamated Bank | 895 | -8,49 | 0 | |||||
| 2026-02-03 | 13F | McIlrath & Eck, LLC | 531 | 0,00 | 11 | -33,33 | ||||
| 2025-11-14 | 13F | Quarry LP | 0 | -100,00 | 0 | |||||
| 2026-02-11 | 13F | Group One Trading, L.p. | 0 | -100,00 | 0 | |||||
| 2026-01-28 | 13F | Universal- Beteiligungs- und Servicegesellschaft mbH | 20.000 | 407 | ||||||
| 2026-02-17 | 13F | Silvercrest Asset Management Group Llc | 308.387 | 0,17 | 6.226 | -32,83 | ||||
| 2026-02-17 | 13F | Point72 Asset Management, L.P. | Put | 114.900 | 2.320 | |||||
| 2026-02-17 | 13F | Point72 Asset Management, L.P. | Call | 81.700 | 1.650 | |||||
| 2026-01-21 | 13F | Newbridge Financial Services Group, Inc. | 1.950 | 0,00 | 39 | -32,76 | ||||
| 2026-01-08 | 13F | Armstrong Advisory Group, Inc | 134 | 0,00 | 3 | -50,00 | ||||
| 2026-02-17 | 13F | California State Teachers Retirement System | 1.754 | -1,63 | 35 | -33,96 | ||||
| 2026-02-12 | 13F | BlackRock, Inc. | 2.127.105 | 6,23 | 42.946 | -28,77 | ||||
| 2026-02-12 | 13F | Swiss National Bank | 56.300 | 1.137 | ||||||
| 2026-01-29 | 13F | Vanguard Group Inc | 2.337.433 | 2,15 | 47.193 | -31,50 | ||||
| 2026-02-10 | 13F | Thompson Siegel & Walmsley Llc | 24.027 | -16,25 | 0 | |||||
| 2026-02-13 | 13F | Morgan Stanley | 244.783 | 174,21 | 4.942 | 83,92 | ||||
| 2026-02-17 | 13F | Cetera Investment Advisers | 11.598 | 41,51 | 234 | -4,88 | ||||
| 2026-02-17 | 13F | Alliancebernstein L.p. | 36.420 | 0,00 | 735 | -32,94 | ||||
| 2025-11-14 | 13F | Dark Forest Capital Management Lp | 35.738 | 0,00 | 462 | 0,00 | ||||
| 2026-02-06 | 13F | Global Retirement Partners, LLC | 173 | 8.550,00 | 3 | |||||
| 2026-02-17 | 13F | Raymond James Financial Inc | 12.740 | -2,75 | 257 | -34,77 | ||||
| 2026-02-11 | 13F | Rise Advisors, LLC | 0 | -100,00 | 0 | |||||
| 2026-02-17 | 13F | XTX Topco Ltd | 39.225 | 75,68 | 792 | 17,71 | ||||
| 2026-02-17 | 13F | RiverPark Advisors, LLC | 3.398 | 140,82 | 69 | 61,90 | ||||
| 2026-02-13 | 13F | Wexford Capital Lp | 0 | -100,00 | 0 | |||||
| 2026-02-13 | 13F | Barclays Plc | 44.380 | -68,42 | 896 | -50,36 | ||||
| 2026-01-28 | 13F | Clarity Financial LLC | 0 | -100,00 | 0 | |||||
| 2026-01-23 | 13F | Baillie Gifford & Co | 1.290.734 | -15,68 | 26.060 | -43,46 | ||||
| 2026-02-13 | 13F | Truvestments Capital Llc | 0 | -100,00 | 0 | |||||
| 2026-02-05 | 13F | Allworth Financial LP | 27 | 2.600,00 | 1 | |||||
| 2026-02-13 | 13F | Bridgewater Associates, LP | 0 | -100,00 | 0 | |||||
| 2026-02-13 | 13F | Citigroup Inc | 873 | -26,20 | 18 | -51,43 | ||||
| 2026-02-12 | 13F | EAM Investors, LLC | 0 | -100,00 | 0 | |||||
| 2026-02-11 | 13F | Curio Wealth, Llc | 500 | 0,00 | 11 | -26,67 | ||||
| 2026-02-17 | 13F | Price T Rowe Associates Inc /md/ | 34.384 | -24,01 | 1 | -100,00 | ||||
| 2026-02-12 | 13F | Dimensional Fund Advisors Lp | 109.067 | -16,94 | 2.202 | -44,31 | ||||
| 2026-02-13 | 13F | Charles Schwab Investment Management Inc | 238.409 | -0,02 | 4.813 | -32,96 | ||||
| 2026-02-17 | 13F | Two Sigma Investments, Lp | 355.574 | 237,59 | 7.179 | 126,40 | ||||
| 2026-02-17 | 13F | Algert Global Llc | 11.430 | 0 | ||||||
| 2026-02-11 | 13F | Jpmorgan Chase & Co | 64.355 | 324,98 | 1.299 | 185,49 | ||||
| 2026-02-17 | 13F | Two Sigma Investments, Lp | Put | 12.900 | 260 | |||||
| 2026-02-13 | 13F | American Century Companies Inc | 0 | -100,00 | 0 | |||||
| 2026-02-17 | 13F | Two Sigma Investments, Lp | Call | 15.500 | 313 | |||||
| 2026-02-17 | 13F | Quantinno Capital Management LP | 29.497 | 35,71 | 596 | -9,02 | ||||
| 2026-02-13 | 13F | Rice Hall James & Associates, Llc | 453.568 | 2,07 | 9.158 | -31,56 |
Other Listings
| DE:AYB | 36,40 € |