Grundlæggende statistik
| Institutionelle aktier (lange) | 49.083.135 - 54,25% (ex 13D/G) - change of -18,12MM shares -26,96% MRQ |
| Institutionel værdi (lang) | $ 348.957 USD ($1000) |
Institutionelt ejerskab og aktionærer
Adamas Trust, Inc. (US:ADAM) har 188 institutionelle ejere og aktionærer, der har indsendt 13D/G- eller 13F-formularer til Securities Exchange Commission (SEC). Disse institutioner har i alt 49,083,135 aktier. Største aktionærer omfatter BlackRock, Inc., Vanguard Group Inc, Allspring Global Investments Holdings, LLC, State Street Corp, Invesco Ltd., MIRAE ASSET GLOBAL ETFS HOLDINGS Ltd., Geode Capital Management, Llc, Charles Schwab Investment Management Inc, Northern Trust Corp, and Van Eck Associates Corp .
Adamas Trust, Inc. (NasdaqGS:ADAM) institutionel ejerskabsstruktur viser aktuelle positioner i virksomheden efter institutioner og fonde, samt seneste ændringer i positionsstørrelse. Større aktionærer kan omfatte individuelle investorer, investeringsforeninger, hedgefonde eller institutioner. Skema 13D angiver, at investoren besidder (eller besidder) mere end 5 % af virksomheden og har til hensigt (eller har til hensigt at) aktivt at forfølge en ændring i forretningsstrategi. Skema 13G indikerer en passiv investering på over 5%.
The share price as of April 24, 2026 is 7,95 / share. Previously, on September 3, 2025, the share price was 7,36 / share. This represents an increase of 8,02% over that period.
Fondens stemningsscore
Fund Sentiment Score (fka Ownership Accumulation Score) finder de aktier, der bliver mest købt af fonde. Det er resultatet af en sofistikeret, multi-faktor kvantitativ model, der identificerer virksomheder med de højeste niveauer af institutionel akkumulering. Scoringsmodellen bruger en kombination af den samlede stigning i oplyste ejere, ændringerne i porteføljeallokeringer i disse ejere og andre målinger. Tallet går fra 0 til 100, hvor højere tal indikerer et højere niveau af akkumulering for sine jævnaldrende, og 50 er gennemsnittet.
Opdateringsfrekvens: Dagligt
Se Ownership Explorer, som giver en liste over højest rangerende virksomheder.
AI+ Ask Fintel’s AI assistant about Adamas Trust, Inc..
Select a question to share a public post with an AI-crafted answer.
Thinking of good questions…
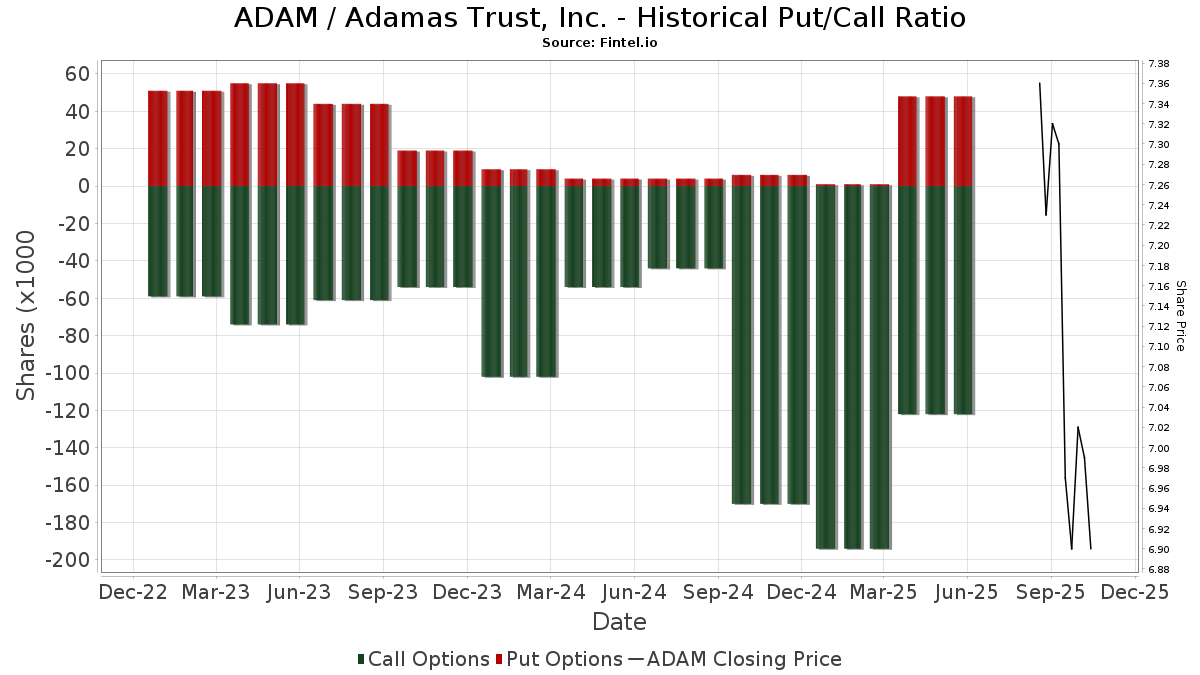
Institutionel Put/Call-forhold
Ud over at indberette standardaktie- og gældsudstedelser skal institutter med mere end 100 mill. aktiver under forvaltning også oplyse deres put- og call-optionsbeholdninger. Da salgsoptioner generelt indikerer negativ stemning, og købsoptioner indikerer positiv stemning, kan vi få en fornemmelse af den overordnede institutionelle stemning ved at plotte forholdet mellem put og kald. Diagrammet til højre viser det historiske put/call-forhold for dette instrument.
Brug af Put/Call Ratio som en indikator for investorernes stemning overvinder en af de vigtigste mangler ved at bruge totalt institutionelt ejerskab, som er, at en betydelig mængde af aktiver under forvaltning investeres passivt for at spore indekser. Passivt forvaltede fonde køber typisk ikke optioner, så indikatoren for put/call-forholdet følger mere nøje følelsen af aktivt forvaltede fonde.
13D/G-arkivering
Vi præsenterer 13D/G ansøgninger separat fra 13F ansøgninger på grund af den forskellige behandling af SEC. 13D/G-ansøgninger kan indgives af grupper af investorer (med én ledende), hvorimod 13F-ansøgninger ikke kan. Dette resulterer i situationer, hvor en investor kan indsende en 13D/G, der rapporterer én værdi for de samlede aktier (der repræsenterer alle de aktier, der ejes af investorgruppen), men derefter indsender en 13F, der rapporterer en anden værdi for de samlede aktier (der udelukkende repræsenterer deres egne) ejendomsret). Det betyder, at aktieejerskab af 13D/G-arkiver og 13F-arkiveringer ofte ikke er direkte sammenlignelige, så vi præsenterer dem separat.
Bemærk: Fra den 16. maj 2021 viser vi ikke længere ejere, der ikke har indsendt en 13D/G inden for det seneste år. Tidligere viste vi den fulde historie af 13D/G-arkiver. Generelt skal enheder, der er forpligtet til at indgive 13D/G-ansøgninger, indgive mindst årligt, før de indsender en afsluttende ansøgning. Dog forlader fonde nogle gange positioner uden at indsende en afsluttende ansøgning (dvs. de afvikler), så visning af den fulde historie resulterede nogle gange i forvirring om det nuværende ejerskab. For at undgå forvirring viser vi nu kun 'aktuelle' ejere - det vil sige - ejere, der har anmeldt inden for det seneste år.
Upgrade to unlock premium data.
| Fil dato | Form | Investor | Forrige Aktier |
Seneste Aktier |
Δ Aktier (Procent) |
Ejendomsret (Procent) |
Δ Ejerskab (Procent) |
|
|---|---|---|---|---|---|---|---|---|
| 2025-07-17 | BlackRock, Inc. | 15,229,986 | 13,842,837 | -9.11 | 15.30 | -8.93 |
13F og NPORT arkivering
Detaljer om 13F-arkivering er gratis. Detaljer om NP-ansøgninger kræver et premium-medlemskab. Grønne rækker angiver nye positioner. Røde rækker angiver lukkede positioner. Klik på linket ikon for at se den fulde transaktionshistorik.
Opgrader
for at låse premium-data op og eksportere til Excel ![]() .
.
| Fil dato | Kilde | Investor | Type | Gennemsnitlig pris (Øst) |
Aktier | Δ Aktier (%) |
Rapporteret Værdi ($1000) |
Δ Værdi (%) |
Port Alloc (%) |
|
|---|---|---|---|---|---|---|---|---|---|---|
| 2026-02-17 | 13F | Advisory Services Network, LLC | 0 | -100,00 | 0 | -100,00 | ||||
| 2026-02-10 | 13F | Ssi Investment Management Llc | 51.438 | 1.159 | ||||||
| 2026-02-10 | 13F | Goldman Sachs Group Inc | 475.738 | 48,05 | 3.473 | 55,07 | ||||
| 2026-02-13 | 13F | Smartleaf Asset Management LLC | 1.293 | 47,77 | 9 | 80,00 | ||||
| 2026-02-13 | 13F | Prudential Financial Inc | 452.024 | 416,72 | 3.300 | 441,71 | ||||
| 2026-04-13 | 13F | Massmutual Trust Co Fsb/adv | 306 | 2 | ||||||
| 2026-02-13 | 13F | Quarry LP | 0 | -100,00 | 0 | |||||
| 2026-02-12 | 13F | CIBC Private Wealth Group, LLC | 20 | 0 | ||||||
| 2026-04-22 | 13F | Pictet Asset Management Holding SA | 10.522 | 1,73 | 77 | 2,67 | ||||
| 2026-02-09 | 13F | Quest Partners LLC | 5.589 | 41 | ||||||
| 2026-02-17 | 13F | Quantinno Capital Management LP | 76.303 | 28,97 | 557 | 35,19 | ||||
| 2026-02-04 | 13F | Bailard, Inc. | 0 | -100,00 | 0 | |||||
| 2026-02-17 | 13F | Maryland State Retirement & Pension System | 12.075 | 0,00 | 88 | 4,76 | ||||
| 2026-02-17 | 13F | Massar Capital Management, LP | 0 | -100,00 | 0 | |||||
| 2025-11-13 | 13F | Dynamic Technology Lab Private Ltd | 0 | -100,00 | 0 | -100,00 | ||||
| 2026-02-12 | 13F | Ankerstar Wealth, LLC | 52 | 0 | ||||||
| 2026-02-06 | 13F | Global Retirement Partners, LLC | 24 | 0 | ||||||
| 2026-02-02 | 13F | Wolverine Asset Management Llc | 397.986 | -14,72 | 2.905 | -10,67 | ||||
| 2026-02-13 | 13F | Rhumbline Advisers | 223.660 | -11,03 | 1.633 | -6,85 | ||||
| 2026-02-05 | 13F | Allworth Financial LP | 24.947 | 346,28 | 182 | 378,95 | ||||
| 2026-02-13 | 13F | Police & Firemen's Retirement System of New Jersey | 24.570 | 0,00 | 179 | 4,68 | ||||
| 2026-02-02 | 13F | Principal Financial Group Inc | 400.328 | -1,28 | 2.922 | 3,40 | ||||
| 2026-02-11 | 13F | Jpmorgan Chase & Co | 583.267 | -9,15 | 4.258 | -4,85 | ||||
| 2026-02-17 | 13F | Glenmede Trust Co Na | 0 | -100,00 | 0 | |||||
| 2025-11-13 | 13F | Arrowstreet Capital, Limited Partnership | 0 | -100,00 | 0 | |||||
| 2026-02-17 | 13F | Price T Rowe Associates Inc /md/ | 114.877 | 12,11 | 1 | |||||
| 2026-02-17 | 13F | Polymer Capital Management (US) LLC | 50.764 | 1,51 | 371 | 6,32 | ||||
| 2026-02-06 | 13F | Pnc Financial Services Group, Inc. | 5.814 | -6,07 | 42 | -2,33 | ||||
| 2026-01-28 | 13F | Arizona State Retirement System | 23.845 | -5,93 | 174 | -1,14 | ||||
| 2026-02-17 | 13F | MIRAE ASSET GLOBAL ETFS HOLDINGS Ltd. | 2.384.416 | 8,47 | 17.406 | 13,62 | ||||
| 2026-02-17 | 13F | Tower Research Capital LLC (TRC) | 5.140 | 43,58 | 38 | 54,17 | ||||
| 2026-02-11 | 13F | Parallel Advisors, LLC | 1.201 | -22,01 | 9 | -20,00 | ||||
| 2026-02-17 | 13F | Prelude Capital Management, Llc | 22.545 | 165 | ||||||
| 2026-01-27 | 13F | Zurcher Kantonalbank (Zurich Cantonalbank) | 17.387 | 0,00 | 127 | 4,13 | ||||
| 2026-02-17 | 13F | Weiss Asset Management LP | 69.876 | 510 | ||||||
| 2026-02-12 | 13F | New York State Common Retirement Fund | 19.393 | 0,00 | 142 | 4,44 | ||||
| 2026-02-13 | 13F | Umb Bank N A/mo | 619 | 74,37 | 5 | 100,00 | ||||
| 2026-02-17 | 13F | Alliancebernstein L.p. | 83.672 | 0,00 | 611 | 4,63 | ||||
| 2026-02-12 | 13F | BRYN MAWR TRUST Co | 0 | -100,00 | 0 | -100,00 | ||||
| 2026-02-17 | 13F | Qube Research & Technologies Ltd | 86.052 | 628 | ||||||
| 2026-04-23 | 13F | Private Wealth Management Group, LLC | 298 | 0,00 | 2 | 0,00 | ||||
| 2026-02-10 | 13F | CIBC World Markets Inc. | 36.823 | -26,71 | 269 | -23,43 | ||||
| 2026-02-12 | 13F | Penserra Capital Management LLC | 159.662 | -3,45 | 1 | 0,00 | ||||
| 2026-02-12 | 13F | Nuveen, LLC | 195.659 | -3,45 | 1.428 | 1,13 | ||||
| 2026-02-17 | 13F | VARCOV Co. | 51.673 | 377 | ||||||
| 2026-02-17 | 13F | Optiver Holding B.V. | 540 | -12,05 | 4 | -25,00 | ||||
| 2026-04-07 | 13F | Signaturefd, Llc | 1.075 | 21,20 | 8 | 16,67 | ||||
| 2025-10-31 | 13F | Mutual Of America Capital Management Llc | 0 | -100,00 | 0 | -100,00 | ||||
| 2026-02-17 | 13F | Mercer Global Advisors Inc /adv | 11.545 | -54,82 | 84 | -52,81 | ||||
| 2026-02-02 | 13F | Fifth Third Bancorp | 438 | -42,29 | 3 | -40,00 | ||||
| 2026-02-17 | 13F | Fmr Llc | 9.390 | 6,56 | 69 | 11,48 | ||||
| 2026-02-12 | 13F | Cibc World Markets Corp | 0 | -100,00 | 0 | |||||
| 2026-02-17 | 13F | D. E. Shaw & Co., Inc. | 0 | -100,00 | 0 | |||||
| 2026-02-17 | 13F | Guggenheim Capital Llc | 195.514 | 1.598,94 | 1.427 | 1.683,75 | ||||
| 2026-02-11 | 13F | Flagship Wealth Advisors, Llc | 0 | -100,00 | 0 | |||||
| 2026-02-13 | 13F | Citigroup Inc | 18.113 | -57,13 | 132 | -55,10 | ||||
| 2026-02-17 | 13F | Millennium Management Llc | 60.728 | -59,81 | 443 | -57,93 | ||||
| 2026-02-13 | 13F | Public Sector Pension Investment Board | 291.036 | -11,16 | 2.125 | -6,96 | ||||
| 2026-04-22 | 13F | Spire Wealth Management | 190 | 0,00 | 1 | 0,00 | ||||
| 2026-02-11 | 13F | Simplex Trading, Llc | 1.437 | 10 | ||||||
| 2026-02-12 | 13F | MetLife Investment Management, LLC | 41.618 | -16,19 | 304 | -12,43 | ||||
| 2026-02-23 | 13F | Beaird Harris Wealth Management, LLC | 37 | 0,00 | 0 | |||||
| 2026-02-13 | 13F | Ubs Asset Management Americas Inc | 151.520 | -4,01 | 1.106 | 0,55 | ||||
| 2026-04-24 | 13F | Root Financial Partners, LLC | 188 | 1 | ||||||
| 2026-02-17 | 13F | Russell Investments Group, Ltd. | 171.646 | 8,39 | 1.253 | 13,60 | ||||
| 2026-01-28 | 13F | Klp Kapitalforvaltning As | 18.350 | 17,25 | 138 | 22,32 | ||||
| 2026-04-13 | 13F | IFP Advisors, Inc | 99 | 0,00 | 1 | |||||
| 2026-04-06 | 13F | GAMMA Investing LLC | 7.967 | -4,22 | 59 | -3,33 | ||||
| 2025-11-13 | 13F | Bank Of Montreal /can/ | 0 | -100,00 | 0 | -100,00 | ||||
| 2026-02-09 | 13F | Kingsview Wealth Management, LLC | 21.352 | 156 | ||||||
| 2026-02-13 | 13F | Kestra Advisory Services, LLC | 4.312 | 31 | ||||||
| 2026-04-10 | 13F | Novem Group | 10.187 | 75 | ||||||
| 2026-02-13 | 13F | Manufacturers Life Insurance Company, The | 25.016 | -14,51 | 183 | -10,34 | ||||
| 2026-02-10 | 13F | State of Wyoming | 48.014 | -10,25 | 351 | -5,91 | ||||
| 2026-01-26 | 13F | Cwm, Llc | 10.028 | 49,32 | 0 | |||||
| 2026-01-30 | 13F/A | M&t Bank Corp | 10.255 | 75 | ||||||
| 2025-11-14 | 13F | Equitable Holdings, Inc. | 0 | -100,00 | 0 | |||||
| 2026-04-20 | 13F | Louisiana State Employees Retirement System | 37.200 | -3,38 | 274 | -2,85 | ||||
| 2026-02-09 | 13F | Hartland & Co., LLC | 10 | -94,08 | 0 | -100,00 | ||||
| 2026-04-16 | 13F | SG Americas Securities, LLC | 0 | -100,00 | 0 | |||||
| 2026-02-17 | 13F | Dark Forest Capital Management Lp | 0 | -100,00 | 0 | -100,00 | ||||
| 2026-04-21 | 13F | Financial Consulate, Inc | 65 | 0 | ||||||
| 2026-01-30 | 13F | New York State Teachers Retirement System | 128.812 | -0,08 | 1 | |||||
| 2026-02-17 | 13F | Public Employees Retirement System Of Ohio | 3.888 | -8,58 | 28 | -3,45 | ||||
| 2026-02-13 | 13F | National Bank Of Canada /fi/ | 17.912 | 0,66 | 131 | 4,84 | ||||
| 2026-02-17 | 13F | Aqr Capital Management Llc | 211.238 | 53,96 | 1.542 | 61,30 | ||||
| 2026-02-13 | 13F | Pinnacle Wealth Planning Services, Inc. | 2.410 | 18 | ||||||
| 2026-01-28 | 13F | Salomon & Ludwin, LLC | 740 | 678,95 | 5 | |||||
| 2026-01-28 | 13F | Teacher Retirement System Of Texas | 64.409 | 42,65 | 470 | 49,68 | ||||
| 2026-02-11 | 13F | Group One Trading, L.p. | 503 | 154,04 | 4 | 200,00 | ||||
| 2026-02-12 | 13F | State Board Of Administration Of Florida Retirement System | 25.982 | 0,00 | 190 | 4,42 | ||||
| 2026-02-13 | 13F | Sei Investments Co | 138.120 | 29,40 | 1.008 | 35,67 | ||||
| 2025-11-14 | 13F | Texas Permanent School Fund | 0 | -100,00 | 0 | |||||
| 2026-02-13 | 13F | Ieq Capital, Llc | 22.499 | 20,48 | 164 | 26,15 | ||||
| 2026-02-19 | 13F | Invesco Ltd. | 3.174.247 | 8,33 | 23.172 | 13,45 | ||||
| 2026-02-13 | 13F | Van Eck Associates Corp | 903.689 | 16,25 | 7 | 20,00 | ||||
| 2026-02-17 | 13F | RMB Capital Management, LLC | 90.632 | 0,33 | 662 | 5,09 | ||||
| 2026-01-30 | 13F | Us Bancorp \de\ | 2.297 | 0,00 | 17 | 0,00 | ||||
| 2026-02-13 | 13F | Public Employees Retirement Association Of Colorado | 24.479 | 0,00 | 0 | |||||
| 2026-02-10 | 13F | Commonwealth Of Pennsylvania Public School Empls Retrmt Sys | 20.792 | -2,80 | 152 | 1,34 | ||||
| 2026-04-15 | 13F | Atwood & Palmer Inc | 4.000 | 0,00 | 29 | 0,00 | ||||
| 2025-11-14 | 13F | Corton Capital Inc. | 31.703 | 221 | ||||||
| 2026-02-12 | 13F | Commonwealth Equity Services, Llc | 32.878 | 0,98 | 240 | |||||
| 2026-04-23 | 13F | Farmers & Merchants Investments Inc | 62 | 0,00 | 0 | |||||
| 2026-02-06 | 13F | Covestor Ltd | 16 | 0,00 | 0 | |||||
| 2026-04-23 | 13F | MQS Management LLC | 30.561 | 65,71 | 225 | 67,16 | ||||
| 2026-04-07 | 13F | Farther Finance Advisors, LLC | 1.883 | 3,23 | 14 | 0,00 | ||||
| 2026-02-13 | 13F | Verition Fund Management LLC | 44.269 | -9,45 | 323 | -5,00 | ||||
| 2026-02-18 | 13F | State of Tennessee, Treasury Department | 29.039 | -25,17 | 232 | -14,07 | ||||
| 2026-02-23 | 13F | Virtu Financial LLC | 26.836 | 0 | ||||||
| 2025-11-14 | 13F | Bayesian Capital Management, LP | 0 | -100,00 | 0 | |||||
| 2026-02-11 | 13F | Ameritas Investment Partners, Inc. | 7.109 | 52 | ||||||
| 2025-11-04 | 13F | AXS Investments LLC | 0 | -100,00 | 0 | |||||
| 2026-04-24 | 13F | Yousif Capital Management, Llc | 22.646 | -0,51 | 167 | -12,17 | ||||
| 2026-02-10 | 13F | Bank of New York Mellon Corp | 518.754 | -30,98 | 3.787 | -27,72 | ||||
| 2026-02-06 | 13F | ProShare Advisors LLC | 16.527 | 3,24 | 121 | 8,11 | ||||
| 2026-02-12 | 13F | Quadrant Capital Group Llc | 1.439 | -0,83 | 11 | 0,00 | ||||
| 2026-02-17 | 13F | Two Sigma Advisers, Lp | 12.951 | -86,62 | 95 | -86,05 | ||||
| 2026-01-21 | 13F | Flagship Harbor Advisors, Llc | 55 | 0 | ||||||
| 2026-02-17 | 13F | Graham Capital Management, L.P. | 0 | -100,00 | 0 | -100,00 | ||||
| 2026-02-17 | 13F | Ameriprise Financial Inc | 195.170 | -5,58 | 1.432 | -1,10 | ||||
| 2026-02-13 | 13F | Victory Capital Management Inc | 54.544 | 46,05 | 398 | 53,08 | ||||
| 2025-11-17 | 13F | PharVision Advisers, LLC | 0 | -100,00 | 0 | |||||
| 2026-02-10 | 13F | Intech Investment Management Llc | 210.948 | 139,93 | 1.540 | 151,47 | ||||
| 2026-02-11 | 13F | Deutsche Bank Ag\ | 70.285 | 6,28 | 513 | 11,52 | ||||
| 2026-02-12 | 13F | Jane Street Group, Llc | Call | 14.300 | -21,86 | 104 | -18,11 | |||
| 2026-02-12 | 13F | Jane Street Group, Llc | 168.329 | 178,99 | 1.229 | 192,38 | ||||
| 2025-11-14 | 13F | Sherbrooke Park Advisers Llc | 0 | -100,00 | 0 | -100,00 | ||||
| 2026-02-17 | 13F | Creative Planning | 18.552 | 45,08 | 135 | 51,69 | ||||
| 2026-02-11 | 13F | Los Angeles Capital Management Llc | 115.039 | -29,17 | 757 | -33,22 | ||||
| 2026-02-10 | 13F | Cherry Tree Wealth Management, LLC | 6 | 0,00 | 0 | |||||
| 2026-02-17 | 13F | Zacks Investment Management | 0 | -100,00 | 0 | -100,00 | ||||
| 2026-02-13 | 13F | Charles Schwab Investment Management Inc | 1.786.223 | 19,10 | 13.039 | 24,74 | ||||
| 2026-02-17 | 13F | Jones Financial Companies Lllp | 42 | 35,48 | 0 | |||||
| 2026-01-28 | 13F | Barrett & Company, Inc. | 652 | 0,00 | 5 | 0,00 | ||||
| 2026-01-29 | 13F | Teachers Retirement System Of The State Of Kentucky | 21.386 | -17,43 | 0 | |||||
| 2025-11-04 | 13F | Pineridge Advisors LLC | 143 | 2,88 | 1 | |||||
| 2026-01-29 | 13F | Vanguard Group Inc | 6.035.999 | -1,06 | 44.063 | 3,62 | ||||
| 2026-04-10 | 13F | Abound Wealth Management | 15 | 0 | ||||||
| 2026-04-20 | 13F | Kestra Private Wealth Services, Llc | 12.275 | 0,00 | 90 | 1,12 | ||||
| 2026-02-05 | 13F | High Note Wealth, LLC | 231 | 0,00 | 2 | 0,00 | ||||
| 2025-11-12 | 13F | Segall Bryant & Hamill, Llc | 0 | -100,00 | 0 | |||||
| 2025-11-14 | 13F | Almitas Capital LLC | 0 | -100,00 | 0 | |||||
| 2026-02-09 | 13F | Legal & General Group Plc | 218.449 | -1,63 | 1.595 | 3,04 | ||||
| 2026-02-17 | 13F | Janus Henderson Group Plc | 41.676 | 0,00 | 304 | 4,83 | ||||
| 2026-02-09 | 13F | Geode Capital Management, Llc | 2.150.659 | -3,65 | 15.702 | 0,91 | ||||
| 2026-01-15 | 13F | Nisa Investment Advisors, Llc | 8.452 | -40,21 | 65 | -37,25 | ||||
| 2026-02-17 | 13F | Bank Of America Corp /de/ | 432.402 | 1,63 | 3.157 | 6,44 | ||||
| 2026-04-06 | 13F | Versant Capital Management, Inc | 5.723 | 7,21 | 42 | 10,53 | ||||
| 2026-04-02 | 13F | Aspect Partners, LLC | 0 | -100,00 | 0 | |||||
| 2026-02-13 | 13F | Golden State Wealth Management, LLC | 312 | 0,00 | 2 | 0,00 | ||||
| 2026-02-17 | 13F | Susquehanna International Group, Llp | Call | 33.100 | -57,12 | 242 | -55,20 | |||
| 2026-02-05 | 13F | Thrivent Financial For Lutherans | 78.030 | 28,77 | 1 | |||||
| 2026-02-13 | 13F | State Street Corp | 3.269.851 | -2,17 | 24.607 | 2,32 | ||||
| 2026-02-17 | 13F | Susquehanna International Group, Llp | 33.038 | 42,34 | 241 | 49,69 | ||||
| 2026-02-04 | 13F | Oregon Public Employees Retirement Fund | 19.252 | 1,58 | 141 | 6,06 | ||||
| 2026-02-05 | 13F | Amalgamated Bank | 24.801 | 0,23 | 0 | |||||
| 2025-11-12 | 13F | Fox Run Management, L.l.c. | 0 | -100,00 | 0 | |||||
| 2025-11-12 | 13F | Quantbot Technologies LP | 0 | -100,00 | 0 | |||||
| 2026-02-13 | 13F | Morgan Stanley | 889.297 | 16,78 | 6.492 | 22,31 | ||||
| 2026-02-13 | 13F | Mariner, LLC | 11.761 | 86 | ||||||
| 2026-02-11 | 13F | LPL Financial LLC | 12.660 | 16,94 | 92 | 22,67 | ||||
| 2026-02-13 | 13F | Wells Fargo & Company/mn | 273.856 | 5,00 | 1.999 | 10,02 | ||||
| 2025-10-27 | 13F | Janney Montgomery Scott LLC | 0 | -100,00 | 0 | |||||
| 2026-02-13 | 13F | Squarepoint Ops LLC | 20.234 | 36,49 | 148 | 42,72 | ||||
| 2026-02-17 | 13F | Wiley Bros.-aintree Capital, Llc | 16.563 | 0,72 | 121 | 5,26 | ||||
| 2026-01-29 | 13F | Comerica Bank | 23.133 | -24,68 | 169 | -21,50 | ||||
| 2026-04-22 | 13F | Sterling Capital Management LLC | 2.836 | -42,79 | 21 | -44,44 | ||||
| 2026-02-17 | 13F | Northern Trust Corp | 950.110 | -6,58 | 6.936 | -2,16 | ||||
| 2025-11-13 | 13F | Glenmede Investment Management, LP | 0 | -100,00 | 0 | |||||
| 2026-04-20 | 13F | State of Alaska, Department of Revenue | 42.078 | 0,00 | 0 | |||||
| 2026-02-10 | 13F | Jupiter Asset Management Ltd | 15.058 | 110 | ||||||
| 2026-04-21 | 13F | Gilpin Wealth Management, Llc | 17 | 0 | ||||||
| 2026-02-12 | 13F | Skopos Labs, Inc. | 63.561 | 0,54 | 464 | 5,23 | ||||
| 2026-04-20 | 13F | Ronald Blue Trust, Inc. | 0 | -100,00 | 0 | |||||
| 2026-02-10 | 13F | Bnp Paribas Arbitrage, Sa | 21.000 | -0,64 | 153 | 4,08 | ||||
| 2026-01-29 | 13F | Quent Capital, LLC | 18 | 0,00 | 0 | |||||
| 2026-02-09 | 13F | Atlantic Trust, LLC | 0 | -100,00 | 0 | |||||
| 2026-02-17 | 13F | One William Street Capital Management, L.p. | 0 | -100,00 | 0 | -100,00 | ||||
| 2026-02-13 | 13F | SRS Capital Advisors, Inc. | 63 | -98,64 | 0 | -100,00 | ||||
| 2026-02-14 | 13F | Rockefeller Capital Management L.P. | 1.624 | 603,03 | 12 | 1.000,00 | ||||
| 2026-01-29 | 13F | UBS Group AG | 320.283 | 8,77 | 2.338 | 13,94 | ||||
| 2026-02-02 | 13F | Chung Wu Investment Group, LLC | 1.500 | 0,00 | 11 | 0,00 | ||||
| 2026-01-15 | 13F | Allspring Global Investments Holdings, LLC | 3.365.619 | -6,57 | 25.040 | -0,27 | ||||
| 2026-02-06 | 13F | EverSource Wealth Advisors, LLC | 2.101 | -4,76 | 15 | 0,00 | ||||
| 2026-02-17 | 13F | Cetera Investment Advisers | 10.787 | -14,01 | 79 | -10,34 | ||||
| 2026-02-18 | 13F | Vident Advisory, LLC | 31.020 | -17,77 | 226 | -13,74 | ||||
| 2026-02-13 | 13F | Centiva Capital, LP | Call | 0 | -100,00 | 0 | -100,00 | |||
| 2026-04-08 | 13F | Community Financial Services Group, LLC | 193 | 1 | ||||||
| 2026-04-24 | 13F | Strs Ohio | 14.800 | -9,20 | 109 | -8,47 | ||||
| 2026-02-13 | 13F | Resources Investment Advisors, LLC. | 10.365 | 0,12 | 76 | 4,17 | ||||
| 2026-02-17 | 13F | Engineers Gate Manager LP | 49.971 | -35,50 | 365 | -32,59 | ||||
| 2026-02-17 | 13F | State Of Wisconsin Investment Board | 84.602 | 13,60 | 618 | 18,88 | ||||
| 2026-02-17 | 13F | California State Teachers Retirement System | 83.177 | -0,09 | 607 | 4,66 | ||||
| 2026-02-26 | 13F | TD Capital Management LLC | 36 | 0 | ||||||
| 2026-02-06 | 13F | FourThought Financial Partners, LLC | 41.787 | -7,16 | 305 | -2,56 | ||||
| 2026-02-13 | 13F | MAI Capital Management | 3.239 | 9,72 | 24 | 15,00 | ||||
| 2026-01-08 | 13F | True Wealth Design, LLC | 0 | -100,00 | 0 | |||||
| 2026-02-12 | 13F | Federation des caisses Desjardins du Quebec | 800 | 0,00 | 6 | 0,00 | ||||
| 2026-02-13 | 13F | Diametric Capital, LP | 90.612 | 661 | ||||||
| 2026-02-17 | 13F | Citadel Advisors Llc | 0 | -100,00 | 0 | -100,00 | ||||
| 2026-02-17 | 13F | Citadel Advisors Llc | Put | 15.900 | 116 | |||||
| 2026-02-17 | 13F | Citadel Advisors Llc | Call | 64.200 | 252,75 | 469 | 271,43 | |||
| 2026-02-12 | 13F | Voya Investment Management Llc | 66.838 | 65,86 | 488 | 73,93 | ||||
| 2025-10-30 | 13F | Twin Peaks Wealth Advisors, LLC | 0 | -100,00 | 0 | |||||
| 2026-04-15 | 13F | Park Capital Management, LLC / WI | 11.247 | 83 | ||||||
| 2025-10-31 | 13F | National Asset Management, Inc. | 0 | -100,00 | 0 | |||||
| 2026-02-12 | 13F | Renaissance Technologies Llc | 181.267 | -42,46 | 1.323 | -39,73 | ||||
| 2025-11-14 | 13F | Larson Financial Group LLC | 0 | -100,00 | 0 | |||||
| 2026-02-10 | 13F | Rothschild Investment Llc | 92 | 41,54 | 1 | |||||
| 2026-02-17 | 13F | Raymond James Financial Inc | 33.938 | 248 | ||||||
| 2026-02-17 | 13F | Advisor Group Holdings, Inc. | 25.368 | -2,28 | 185 | -0,54 | ||||
| 2026-02-09 | 13F | Harbour Investments, Inc. | 1.081 | -9,99 | 8 | -12,50 | ||||
| 2026-02-09 | 13F | Hantz Financial Services, Inc. | 778 | 19,14 | 0 | |||||
| 2026-02-13 | 13F | Parkside Financial Bank & Trust | 153 | 0,00 | 1 | 0,00 | ||||
| 2026-02-17 | 13F | Royal Bank Of Canada | 42.047 | -73,99 | 307 | -72,76 | ||||
| 2026-02-13 | 13F | Barclays Plc | 132.671 | -38,17 | 968 | -35,25 | ||||
| 2025-11-13 | 13F | Franklin Resources Inc | 0 | -100,00 | 0 | |||||
| 2026-02-13 | 13F | Caxton Associates Llp | 28.012 | -59,95 | 204 | -58,11 | ||||
| 2026-02-05 | 13F | Bessemer Group Inc | 1.100 | 0,00 | 0 | |||||
| 2026-03-11 | 13F | Leonteq Securities AG | 0 | -100,00 | 0 | |||||
| 2026-02-10 | 13F | Calton & Associates, Inc. | 11.121 | 81 | ||||||
| 2026-02-11 | 13F | Illinois Municipal Retirement Fund | 48.149 | 2,25 | 351 | 7,01 | ||||
| 2026-02-03 | 13F | Legacy Wealth Managment, LLC/ID | 27 | -42,55 | 0 | |||||
| 2026-02-12 | 13F | Swiss National Bank | 169.230 | 2,98 | 1.235 | 7,86 | ||||
| 2026-02-13 | 13F | Centiva Capital, LP | 0 | -100,00 | 0 | -100,00 | ||||
| 2026-01-30 | 13F | Torren Management, LLC | 696 | 5 | ||||||
| 2026-02-12 | 13F | Campbell & CO Investment Adviser LLC | 136.821 | 69,40 | 999 | 77,58 | ||||
| 2026-02-12 | 13F | BlackRock, Inc. | 13.422.213 | 1,57 | 97.982 | 6,37 | ||||
| 2025-11-14 | 13F | Wolverine Trading, Llc | Call | 19.200 | 24,68 | 132 | 28,43 | |||
| 2026-02-17 | 13F | Susquehanna International Group, Llp | Put | 0 | -100,00 | 0 | ||||
| 2026-01-15 | 13F | Range Financial Group LLC | 146.557 | 9,53 | 1.070 | 14,70 | ||||
| 2026-02-17 | 13F | Two Sigma Investments, Lp | 365.310 | -12,43 | 2.667 | -8,29 | ||||
| 2025-11-07 | 13F | BNP Paribas Asset Management Holding S.A. | 0 | -100,00 | 0 | |||||
| 2026-04-02 | 13F | Ares Financial Consulting, LLC | 69 | 0,00 | 1 |
Other Listings
| DE:NKZ0 | 6,60 € |