Grundlæggende statistik
| Institutionelle aktier (lange) | 109.636.260 - 70,69% (ex 13D/G) - change of -17,64MM shares -13,86% MRQ |
| Institutionel værdi (lang) | $ 208.693 USD ($1000) |
Institutionelt ejerskab og aktionærer
Conduent Incorporated (US:CNDT) har 198 institutionelle ejere og aktionærer, der har indsendt 13D/G- eller 13F-formularer til Securities Exchange Commission (SEC). Disse institutioner har i alt 109,636,260 aktier. Største aktionærer omfatter Neuberger Berman Group LLC, BlackRock, Inc., Vanguard Group Inc, Dimensional Fund Advisors Lp, Charles Schwab Investment Management Inc, Miller Value Partners, Llc, Blue Owl Capital Holdings LP, American Century Companies Inc, Geode Capital Management, Llc, and State Street Corp .
Conduent Incorporated (NasdaqGS:CNDT) institutionel ejerskabsstruktur viser aktuelle positioner i virksomheden efter institutioner og fonde, samt seneste ændringer i positionsstørrelse. Større aktionærer kan omfatte individuelle investorer, investeringsforeninger, hedgefonde eller institutioner. Skema 13D angiver, at investoren besidder (eller besidder) mere end 5 % af virksomheden og har til hensigt (eller har til hensigt at) aktivt at forfølge en ændring i forretningsstrategi. Skema 13G indikerer en passiv investering på over 5%.
The share price as of May 1, 2026 is 1,75 / share. Previously, on May 2, 2025, the share price was 2,16 / share. This represents a decline of 18,98% over that period.

Fondens stemningsscore
Fund Sentiment Score (fka Ownership Accumulation Score) finder de aktier, der bliver mest købt af fonde. Det er resultatet af en sofistikeret, multi-faktor kvantitativ model, der identificerer virksomheder med de højeste niveauer af institutionel akkumulering. Scoringsmodellen bruger en kombination af den samlede stigning i oplyste ejere, ændringerne i porteføljeallokeringer i disse ejere og andre målinger. Tallet går fra 0 til 100, hvor højere tal indikerer et højere niveau af akkumulering for sine jævnaldrende, og 50 er gennemsnittet.
Opdateringsfrekvens: Dagligt
Se Ownership Explorer, som giver en liste over højest rangerende virksomheder.
AI+ Ask Fintel’s AI assistant about Conduent Incorporated.
Select a question to share a public post with an AI-crafted answer.
Thinking of good questions…
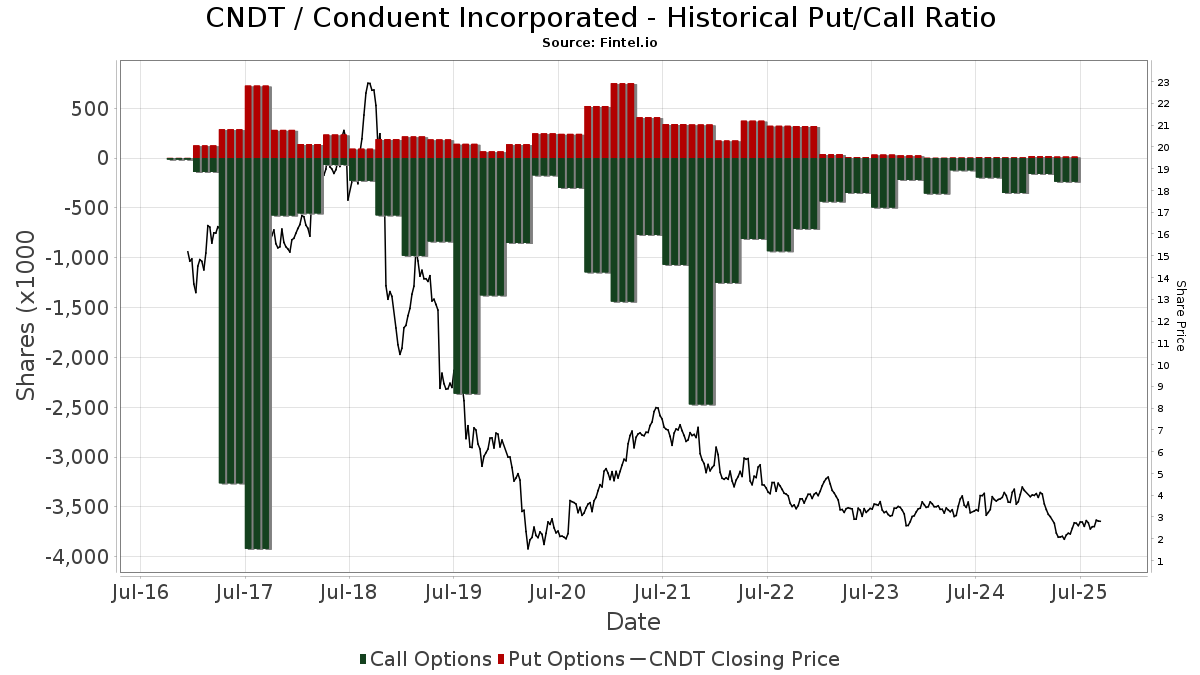
Institutionel Put/Call-forhold
Ud over at indberette standardaktie- og gældsudstedelser skal institutter med mere end 100 mill. aktiver under forvaltning også oplyse deres put- og call-optionsbeholdninger. Da salgsoptioner generelt indikerer negativ stemning, og købsoptioner indikerer positiv stemning, kan vi få en fornemmelse af den overordnede institutionelle stemning ved at plotte forholdet mellem put og kald. Diagrammet til højre viser det historiske put/call-forhold for dette instrument.
Brug af Put/Call Ratio som en indikator for investorernes stemning overvinder en af de vigtigste mangler ved at bruge totalt institutionelt ejerskab, som er, at en betydelig mængde af aktiver under forvaltning investeres passivt for at spore indekser. Passivt forvaltede fonde køber typisk ikke optioner, så indikatoren for put/call-forholdet følger mere nøje følelsen af aktivt forvaltede fonde.
13D/G-arkivering
Vi præsenterer 13D/G ansøgninger separat fra 13F ansøgninger på grund af den forskellige behandling af SEC. 13D/G-ansøgninger kan indgives af grupper af investorer (med én ledende), hvorimod 13F-ansøgninger ikke kan. Dette resulterer i situationer, hvor en investor kan indsende en 13D/G, der rapporterer én værdi for de samlede aktier (der repræsenterer alle de aktier, der ejes af investorgruppen), men derefter indsender en 13F, der rapporterer en anden værdi for de samlede aktier (der udelukkende repræsenterer deres egne) ejendomsret). Det betyder, at aktieejerskab af 13D/G-arkiver og 13F-arkiveringer ofte ikke er direkte sammenlignelige, så vi præsenterer dem separat.
Bemærk: Fra den 16. maj 2021 viser vi ikke længere ejere, der ikke har indsendt en 13D/G inden for det seneste år. Tidligere viste vi den fulde historie af 13D/G-arkiver. Generelt skal enheder, der er forpligtet til at indgive 13D/G-ansøgninger, indgive mindst årligt, før de indsender en afsluttende ansøgning. Dog forlader fonde nogle gange positioner uden at indsende en afsluttende ansøgning (dvs. de afvikler), så visning af den fulde historie resulterede nogle gange i forvirring om det nuværende ejerskab. For at undgå forvirring viser vi nu kun 'aktuelle' ejere - det vil sige - ejere, der har anmeldt inden for det seneste år.
Upgrade to unlock premium data.
| Fil dato | Form | Investor | Forrige Aktier |
Seneste Aktier |
Δ Aktier (Procent) |
Ejendomsret (Procent) |
Δ Ejerskab (Procent) |
|
|---|---|---|---|---|---|---|---|---|
| 2026-04-09 | DIMENSIONAL FUND ADVISORS LP | 8,791,349 | 7,601,314 | -13.54 | 4.90 | -9.26 | ||
| 2026-03-26 | VANGUARD GROUP INC | 8,567,109 | 0 | -100.00 | 0.00 | -100.00 | ||
| 2026-02-13 | DEASON DARWIN | 12,320,307 | 12,320,307 | 0.00 | 7.59 | 5.86 | ||
| 2025-12-03 | Neuberger Berman Group LLC | 14,693,141 | 15,624,300 | 6.34 | 10.20 | 50.89 | ||
| 2025-07-16 | BlackRock, Inc. | 13,187,041 | 11,098,207 | -15.84 | 6.90 | -14.81 |
13F og NPORT arkivering
Detaljer om 13F-arkivering er gratis. Detaljer om NP-ansøgninger kræver et premium-medlemskab. Grønne rækker angiver nye positioner. Røde rækker angiver lukkede positioner. Klik på linket ikon for at se den fulde transaktionshistorik.
Opgrader
for at låse premium-data op og eksportere til Excel ![]() .
.
| Fil dato | Kilde | Investor | Type | Gennemsnitlig pris (Øst) |
Aktier | Δ Aktier (%) |
Rapporteret Værdi ($1000) |
Δ Værdi (%) |
Port Alloc (%) |
|
|---|---|---|---|---|---|---|---|---|---|---|
| 2026-02-03 | 13F | NewEdge Wealth, LLC | 0 | -100,00 | 0 | |||||
| 2026-02-11 | 13F | Simplex Trading, Llc | Put | 6.100 | 12 | |||||
| 2026-02-18 | 13F | GWM Advisors LLC | 0 | -100,00 | 0 | |||||
| 2026-02-12 | 13F | Paradigm Capital Management Inc/ny | 0 | -100,00 | 0 | |||||
| 2026-02-11 | 13F | Simplex Trading, Llc | 24.964 | 179,83 | 48 | |||||
| 2026-02-09 | 13F | Legal & General Group Plc | 13.690 | 0,00 | 26 | -31,58 | ||||
| 2026-02-11 | 13F | Simplex Trading, Llc | Call | 9.400 | 135,00 | 18 | ||||
| 2026-02-17 | 13F | Susquehanna International Group, Llp | 126.988 | -53,59 | 244 | -68,28 | ||||
| 2026-04-20 | 13F | Assenagon Asset Management S.A. | 627.885 | 0,00 | 804 | -33,36 | ||||
| 2026-02-17 | 13F | Bridgeway Capital Management Inc | 1.010.247 | -29,01 | 1.940 | -51,33 | ||||
| 2025-11-14 | 13F | Point72 Europe (London) LLP | 3.130 | 9 | ||||||
| 2026-02-17 | 13F | Northern Trust Corp | 1.172.956 | -8,88 | 2.252 | -37,51 | ||||
| 2026-01-16 | 13F | FNY Investment Advisers, LLC | 0 | -100,00 | 0 | |||||
| 2026-02-02 | 13F | Principal Financial Group Inc | 0 | -100,00 | 0 | |||||
| 2026-04-10 | 13F | Country Trust Bank | 40 | 0,00 | 0 | |||||
| 2026-02-09 | 13F | GatePass Capital, LLC | 238.800 | 6,09 | 458 | -27,30 | ||||
| 2026-02-17 | 13F | Moore Capital Management, Lp | 502.627 | 308,01 | 965 | 180,52 | ||||
| 2026-02-17 | 13F | Raymond James Financial Inc | 28.062 | 54 | ||||||
| 2026-02-12 | 13F | MetLife Investment Management, LLC | 48.578 | -36,52 | 93 | -56,54 | ||||
| 2026-02-17 | 13F | Jones Financial Companies Lllp | 879 | 4,77 | 2 | -50,00 | ||||
| 2026-02-11 | 13F | Deutsche Bank Ag\ | 89.309 | -29,01 | 171 | -51,42 | ||||
| 2026-02-17 | 13F | D. E. Shaw & Co., Inc. | 1.768.794 | 4,60 | 3.396 | -28,28 | ||||
| 2026-02-11 | 13F | Franklin Resources Inc | 0 | -100,00 | 0 | |||||
| 2026-04-29 | 13F | Sunrise Financial Services, LLC | 78 | 0 | ||||||
| 2026-04-08 | 13F | DiNuzzo Private Wealth, Inc. | 30 | 0,00 | 0 | |||||
| 2026-02-10 | 13F | Rothschild Investment Llc | 98 | -72,32 | 0 | |||||
| 2026-02-17 | 13F | Sender Co & Partners, Inc. | 0 | -100,00 | 0 | |||||
| 2026-04-15 | 13F | Merit Financial Group, LLC | 22.127 | 28 | ||||||
| 2026-02-17 | 13F | Graham Capital Management, L.P. | 334.752 | 232,21 | 643 | 127,66 | ||||
| 2026-05-01 | 13F | Hantz Financial Services, Inc. | 102 | 0,00 | 0 | |||||
| 2026-01-29 | 13F | UBS Group AG | 124.947 | -30,24 | 240 | -52,30 | ||||
| 2025-11-14 | 13F | Susquehanna International Group, Llp | Call | 0 | -100,00 | 0 | -100,00 | |||
| 2026-02-06 | 13F | Vestmark Advisory Solutions, Inc. | 0 | -100,00 | 0 | |||||
| 2025-11-14 | 13F | Cubist Systematic Strategies, LLC | 365.099 | 621,28 | 1.022 | 668,42 | ||||
| 2026-02-11 | 13F | Jpmorgan Chase & Co | 963.915 | 119,52 | 1.851 | 50,53 | ||||
| 2026-04-07 | 13F | Howard Financial Services, Ltd. | 10.000 | 0,00 | 13 | -36,84 | ||||
| 2026-02-17 | 13F | Armistice Capital, Llc | 1.578.000 | 88,76 | 3.030 | 29,44 | ||||
| 2026-04-28 | 13F | SBI Securities Co., Ltd. | 3 | 0,00 | 0 | |||||
| 2025-11-12 | 13F | Cambria Investment Management, L.P. | 43.556 | 0,00 | 115 | 0,00 | ||||
| 2026-02-17 | 13F | Prelude Capital Management, Llc | 0 | -100,00 | 0 | |||||
| 2026-02-12 | 13F | Quadrant Capital Group Llc | 2.715 | 499,34 | 5 | 400,00 | ||||
| 2026-02-13 | 13F | Wells Fargo & Company/mn | 164.803 | 42,08 | 316 | -2,47 | ||||
| 2026-04-24 | 13F | ProShare Advisors LLC | 20.423 | -23,07 | 26 | -48,00 | ||||
| 2026-02-13 | 13F | Marshall Wace, Llp | 0 | -100,00 | 0 | -100,00 | ||||
| 2025-11-06 | 13F | Ameritas Advisory Services, LLC | 0 | -100,00 | 0 | |||||
| 2026-04-28 | 13F | Bogart Wealth, LLC | 33 | 0 | ||||||
| 2026-02-17 | 13F | Price T Rowe Associates Inc /md/ | 221.895 | 6,10 | 0 | |||||
| 2026-02-10 | 13F | Factorial Partners, Llc | 0 | -100,00 | 0 | |||||
| 2025-11-21 | 13F/A | CIBC Bancorp USA Inc. | 15.896 | 45 | ||||||
| 2026-02-17 | 13F | Advisor Group Holdings, Inc. | 694 | -60,05 | 1 | -75,00 | ||||
| 2026-02-17 | 13F | Two Sigma Investments, Lp | 139.908 | 232,87 | 269 | 129,06 | ||||
| 2026-02-17 | 13F | Public Employees Retirement System Of Ohio | 173.973 | 3,54 | 334 | -28,94 | ||||
| 2026-04-03 | 13F | Investors Research Corp | 15.073 | -1,57 | 19 | -34,48 | ||||
| 2026-02-04 | 13F | Atlantic Union Bankshares Corp | 2.773 | 0,11 | 5 | -28,57 | ||||
| 2026-02-17 | 13F | Occudo Quantitative Strategies Lp | 131.160 | 32,07 | 252 | -9,71 | ||||
| 2026-02-19 | 13F | Invesco Ltd. | 455.994 | -11,14 | 876 | -39,07 | ||||
| 2025-11-14 | 13F | Point72 Asia (Singapore) Pte. Ltd. | 0 | -100,00 | 0 | |||||
| 2025-11-13 | 13F | Parallel Advisors, LLC | 0 | -100,00 | 0 | |||||
| 2026-02-06 | 13F | Gsa Capital Partners Llp | 49.580 | -7,66 | 0 | |||||
| 2025-11-14 | 13F | Wolverine Trading, Llc | 11.773 | 33 | ||||||
| 2026-02-13 | 13F | Rhumbline Advisers | 194.886 | -17,48 | 374 | -43,42 | ||||
| 2026-02-13 | 13F | Charles Schwab Investment Management Inc | 7.116.277 | 35,24 | 13.663 | -7,26 | ||||
| 2026-01-29 | 13F | St Germain D J Co Inc | 0 | -100,00 | 0 | |||||
| 2026-02-13 | 13F | Caitong International Asset Management Co., Ltd | 3.078 | 6 | ||||||
| 2026-02-13 | 13F | Morgan Stanley | 2.052.829 | 18,54 | 3.941 | -18,71 | ||||
| 2026-02-03 | 13F | Orion Capital Management LLC | 2.000 | 0,00 | 4 | -40,00 | ||||
| 2026-02-09 | 13F | Blue Owl Capital Holdings LP | 4.822.422 | 8,20 | 9.259 | -25,80 | ||||
| 2026-02-13 | 13F | National Bank Of Canada /fi/ | 40 | 0 | ||||||
| 2026-02-13 | 13F | American Century Companies Inc | 3.771.178 | 21,23 | 7.241 | -16,87 | ||||
| 2026-02-17 | 13F | Optiver Holding B.V. | 1.400 | 0,00 | 3 | -33,33 | ||||
| 2026-04-27 | 13F | Y-Intercept (Hong Kong) Ltd | 0 | -100,00 | 0 | |||||
| 2026-02-06 | 13F | Covestor Ltd | 376 | -14,93 | 0 | |||||
| 2026-02-13 | 13F | Sei Investments Co | 135.595 | -32,75 | 260 | -53,90 | ||||
| 2026-02-17 | 13F | Mercer Global Advisors Inc /adv | 0 | -100,00 | 0 | -100,00 | ||||
| 2026-02-13 | 13F | Arrowstreet Capital, Limited Partnership | 548.260 | -70,97 | 1.053 | -80,11 | ||||
| 2026-02-05 | 13F | Center for Financial Planning, Inc. | 20 | 0,00 | 0 | |||||
| 2026-02-13 | 13F | Headlands Technologies LLC | 51.227 | 45,94 | 98 | 0,00 | ||||
| 2026-02-12 | 13F | Johnson Financial Group, Inc. | 200 | 0,00 | 0 | |||||
| 2026-02-06 | 13F | Fortis Group Advisors, LLC | 20 | 0,00 | 0 | |||||
| 2026-02-10 | 13F | Envestnet Asset Management Inc | 21.084 | -18,40 | 40 | -44,44 | ||||
| 2026-04-27 | 13F | HB Wealth Management, LLC | 40.164 | 51 | ||||||
| 2026-02-17 | 13F | Point72 Asset Management, L.P. | 0 | -100,00 | 0 | |||||
| 2026-04-20 | 13F | Williams & Novak, LLC | 15.265 | 27,16 | 20 | -13,04 | ||||
| 2026-02-17 | 13F | Susquehanna Portfolio Strategies, LLC | 73.016 | 0,00 | 140 | -31,37 | ||||
| 2026-02-13 | 13F | Integrated Wealth Concepts LLC | 0 | -100,00 | 0 | |||||
| 2026-02-13 | 13F | Panagora Asset Management Inc | 1.031.645 | 8,02 | 1.981 | -25,95 | ||||
| 2026-02-11 | 13F | Barrow Hanley Mewhinney & Strauss Llc | 1.871 | 0,00 | 4 | -40,00 | ||||
| 2026-02-17 | 13F | Qube Research & Technologies Ltd | 0 | -100,00 | 0 | |||||
| 2026-04-17 | 13F | Webster Bank, N. A. | 20 | 0,00 | 0 | |||||
| 2026-02-09 | 13F | Hartland & Co., LLC | 172 | -11,34 | 0 | |||||
| 2026-04-16 | 13F | Capital Advisors, Ltd. LLC | 1 | 0 | ||||||
| 2026-04-22 | 13F | Sterling Capital Management LLC | 4.668 | -44,36 | 6 | -68,75 | ||||
| 2026-02-13 | 13F | SRS Capital Advisors, Inc. | 0 | -100,00 | 0 | |||||
| 2025-11-14 | 13F | Point72 (DIFC) Ltd | 0 | -100,00 | 0 | |||||
| 2026-02-13 | 13F | Neuberger Berman Group LLC | 14.575.823 | -4,59 | 27.975 | -34,62 | ||||
| 2026-02-12 | 13F | Jane Street Group, Llc | 198.744 | -33,56 | 382 | -54,48 | ||||
| 2026-02-17 | 13F | Ancora Advisors, LLC | 0 | -100,00 | 0 | |||||
| 2025-11-06 | 13F | Whipplewood Advisors, LLC | 0 | -100,00 | 0 | |||||
| 2026-04-07 | 13F | Farther Finance Advisors, LLC | 265.270 | 0,14 | 353 | -30,71 | ||||
| 2026-02-13 | 13F | Truvestments Capital Llc | 10.242 | 0,00 | 20 | -32,14 | ||||
| 2026-02-17 | 13F | Fmr Llc | 47.472 | 365,64 | 91 | 225,00 | ||||
| 2026-02-17 | 13F | Alpine Global Management, LLC | 42.558 | 82 | ||||||
| 2026-02-12 | 13F | Federated Hermes, Inc. | 129 | -96,34 | 0 | -100,00 | ||||
| 2026-02-13 | 13F | Victory Capital Management Inc | 15.660 | -3,06 | 30 | -33,33 | ||||
| 2025-11-14 | 13F | ExodusPoint Capital Management, LP | 0 | -100,00 | 0 | |||||
| 2026-02-17 | 13F | Two Sigma Advisers, Lp | 191.500 | 46,97 | 368 | 0,82 | ||||
| 2026-02-17 | 13F | Miller Value Partners, Llc | 5.583.385 | 38,52 | 10.720 | -5,02 | ||||
| 2026-02-13 | 13F | Mariner, LLC | 14.302 | -77,83 | 27 | -85,00 | ||||
| 2026-02-10 | 13F/A | Northwestern Mutual Wealth Management Co | 671 | 34,20 | 1 | 0,00 | ||||
| 2026-02-17 | 13F | Oxford Asset Management Llp | 0 | -100,00 | 0 | -100,00 | ||||
| 2026-02-10 | 13F | Bnp Paribas | 10 | 0,00 | 0 | |||||
| 2025-11-14 | 13F | T. Rowe Price Investment Management, Inc. | 0 | -100,00 | 0 | |||||
| 2026-04-30 | 13F | Nisa Investment Advisors, Llc | 6.214 | 47,18 | 8 | -12,50 | ||||
| 2026-02-09 | 13F | Harbour Investments, Inc. | 15 | 0,00 | 0 | |||||
| 2026-02-11 | 13F | Ameritas Investment Partners, Inc. | 12.458 | 24 | ||||||
| 2026-02-13 | 13F | Pingora Partners LLC | 47.120 | -1,05 | 90 | -32,33 | ||||
| 2025-11-14 | 13F | Strategic Wealth Designers | 0 | -100,00 | 0 | |||||
| 2026-02-17 | 13F | Ameriprise Financial Inc | 382.596 | -2,14 | 735 | -32,91 | ||||
| 2026-02-17 | 13F | Quadrature Capital Ltd | 0 | -100,00 | 0 | |||||
| 2026-04-28 | 13F | Steigerwald, Gordon & Koch Inc. | 85 | 0,00 | 0 | |||||
| 2026-02-06 | 13F | EverSource Wealth Advisors, LLC | 1.392 | -52,31 | 3 | -75,00 | ||||
| 2026-02-12 | 13F | Wealthspire Advisors, LLC | 0 | -100,00 | 0 | |||||
| 2025-11-14 | 13F | Jane Street Group, Llc | Call | 0 | -100,00 | 0 | -100,00 | |||
| 2026-04-28 | 13F | Golden State Wealth Management, LLC | 1.423 | 0,00 | 2 | -50,00 | ||||
| 2026-02-11 | 13F | Potomac Capital Management, Inc. | Put | 101.000 | 194 | |||||
| 2026-02-11 | 13F | Potomac Capital Management, Inc. | 1.545.619 | 205,88 | 2.968 | 60,90 | ||||
| 2025-11-14 | 13F | Wolverine Trading, Llc | Call | 0 | -100,00 | 0 | -100,00 | |||
| 2026-02-17 | 13F | Voleon Capital Management Lp | 389.274 | 157,72 | 747 | 77,01 | ||||
| 2026-02-17 | 13F | Modern Wealth Management, LLC | 0 | -100,00 | 0 | -100,00 | ||||
| 2026-02-11 | 13F | Empowered Funds, LLC | 687.225 | -23,23 | 1.319 | -47,37 | ||||
| 2026-02-05 | 13F | Amalgamated Bank | 4.573 | -20,69 | 0 | |||||
| 2026-04-08 | 13F | Wealth Enhancement Advisory Services, Llc | 34.165 | 47 | ||||||
| 2026-02-10 | 13F | Bnp Paribas Arbitrage, Sa | 151.719 | -0,77 | 291 | -32,01 | ||||
| 2026-02-04 | 13F | Tsfg, Llc | 0 | -100,00 | 0 | |||||
| 2026-02-13 | 13F | Toroso Investments, LLC | 10.654 | 20 | ||||||
| 2026-04-24 | 13F | Horizon Wealth Management, LLC | 10.042 | 0,00 | 13 | -36,84 | ||||
| 2026-02-17 | 13F | Aristeia Capital Llc | 0 | -100,00 | 0 | |||||
| 2026-02-11 | 13F | Rise Advisors, LLC | 0 | -100,00 | 0 | |||||
| 2026-02-11 | 13F | Invst, LLC | 430.288 | 0,91 | 826 | -30,76 | ||||
| 2026-01-29 | 13F | Comerica Bank | 4.223 | -20,00 | 8 | -42,86 | ||||
| 2026-04-20 | 13F | Ronald Blue Trust, Inc. | 100 | 0,00 | 0 | |||||
| 2026-02-11 | 13F | Group One Trading, L.p. | 956 | -97,35 | 2 | -99,00 | ||||
| 2026-02-11 | 13F | Cerity Partners LLC | 0 | -100,00 | 0 | |||||
| 2026-02-17 | 13F | Schonfeld Strategic Advisors LLC | 47.677 | 10,62 | 92 | -24,17 | ||||
| 2026-02-17 | 13F | Tower Research Capital LLC (TRC) | 5.663 | -11,24 | 11 | -41,18 | ||||
| 2026-02-17 | 13F | Captrust Financial Advisors | 0 | -100,00 | 0 | |||||
| 2026-02-17 | 13F | Alliancebernstein L.p. | 165.563 | 0,00 | 318 | -31,53 | ||||
| 2026-02-17 | 13F | Jain Global LLC | 34.200 | 66 | ||||||
| 2026-02-23 | 13F | Virtu Financial LLC | 10.352 | 0 | ||||||
| 2026-04-23 | 13F | SJS Investment Consulting Inc. | 115 | 98,28 | 0 | |||||
| 2026-02-17 | 13F | Advisory Services Network, LLC | 0 | -100,00 | 0 | |||||
| 2026-02-10 | 13F | Goldman Sachs Group Inc | 1.400.179 | -11,89 | 2.688 | -39,58 | ||||
| 2026-04-23 | 13F | McMillan Office, Inc. | 16 | 0,00 | 0 | |||||
| 2026-04-30 | 13F | Hsbc Holdings Plc | 272.320 | -0,19 | 354 | -32,05 | ||||
| 2026-02-13 | 13F | Caxton Associates Llp | 92.262 | 0,00 | 177 | -31,40 | ||||
| 2026-02-12 | 13F | Renaissance Technologies Llc | 2.297.100 | -2,21 | 4.410 | -32,94 | ||||
| 2026-02-17 | 13F | Millennium Management Llc | 617.135 | 52,32 | 1.185 | 4,41 | ||||
| 2026-02-20 | 13F | Sunbelt Securities, Inc. | 12 | -76,00 | 0 | |||||
| 2026-04-06 | 13F | GAMMA Investing LLC | 1.013 | 1 | ||||||
| 2026-03-26 | 13F | Leonteq Securities AG | Call | 0 | -100,00 | 0 | ||||
| 2026-04-24 | 13F | Strs Ohio | 171.500 | 0,00 | 220 | -33,43 | ||||
| 2026-04-17 | 13F | HHM Wealth Advisors, LLC | 20 | 0 | ||||||
| 2026-02-17 | 13F | Man Group plc | 50.304 | 97 | ||||||
| 2026-02-05 | 13F | Allworth Financial LP | 1.039 | -46,33 | 2 | -80,00 | ||||
| 2026-02-06 | 13F | Pnc Financial Services Group, Inc. | 540 | 17,65 | 1 | 0,00 | ||||
| 2026-02-11 | 13F | Group One Trading, L.p. | Call | 10.100 | -83,17 | 19 | -88,69 | |||
| 2026-02-11 | 13F | LPL Financial LLC | 12.532 | -48,82 | 24 | -64,71 | ||||
| 2026-04-07 | 13F | CoreCap Advisors, LLC | 129 | 0,00 | 0 | |||||
| 2026-02-12 | 13F | BlackRock, Inc. | 14.288.300 | 1,96 | 27.434 | -30,08 | ||||
| 2026-01-29 | 13F | Vanguard Group Inc | 8.720.587 | 0,99 | 16.744 | -30,75 | ||||
| 2026-02-12 | 13F | Cibc World Markets Corp | 0 | -100,00 | 0 | |||||
| 2026-02-12 | 13F | Dimensional Fund Advisors Lp | 8.212.632 | -7,26 | 15.767 | -36,41 | ||||
| 2026-04-13 | 13F | IFP Advisors, Inc | 385 | -22,38 | 0 | |||||
| 2026-04-24 | 13F | Root Financial Partners, LLC | 307 | 0 | ||||||
| 2026-02-09 | 13F | Geode Capital Management, Llc | 3.653.575 | -2,42 | 7.017 | -33,09 | ||||
| 2026-03-26 | 13F | Leonteq Securities AG | 0 | -100,00 | 0 | |||||
| 2026-02-13 | 13F | Prudential Financial Inc | 2.955.421 | -0,39 | 5.674 | -31,70 | ||||
| 2026-02-17 | 13F | XTX Topco Ltd | 72.515 | -76,49 | 139 | -83,89 | ||||
| 2026-04-16 | 13F | Diversified Trust Co | 70.903 | 0,00 | 91 | -33,82 | ||||
| 2026-02-12 | 13F | Xponance, Inc. | 11.346 | -2,36 | 22 | -34,37 | ||||
| 2026-02-17 | 13F | Caption Management, LLC | 16.632 | 0,00 | 32 | -32,61 | ||||
| 2026-02-13 | 13F | Diametric Capital, LP | 0 | -100,00 | 0 | |||||
| 2026-02-17 | 13F | Russell Investments Group, Ltd. | 136.368 | -86,29 | 262 | -90,63 | ||||
| 2026-04-30 | 13F | Nuveen, LLC | 397.042 | 0,58 | 508 | -32,89 | ||||
| 2026-02-13 | 13F | Citigroup Inc | 26.303 | -91,70 | 51 | -94,36 | ||||
| 2026-04-14 | 13F | Nbc Securities, Inc. | 20 | 0,00 | 0 | |||||
| 2026-02-17 | 13F/A | Cantor Fitzgerald, L. P. | 0 | -100,00 | 0 | -100,00 | ||||
| 2026-02-13 | 13F | Public Employees Retirement Association Of Colorado | 0 | -100,00 | 0 | |||||
| 2026-02-12 | 13F | Front Row Advisors LLC | 20 | 0,00 | 0 | |||||
| 2026-04-16 | 13F | SG Americas Securities, LLC | 12.567 | -48,10 | 0 | |||||
| 2026-04-28 | 13F | Abel Hall, LLC | 30.647 | -23,96 | 39 | -49,35 | ||||
| 2026-04-30 | 13F | Costello Asset Management, INC | 200 | 0,00 | 0 | |||||
| 2026-02-10 | 13F | Quantbot Technologies LP | 0 | -100,00 | 0 | |||||
| 2026-02-10 | 13F | Savant Capital, LLC | 0 | -100,00 | 0 | |||||
| 2026-02-13 | 13F | Ieq Capital, Llc | 21.352 | -86,49 | 41 | -90,95 | ||||
| 2026-02-10 | 13F | Intech Investment Management Llc | 61.397 | -14,24 | 118 | -41,50 | ||||
| 2026-02-13 | 13F | Stifel Financial Corp | 10.190 | -17,52 | 20 | -44,12 | ||||
| 2026-02-12 | 13F | Advisors Asset Management, Inc. | 1.087 | -1,18 | 2 | -94,87 | ||||
| 2026-02-12 | 13F | Triumph Capital Management | 40 | 0,00 | 0 | |||||
| 2026-02-17 | 13F | Susquehanna Fundamental Investments, Llc | 239.650 | 460 | ||||||
| 2026-01-30 | 13F/A | M&t Bank Corp | 17.197 | 33 | ||||||
| 2026-02-13 | 13F | Jacobs Levy Equity Management, Inc | 1.651.472 | -14,77 | 3.171 | -41,57 | ||||
| 2026-02-17 | 13F | Royal Bank Of Canada | 3.886 | -98,08 | 8 | -98,59 | ||||
| 2026-02-17 | 13F | Tudor Investment Corp Et Al | 65.710 | 126 | ||||||
| 2026-02-12 | 13F | Voya Investment Management Llc | 29.764 | 0,00 | 57 | -31,33 | ||||
| 2026-02-12 | 13F | New York State Common Retirement Fund | 25.751 | 0,00 | 49 | -31,94 | ||||
| 2026-04-24 | 13F | Private Advisor Group, LLC | 13.881 | -12,91 | 18 | -43,33 | ||||
| 2026-02-12 | 13F | Hrt Financial Lp | 0 | -100,00 | 0 | |||||
| 2026-02-17 | 13F | Aquatic Capital Management LLC | 60.634 | -37,03 | 116 | -56,88 | ||||
| 2026-02-13 | 13F | Verition Fund Management LLC | 33.000 | 0,00 | 63 | -31,52 | ||||
| 2026-04-29 | 13F | Saxon Interests, Inc. | 0 | -100,00 | 0 | |||||
| 2026-02-13 | 13F | Barclays Plc | 378.052 | 4,51 | 726 | -28,36 | ||||
| 2026-01-26 | 13F | Cwm, Llc | 11.398 | -73,57 | 0 | |||||
| 2026-04-27 | 13F | Truist Financial Corp | 33.000 | 0,00 | 42 | -33,33 | ||||
| 2025-11-07 | 13F | Beacon Capital Management, LLC | 0 | -100,00 | 0 | |||||
| 2025-11-14 | 13F | Engineers Gate Manager LP | 0 | -100,00 | 0 | |||||
| 2026-02-17 | 13F | California State Teachers Retirement System | 8.952 | -3,61 | 17 | -34,62 | ||||
| 2026-03-16 | 13F/A | Rockefeller Capital Management L.P. | 11.545 | 67.811,76 | 22 | |||||
| 2026-04-20 | 13F | State of Alaska, Department of Revenue | 8.581 | 0,00 | 0 | |||||
| 2026-01-30 | 13F | Us Bancorp \de\ | 441 | -89,80 | 1 | -100,00 | ||||
| 2026-02-12 | 13F | Steward Partners Investment Advisory, Llc | 265.734 | -14,08 | 510 | -41,04 | ||||
| 2026-04-29 | 13F | SilverOak Wealth Management LLC | 13.173 | 0,00 | 17 | -36,00 | ||||
| 2026-02-17 | 13F | Brevan Howard Capital Management LP | 21.198 | 41 | ||||||
| 2026-04-30 | 13F | Torren Management, LLC | 0 | -100,00 | 0 | |||||
| 2026-02-13 | 13F | Smartleaf Asset Management LLC | 37 | 0 | ||||||
| 2025-11-14 | 13F | Skopos Labs, Inc. | 0 | -100,00 | 0 | |||||
| 2026-02-13 | 13F | State Street Corp | 3.402.391 | -1,28 | 6.533 | -32,31 | ||||
| 2026-04-30 | 13F | Elevated Capital Advisors, LLC | 30 | 0,00 | 0 | |||||
| 2026-02-10 | 13F | Bank of New York Mellon Corp | 488.676 | -1,52 | 938 | -32,47 | ||||
| 2026-02-13 | 13F | Transamerica Financial Advisors, Inc. | 0 | -100,00 | 0 | -100,00 | ||||
| 2026-02-03 | 13F | Ballentine Partners, LLC | 17.840 | -49,25 | 34 | -65,31 | ||||
| 2026-01-23 | 13F | Assetmark, Inc | 6 | 0,00 | 0 | |||||
| 2026-04-30 | 13F | Mascoma Wealth Management LLC | 40 | 0,00 | 0 | |||||
| 2026-04-27 | 13F | HTG Investment Advisors, Inc. | 22.474 | 0,00 | 29 | -34,88 | ||||
| 2026-02-17 | 13F | MIRAE ASSET GLOBAL ETFS HOLDINGS Ltd. | 67.556 | -3,54 | 130 | -34,18 | ||||
| 2026-04-29 | 13F | Police & Firemen's Retirement System of New Jersey | 33.918 | 0,00 | 43 | -33,85 | ||||
| 2026-02-11 | 13F | Los Angeles Capital Management Llc | 0 | -100,00 | 0 | |||||
| 2026-05-01 | 13F | Fifth Third Bancorp | 1.964 | 3 | ||||||
| 2026-02-12 | 13F | State Board Of Administration Of Florida Retirement System | 92.933 | 0,00 | 178 | -31,54 | ||||
| 2026-03-04 | 13F | SHP Wealth Management | 36 | 0 | ||||||
| 2026-02-10 | 13F | Axq Capital, Lp | 20.867 | 40 | ||||||
| 2026-04-06 | 13F | Versant Capital Management, Inc | 0 | -100,00 | 0 | |||||
| 2026-01-28 | 13F | Geneos Wealth Management Inc. | 468 | 0,00 | 1 | -100,00 | ||||
| 2026-02-17 | 13F | Aqr Capital Management Llc | 761.986 | -42,44 | 1.463 | -60,52 | ||||
| 2026-02-02 | 13F | Oppenheimer Asset Management Inc. | 0 | -100,00 | 0 | |||||
| 2026-02-13 | 13F | Boyar Asset Management Inc. | 25.603 | -9,29 | 49 | -37,97 | ||||
| 2026-01-14 | 13F | Kmg Fiduciary Partners, Llc | 0 | -100,00 | 0 | |||||
| 2026-02-13 | 13F | Jb Capital Partners Lp | 1.113.061 | 0,00 | 2.137 | -31,42 | ||||
| 2026-02-11 | 13F | Allianz Asset Management GmbH | 166.774 | 0,00 | 320 | -31,33 | ||||
| 2026-02-13 | 13F | Quinn Opportunity Partners LLC | 0 | -100,00 | 0 | |||||
| 2026-04-13 | 13F | True Wealth Design, LLC | 323 | 173,73 | 0 | |||||
| 2025-11-12 | 13F | Group One Trading, L.p. | Put | 0 | -100,00 | 0 | -100,00 | |||
| 2025-11-13 | 13F | Fuller & Thaler Asset Management, Inc. | 0 | -100,00 | 0 | |||||
| 2026-04-24 | 13F | UMA Financial Services, Inc. | 787 | 1 | ||||||
| 2026-02-06 | 13F | Global Retirement Partners, LLC | 14.410 | 28.720,00 | 28 | |||||
| 2026-02-17 | 13F | Citadel Advisors Llc | 826.452 | -28,46 | 1.587 | -50,96 | ||||
| 2026-02-12 | 13F | Counterpoint Mutual Funds LLC | 0 | -100,00 | 0 | |||||
| 2026-04-07 | 13F | Signaturefd, Llc | 86 | -48,19 | 0 | |||||
| 2026-02-17 | 13F | Citadel Advisors Llc | Call | 31.000 | -46,64 | 60 | -63,58 | |||
| 2026-02-17 | 13F | Citadel Advisors Llc | Put | 25.500 | 114,29 | 49 | 45,45 | |||
| 2026-04-28 | 13F | Flagship Harbor Advisors, Llc | 0 | -100,00 | 0 | |||||
| 2026-02-17 | 13F | IHT Wealth Management, LLC | 23.495 | 21,14 | 45 | -16,67 | ||||
| 2025-11-07 | 13F | Pallas Capital Advisors LLC | 0 | -100,00 | 0 | |||||
| 2026-02-17 | 13F | Boothbay Fund Management, Llc | 11.000 | 0,00 | 21 | -30,00 | ||||
| 2026-02-13 | 13F | Manufacturers Life Insurance Company, The | 0 | -100,00 | 0 | |||||
| 2026-02-17 | 13F | Bank Of America Corp /de/ | 488.589 | 6,04 | 938 | -27,29 | ||||
| 2026-02-05 | 13F | Bessemer Group Inc | 75.000 | 416.566,67 | 0 | |||||
| 2026-02-17 | 13F | Creative Planning | 110.097 | -56,37 | 211 | -70,11 | ||||
| 2026-02-13 | 13F | OMERS ADMINISTRATION Corp | 0 | -100,00 | 0 | |||||
| 2026-02-18 | 13F | Mackenzie Financial Corp | 0 | -100,00 | 0 | |||||
| 2026-02-13 | 13F | Squarepoint Ops LLC | 36.865 | 1,92 | 71 | -30,69 |
Other Listings
| DE:4C0 | 1,43 € |