Grundlæggende statistik
| Institutionelle ejere | 123 total, 116 long only, 1 short only, 6 long/short - change of 7,16% MRQ |
| Gennemsnitlig porteføljeallokering | 0.4291 % - change of -17,96% MRQ |
| Institutionelle aktier (lange) | 28.985.073 (ex 13D/G) - change of 4,50MM shares 7,61% MRQ |
| Institutionel værdi (lang) | $ 489.474 USD ($1000) |
Institutionelt ejerskab og aktionærer
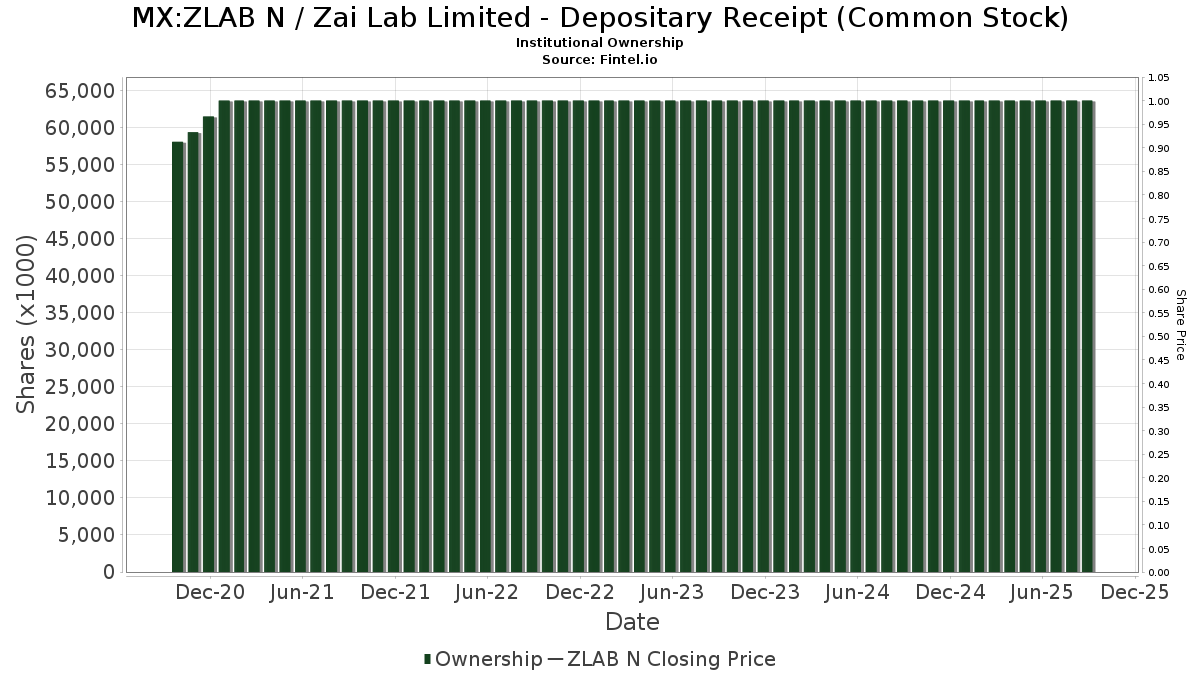
Zai Lab Limited - Depositary Receipt (Common Stock) (MX:ZLAB N) har 123 institutionelle ejere og aktionærer, der har indsendt 13D/G- eller 13F-formularer til Securities Exchange Commission (SEC). Disse institutioner har i alt 28,985,073 aktier. Største aktionærer omfatter Rtw Investments, Lp, Frazier Life Sciences Management, L.P., Clearbridge Investments, LLC, UBS Group AG, Citadel Advisors Llc, Fmr Llc, Bamco Inc /ny/, ADAR1 Capital Management, LLC, Rock Springs Capital Management LP, and Wellington Management Group Llp .
Zai Lab Limited - Depositary Receipt (Common Stock) (BMV:ZLAB N) institutionel ejerskabsstruktur viser aktuelle positioner i virksomheden efter institutioner og fonde, samt seneste ændringer i positionsstørrelse. Større aktionærer kan omfatte individuelle investorer, investeringsforeninger, hedgefonde eller institutioner. Skema 13D angiver, at investoren besidder (eller besidder) mere end 5 % af virksomheden og har til hensigt (eller har til hensigt at) aktivt at forfølge en ændring i forretningsstrategi. Skema 13G indikerer en passiv investering på over 5%.
Fondens stemningsscore
Fund Sentiment Score (fka Ownership Accumulation Score) finder de aktier, der bliver mest købt af fonde. Det er resultatet af en sofistikeret, multi-faktor kvantitativ model, der identificerer virksomheder med de højeste niveauer af institutionel akkumulering. Scoringsmodellen bruger en kombination af den samlede stigning i oplyste ejere, ændringerne i porteføljeallokeringer i disse ejere og andre målinger. Tallet går fra 0 til 100, hvor højere tal indikerer et højere niveau af akkumulering for sine jævnaldrende, og 50 er gennemsnittet.
Opdateringsfrekvens: Dagligt
Se Ownership Explorer, som giver en liste over højest rangerende virksomheder.
AI+ Ask Fintel’s AI assistant about Zai Lab Limited - Depositary Receipt (Common Stock).
Select a question to share a public post with an AI-crafted answer.
Thinking of good questions…
13F og NPORT arkivering
Detaljer om 13F-arkivering er gratis. Detaljer om NP-ansøgninger kræver et premium-medlemskab. Grønne rækker angiver nye positioner. Røde rækker angiver lukkede positioner. Klik på linket ikon for at se den fulde transaktionshistorik.
Opgrader
for at låse premium-data op og eksportere til Excel ![]() .
.
| Fil dato | Kilde | Investor | Type | Gennemsnitlig pris (Øst) |
Aktier | Δ Aktier (%) |
Rapporteret Værdi ($1000) |
Δ Værdi (%) |
Port Alloc (%) |
|
|---|---|---|---|---|---|---|---|---|---|---|
| 2026-02-13 | 13F | Marshall Wace, Llp | 231.802 | 4.089 | ||||||
| 2026-02-13 | 13F | Pinnacle Wealth Planning Services, Inc. | 201 | 4 | ||||||
| 2026-02-06 | 13F | Pnc Financial Services Group, Inc. | 302 | -69,34 | 5 | -84,85 | ||||
| 2026-02-12 | 13F | Hrt Financial Lp | 83.793 | 213,03 | 1 | |||||
| 2026-02-17 | 13F | LMR Partners LLP | 10.320 | -92,22 | 182 | -95,95 | ||||
| 2026-02-04 | 13F | Abc Arbitrage Sa | 0 | -100,00 | 0 | |||||
| 2026-02-19 | 13F | Invesco Ltd. | 30.594 | -20,65 | 540 | -58,73 | ||||
| 2026-02-13 | 13F | BNP Paribas Asset Management Holding S.A. | 65.814 | 1 | ||||||
| 2026-02-06 | 13F | EverSource Wealth Advisors, LLC | 203 | 15,34 | 4 | -40,00 | ||||
| 2026-02-17 | 13F | Russell Investments Group, Ltd. | 0 | -100,00 | 0 | |||||
| 2026-02-17 | 13F | Raymond James Financial Inc | 92.837 | -49,75 | 1.638 | -73,85 | ||||
| 2026-02-02 | 13F | Montag A & Associates Inc | 0 | -100,00 | 0 | |||||
| 2026-02-17 | 13F | Ameriflex Group, Inc. | 62 | -50,00 | 1 | -75,00 | ||||
| 2026-02-10 | 13F | Marshall & Sterling Wealth Advisors Inc. | 0 | -100,00 | 0 | |||||
| 2026-02-17 | 13F | B Group, Inc. | 400.000 | 0,00 | 7.056 | -47,95 | ||||
| 2026-02-09 | 13F | Hartland & Co., LLC | 9 | 0 | ||||||
| 2026-01-14 | 13F | Hennion & Walsh Asset Management, Inc. | 204.982 | 28,08 | 3.616 | -33,34 | ||||
| 2026-01-16 | 13F | Tema Etfs Llc | 0 | -100,00 | 0 | |||||
| 2026-02-13 | 13F | Wells Fargo & Company/mn | 93.140 | -46,82 | 1.643 | -72,33 | ||||
| 2026-02-13 | 13F | Transamerica Financial Advisors, Inc. | 73 | 1 | ||||||
| 2026-02-17 | 13F | Superstring Capital Management Lp | 196.853 | -1,88 | 3.472 | -48,93 | ||||
| 2025-11-14 | 13F | M&t Bank Corp | 0 | -100,00 | 0 | |||||
| 2026-02-09 | 13F | Legal & General Group Plc | 387.800 | 1,40 | 6.843 | -47,28 | ||||
| 2026-02-13 | 13F | Solstein Capital, LLC | 0 | -100,00 | 0 | |||||
| 2026-02-17 | 13F | Qube Research & Technologies Ltd | 107.651 | 1.899 | ||||||
| 2026-02-09 | 13F | Kingsview Wealth Management, LLC | 0 | -100,00 | 0 | |||||
| 2026-04-13 | 13F | IFP Advisors, Inc | 33 | -64,89 | 1 | -100,00 | ||||
| 2026-02-13 | 13F | Schroder Investment Management Group | 299.844 | 90,91 | 5.286 | 2,20 | ||||
| 2025-11-07 | 13F | Sierra Ocean, Llc | 0 | -100,00 | 0 | |||||
| 2026-02-17 | 13F | Price T Rowe Associates Inc /md/ | 602.954 | -36,44 | 11 | -68,75 | ||||
| 2026-02-12 | 13F | XY Capital Ltd | 202.304 | 3.569 | ||||||
| 2026-02-03 | 13F | SBI Securities Co., Ltd. | 40 | 90,48 | 1 | |||||
| 2026-04-15 | 13F | Gf Fund Management Co. Ltd. | 873 | 13,67 | 16 | 23,08 | ||||
| 2025-11-13 | 13F | Brown Brothers Harriman & Co | 0 | -100,00 | 0 | |||||
| 2026-02-11 | 13F | DCF Advisers, LLC | 97.500 | 1.720 | ||||||
| 2026-02-11 | 13F | Simplex Trading, Llc | Put | 4.500 | 87,50 | 79 | ||||
| 2026-02-11 | 13F | Simplex Trading, Llc | 173 | 3 | ||||||
| 2026-02-11 | 13F | DCF Advisers, LLC | Put | 1.500 | 26 | |||||
| 2026-02-10 | 13F | Bnp Paribas Arbitrage, Sa | 884 | 10,92 | 16 | -44,44 | ||||
| 2026-02-11 | 13F | Simplex Trading, Llc | Call | 7.100 | -78,81 | 125 | 12.400,00 | |||
| 2026-02-09 | 13F | Jefferies Financial Group Inc. | 0 | -100,00 | 0 | -100,00 | ||||
| 2026-02-13 | 13F | Citigroup Inc | 5.151 | -37,68 | 91 | -67,86 | ||||
| 2026-02-09 | 13F | Jefferies Financial Group Inc. | Put | 0 | -100,00 | 0 | -100,00 | |||
| 2026-02-03 | 13F | Privium Fund Management B.V. | 132.189 | 0,00 | 2.332 | -47,96 | ||||
| 2026-02-09 | 13F | Sectoral Asset Management Inc | 0 | -100,00 | 0 | |||||
| 2026-02-11 | 13F | Capital World Investors | 0 | -100,00 | 0 | |||||
| 2026-02-09 | 13F | Geode Capital Management, Llc | 23.879 | -52,79 | 421 | -75,44 | ||||
| 2026-02-17 | 13F | Wiley Bros.-aintree Capital, Llc | 0 | -100,00 | 0 | -100,00 | ||||
| 2026-02-13 | 13F | NEXTBio Capital Management LP | 163.362 | 2.882 | ||||||
| 2025-10-31 | 13F | Whittier Trust Co Of Nevada Inc | 0 | -100,00 | 0 | |||||
| 2026-02-17 | 13F | Advisor Group Holdings, Inc. | 319 | -3,92 | 6 | -54,55 | ||||
| 2025-11-07 | 13F | Smithfield Trust Co | 0 | -100,00 | 0 | |||||
| 2026-01-27 | 13F | Zurcher Kantonalbank (Zurich Cantonalbank) | 317 | -99,09 | 6 | -99,58 | ||||
| 2026-02-02 | 13F | Horizon Investments, LLC | 735 | -32,32 | 13 | -66,67 | ||||
| 2026-02-12 | 13F | Long Corridor Asset Management Ltd | 65.800 | 0,00 | 1.161 | -47,96 | ||||
| 2026-01-29 | 13F | Quent Capital, LLC | 230 | 0,00 | 4 | -42,86 | ||||
| 2025-11-07 | 13F | Alberta Investment Management Corp | 0 | -100,00 | 0 | |||||
| 2025-11-14 | 13F | T. Rowe Price Investment Management, Inc. | 0 | -100,00 | 0 | |||||
| 2026-04-08 | 13F | Legacy Wealth Asset Management, LLC | 24.925 | 56,73 | 469 | 67,14 | ||||
| 2026-03-26 | 13F | Leonteq Securities AG | 0 | -100,00 | 0 | |||||
| 2026-02-17 | 13F | Susquehanna International Group, Llp | 56.895 | 1.004 | ||||||
| 2026-02-17 | 13F | Susquehanna International Group, Llp | Put | 91.300 | 160,11 | 1.611 | 35,41 | |||
| 2025-11-04 | 13F | Penserra Capital Management LLC | 0 | -100,00 | 0 | |||||
| 2025-11-14 | 13F | Skopos Labs, Inc. | 0 | -100,00 | 0 | |||||
| 2026-02-11 | 13F | LPL Financial LLC | 31.114 | -63,44 | 549 | -81,00 | ||||
| 2026-02-17 | 13F | Tower Research Capital LLC (TRC) | 804 | 432,45 | 14 | 180,00 | ||||
| 2025-11-14 | 13F | Orbimed Advisors Llc | 0 | -100,00 | 0 | |||||
| 2025-11-14 | 13F | Public Employees Retirement System Of Ohio | 0 | -100,00 | 0 | |||||
| 2026-01-20 | 13F | AdvisorNet Financial, Inc | 0 | -100,00 | 0 | |||||
| 2026-02-10 | 13F | Td Asset Management Inc | 86.640 | -28,71 | 1.528 | -62,89 | ||||
| 2026-02-17 | 13F | Two Sigma Investments, Lp | 29.523 | 521 | ||||||
| 2026-02-12 | 13F | BlackRock, Inc. | 635.213 | 34,13 | 11.205 | -30,18 | ||||
| 2026-04-17 | 13F | Bell Investment Advisors, Inc | 26 | 62,50 | 0 | |||||
| 2026-02-05 | 13F | WealthPlan Investment Management, LLC | 36.761 | 0,00 | 648 | -47,95 | ||||
| 2026-02-06 | 13F | Gsa Capital Partners Llp | 0 | -100,00 | 0 | |||||
| 2025-11-14 | 13F | Axa S.a. | 0 | -100,00 | 0 | |||||
| 2026-01-26 | 13F | Private Trust Co Na | 206 | 0,00 | 4 | -50,00 | ||||
| 2026-02-10 | 13F | Envestnet Asset Management Inc | 151.318 | -39,96 | 2.669 | -68,75 | ||||
| 2026-01-28 | 13F | DekaBank Deutsche Girozentrale | 36.648 | 0,00 | 1 | -100,00 | ||||
| 2026-02-12 | 13F | Principal Securities, Inc. | 0 | -100,00 | 0 | |||||
| 2026-04-07 | 13F | Farther Finance Advisors, LLC | 957 | -27,99 | 19 | -17,39 | ||||
| 2026-02-17 | 13F | Royal Bank Of Canada | 14.757 | -30,95 | 260 | -64,09 | ||||
| 2026-02-13 | 13F | Resources Investment Advisors, LLC. | 0 | -100,00 | 0 | |||||
| 2026-02-17 | 13F | Rock Springs Capital Management LP | 811.546 | 2,57 | 14.316 | -46,61 | ||||
| 2026-02-04 | 13F | C WorldWide Group Holding A/S | 510.000 | 0,00 | 9 | -52,94 | ||||
| 2025-10-30 | 13F | Jennison Associates Llc | 0 | -100,00 | 0 | |||||
| 2026-02-17 | 13F | Bamco Inc /ny/ | 1.418.005 | 3,41 | 25.014 | -46,18 | ||||
| 2026-02-11 | 13F | Deutsche Bank Ag\ | 159 | 17,78 | 3 | -50,00 | ||||
| 2025-11-14 | 13F | Two Sigma Advisers, Lp | 0 | -100,00 | 0 | |||||
| 2026-01-07 | 13F | Retirement Wealth Solutions LLC | 0 | -100,00 | 0 | |||||
| 2025-11-14 | 13F | Lazard Asset Management Llc | 0 | -100,00 | 0 | |||||
| 2026-02-13 | 13F | Mml Investors Services, Llc | 34.421 | -24,32 | 607 | -60,61 | ||||
| 2026-02-23 | 13F | Virtu Financial LLC | 10.551 | 0 | ||||||
| 2026-01-23 | 13F | Assetmark, Inc | 233 | 3.228,57 | 4 | |||||
| 2026-02-13 | 13F | MAI Capital Management | 19 | 0 | ||||||
| 2026-02-06 | 13F | Larson Financial Group LLC | 1 | -83,33 | 0 | |||||
| 2025-11-14 | 13F | Wolverine Trading, Llc | Put | 21.700 | 0,00 | 715 | -5,18 | |||
| 2026-02-12 | 13F | Brinker Capital Investments, LLC | 20.849 | -57,03 | 368 | -77,68 | ||||
| 2026-02-17 | 13F | Bank Of America Corp /de/ | 388.769 | 173,06 | 6.858 | 42,11 | ||||
| 2026-02-17 | 13F | Woodline Partners LP | 0 | -100,00 | 0 | -100,00 | ||||
| 2026-02-13 | 13F | State Street Corp | 136.428 | 0,07 | 2.407 | -47,92 | ||||
| 2026-02-02 | 13F | Truist Financial Corp | 0 | -100,00 | 0 | |||||
| 2026-02-17 | 13F | Ancora Advisors, LLC | 15 | 0,00 | 0 | |||||
| 2026-02-17 | 13F | Virtus Investment Advisers, Inc. | 38.457 | 272,36 | 678 | 93,71 | ||||
| 2026-02-12 | 13F | CIBC Private Wealth Group, LLC | 21 | 0 | ||||||
| 2026-02-12 | 13F | Jane Street Group, Llc | Put | 195.500 | 123,17 | 3.449 | 16,17 | |||
| 2026-02-12 | 13F | Jane Street Group, Llc | 382.062 | 6.740 | ||||||
| 2025-11-12 | 13F | Keystone Investors Pte Ltd | 0 | -100,00 | 0 | |||||
| 2026-02-17 | 13F | Susquehanna International Group, Llp | Call | 0 | -100,00 | 0 | ||||
| 2026-04-20 | 13F | Ronald Blue Trust, Inc. | 5 | 0,00 | 0 | |||||
| 2026-01-05 | 13F | Park Avenue Securities Llc | 0 | -100,00 | 0 | |||||
| 2025-11-14 | 13F | Point72 Asset Management, L.P. | 0 | -100,00 | 0 | -100,00 | ||||
| 2026-02-17 | 13F | Persistent Asset Partners Ltd | 12.339 | 218 | ||||||
| 2026-02-11 | 13F | Cerity Partners LLC | 0 | -100,00 | 0 | |||||
| 2026-02-12 | 13F | Alps Advisors Inc | 92.107 | 75,06 | 1.625 | -8,92 | ||||
| 2026-02-09 | 13F | Huntington National Bank | 21 | 0 | ||||||
| 2026-02-17 | 13F | NEOS Investment Management LLC | 75.165 | 21,10 | 1.326 | -36,99 | ||||
| 2026-02-17 | 13F | Rtw Investments, Lp | 6.959.032 | 203,71 | 122.757 | 58,08 | ||||
| 2026-01-26 | 13F | Mirae Asset Global Investments Co., Ltd. | 103.118 | -1,88 | 1.819 | -48,92 | ||||
| 2026-01-26 | 13F | Cwm, Llc | 979 | 121,49 | 0 | |||||
| 2026-02-05 | 13F | Td Private Client Wealth Llc | 56 | -22,22 | 1 | -100,00 | ||||
| 2026-02-17 | 13F | Alliancebernstein L.p. | 0 | -100,00 | 0 | |||||
| 2026-04-16 | 13F | SG Americas Securities, LLC | 5.799 | -44,22 | 0 | |||||
| 2026-02-13 | 13F | Walleye Capital LLC | 373.399 | 6.587 | ||||||
| 2026-02-17 | 13F | Citadel Advisors Llc | Put | 46.400 | 45,91 | 818 | -24,05 | |||
| 2026-02-17 | 13F | Citadel Advisors Llc | Call | 15.300 | -35,98 | 270 | -66,75 | |||
| 2026-02-13 | 13F | Infini Capital Management Ltd | 0 | -100,00 | 0 | |||||
| 2026-02-13 | 13F | Peak6 Llc | 0 | -100,00 | 0 | |||||
| 2026-02-10 | 13F | Daiwa Securities Group Inc. | 150 | 0,00 | 0 | |||||
| 2026-02-17 | 13F | Citadel Advisors Llc | 1.687.846 | 71,00 | 29.774 | -10,99 | ||||
| 2025-11-13 | 13F | Connor, Clark & Lunn Investment Management Ltd. | 0 | -100,00 | 0 | |||||
| 2026-02-17 | 13F | ADAR1 Capital Management, LLC | 1.246.520 | 43,48 | 21.989 | -25,32 | ||||
| 2026-02-04 | 13F | NAN FUNG TRINITY (HK) Ltd | 269.975 | 0,00 | 4.762 | -47,95 | ||||
| 2025-11-13 | 13F | Renaissance Technologies Llc | 0 | -100,00 | 0 | |||||
| 2026-02-11 | 13F | Group One Trading, L.p. | Put | 28.200 | 347,62 | 497 | 133,33 | |||
| 2025-11-14 | 13F | StemPoint Capital LP | 0 | -100,00 | 0 | -100,00 | ||||
| 2026-02-11 | 13F | Group One Trading, L.p. | 19.032 | 336 | ||||||
| 2026-02-12 | 13F | Jasper Ridge Partners, L.P. | 0 | -100,00 | 0 | |||||
| 2026-02-12 | 13F | Jane Street Group, Llc | Call | 0 | -100,00 | 0 | -100,00 | |||
| 2026-01-29 | 13F | China Universal Asset Management Co., Ltd. | 6.380 | -23,87 | 113 | -60,42 | ||||
| 2026-02-12 | 13F | Barometer Capital Management Inc. | 0 | -100,00 | 0 | |||||
| 2025-11-14 | 13F | Cubist Systematic Strategies, LLC | 0 | -100,00 | 0 | -100,00 | ||||
| 2026-02-17 | 13F | Ameriprise Financial Inc | 181.133 | 3.195 | ||||||
| 2025-11-14 | 13F | Point72 Hong Kong Ltd | 0 | -100,00 | 0 | -100,00 | ||||
| 2026-02-11 | 13F | Marks Group Wealth Management, Inc | 16.278 | -1,48 | 287 | -48,66 | ||||
| 2026-02-13 | 13F | Manufacturers Life Insurance Company, The | 0 | -100,00 | 0 | |||||
| 2026-02-14 | 13F | Rockefeller Capital Management L.P. | 8 | 0 | ||||||
| 2026-02-13 | 13F | Polymer Capital Management (HK) LTD | 0 | -100,00 | 0 | |||||
| 2026-02-17 | 13F | Schonfeld Strategic Advisors LLC | 40.005 | 706 | ||||||
| 2026-02-17 | 13F | Cetera Investment Advisers | 0 | -100,00 | 0 | |||||
| 2026-02-10 | 13F/A | Northwestern Mutual Wealth Management Co | 202 | 0,00 | 4 | -50,00 | ||||
| 2026-01-30 | 13F | NJ State Employees Deferred Compensation Plan | 0 | -100,00 | 0 | |||||
| 2026-02-17 | 13F | Northern Trust Corp | 96.442 | -33,95 | 1.701 | -65,62 | ||||
| 2026-02-13 | 13F | JustInvest LLC | 0 | -100,00 | 0 | |||||
| 2026-02-11 | 13F | Group One Trading, L.p. | Call | 0 | -100,00 | 0 | -100,00 | |||
| 2026-04-23 | 13F | Oppenheimer Asset Management Inc. | 0 | -100,00 | 0 | |||||
| 2026-02-17 | 13F | D. E. Shaw & Co., Inc. | 238.609 | 595,86 | 4.209 | 262,22 | ||||
| 2025-11-07 | 13F | Wealth Alliance | 0 | -100,00 | 0 | -100,00 | ||||
| 2026-02-13 | 13F | SRS Capital Advisors, Inc. | 409 | 7 | ||||||
| 2026-02-05 | 13F | Allworth Financial LP | 50 | 0,00 | 1 | -100,00 | ||||
| 2026-02-12 | 13F | Bank Of Montreal /can/ | 22.099 | -31,02 | 390 | -64,15 | ||||
| 2025-11-07 | 13F/A | Abn Amro Investment Solutions | 51.069 | -10,16 | 1.241 | -21,26 | ||||
| 2026-02-13 | 13F | Rhumbline Advisers | 281 | -3,44 | 5 | -55,56 | ||||
| 2025-11-13 | 13F | Jump Financial, LLC | 0 | -100,00 | 0 | |||||
| 2026-02-05 | 13F | Atria Investments Llc | 0 | -100,00 | 0 | |||||
| 2026-02-11 | 13F | Erste Asset Management GmbH | 15.100 | 269 | ||||||
| 2026-01-29 | 13F | UBS Group AG | 1.782.252 | 481,38 | 31.439 | 202,61 | ||||
| 2025-11-06 | 13F | Candriam Luxembourg S.C.A. | 0 | -100,00 | 0 | |||||
| 2026-02-11 | 13F | Jpmorgan Chase & Co | 293.703 | 3.022,17 | 5.181 | 1.528,93 | ||||
| 2026-02-02 | 13F | Principal Financial Group Inc | 101.782 | -2,40 | 1.795 | -49,21 | ||||
| 2026-02-17 | 13F | Boothbay Fund Management, Llc | 0 | -100,00 | 0 | |||||
| 2026-01-30 | 13F | Us Bancorp \de\ | 17.771 | -28,23 | 313 | -62,69 | ||||
| 2026-02-13 | 13F | Smartleaf Asset Management LLC | 331 | 81,87 | 6 | 0,00 | ||||
| 2026-02-17 | 13F | Wellington Management Group Llp | 752.858 | -56,19 | 13.280 | -77,20 | ||||
| 2026-02-13 | 13F | Frazier Life Sciences Management, L.P. | 1.902.320 | 16,90 | 33.557 | -39,15 | ||||
| 2026-02-17 | 13F | Advisory Services Network, LLC | 0 | -100,00 | 0 | |||||
| 2026-02-13 | 13F | Gts Securities Llc | 0 | -100,00 | 0 | |||||
| 2026-02-17 | 13F | Janus Henderson Group Plc | 0 | -100,00 | 0 | |||||
| 2026-02-26 | 13F | TD Capital Management LLC | 0 | -100,00 | 0 | |||||
| 2026-02-10 | 13F | Goldman Sachs Group Inc | 149.434 | 81,84 | 2.636 | -5,35 | ||||
| 2026-04-23 | 13F | North Star Investment Management Corp. | 0 | -100,00 | 0 | |||||
| 2026-02-12 | 13F | Campbell & CO Investment Adviser LLC | 170.117 | 3.001 | ||||||
| 2026-02-17 | 13F | Fmr Llc | 1.440.406 | -69,36 | 25.409 | -84,05 | ||||
| 2026-02-13 | 13F | Stifel Financial Corp | 0 | -100,00 | 0 | |||||
| 2026-02-13 | 13F | Hudson Bay Capital Management LP | 90.000 | 1.588 | ||||||
| 2026-02-13 | 13F | Headlands Technologies LLC | 15.846 | 280 | ||||||
| 2026-03-03 | 13F/A | Caitong International Asset Management Co., Ltd | 325 | 6 | ||||||
| 2025-11-14 | 13F | Diadema Partners Lp | 0 | -100,00 | 0 | |||||
| 2026-01-29 | 13F | Pictet Asset Management Holding SA | 0 | -100,00 | 0 | |||||
| 2026-02-10 | 13F | Bank of New York Mellon Corp | 0 | -100,00 | 0 | |||||
| 2026-02-11 | 13F | Allianz Asset Management GmbH | 0 | -100,00 | 0 | |||||
| 2026-02-17 | 13F | Quantinno Capital Management LP | 10.085 | 16,82 | 178 | -39,38 | ||||
| 2025-11-14 | 13F | AXA Investment Managers S.A. | 65.814 | 2.230 | ||||||
| 2026-02-11 | 13F | Clearbridge Investments, LLC | 1.808.035 | -48,63 | 31.894 | -73,26 | ||||
| 2026-02-13 | 13F | Parkside Financial Bank & Trust | 213 | 4 | ||||||
| 2026-02-13 | 13F | Icon Wealth Advisors, LLC | 0 | -100,00 | 0 | |||||
| 2026-02-17 | 13F | Balyasny Asset Management Llc | 0 | -100,00 | 0 | |||||
| 2025-11-13 | 13F | Hsbc Holdings Plc | 0 | -100,00 | 0 | |||||
| 2026-02-13 | 13F/A | Virtus ETF Advisers LLC | 0 | -100,00 | 0 | |||||
| 2026-02-11 | 13F | IvyRock Asset Management (HK) Ltd | 14.979 | -84,21 | 264 | -91,79 | ||||
| 2026-02-13 | 13F | OMERS ADMINISTRATION Corp | 0 | -100,00 | 0 | -100,00 | ||||
| 2026-02-13 | 13F | Morgan Stanley | 289.705 | 141,66 | 5.110 | 25,80 | ||||
| 2025-11-13 | 13F | Canada Pension Plan Investment Board | 0 | -100,00 | 0 | -100,00 | ||||
| 2025-11-13 | 13F | Riggs Asset Managment Co. Inc. | 0 | -100,00 | 0 | |||||
| 2026-02-06 | 13F | Profund Advisors Llc | 0 | -100,00 | 0 | |||||
| 2026-02-13 | 13F | Ubs Asset Management Americas Inc | 157 | 3 | ||||||
| 2026-02-12 | 13F | Dimensional Fund Advisors Lp | 173.946 | 272,60 | 3.068 | 94,67 | ||||
| 2026-01-16 | 13F | Crewe Advisors LLC | 12 | 0 | ||||||
| 2026-02-05 | 13F | Bessemer Group Inc | 145 | 0 | ||||||
| 2026-02-12 | 13F | DRW Securities, LLC | 30.862 | 544 | ||||||
| 2026-02-06 | 13F | Global Retirement Partners, LLC | 20 | -56,52 | 0 | -100,00 | ||||
| 2026-02-13 | 13F | Barclays Plc | 1 | -99,86 | 0 | -100,00 | ||||
| 2026-02-17 | 13F | MPM Oncology Impact Management LP | 0 | -100,00 | 0 |