Grundlæggende statistik
| Institutionelle ejere | 245 total, 226 long only, 1 short only, 18 long/short - change of 11.900,00% MRQ |
| Gennemsnitlig porteføljeallokering | 0.3438 % - change of -36,30% MRQ |
| Institutionelle aktier (lange) | 117.413.800 (ex 13D/G) - change of 104,59MM shares 49.921,73% MRQ |
| Institutionel værdi (lang) | $ 2.277.126 USD ($1000) |
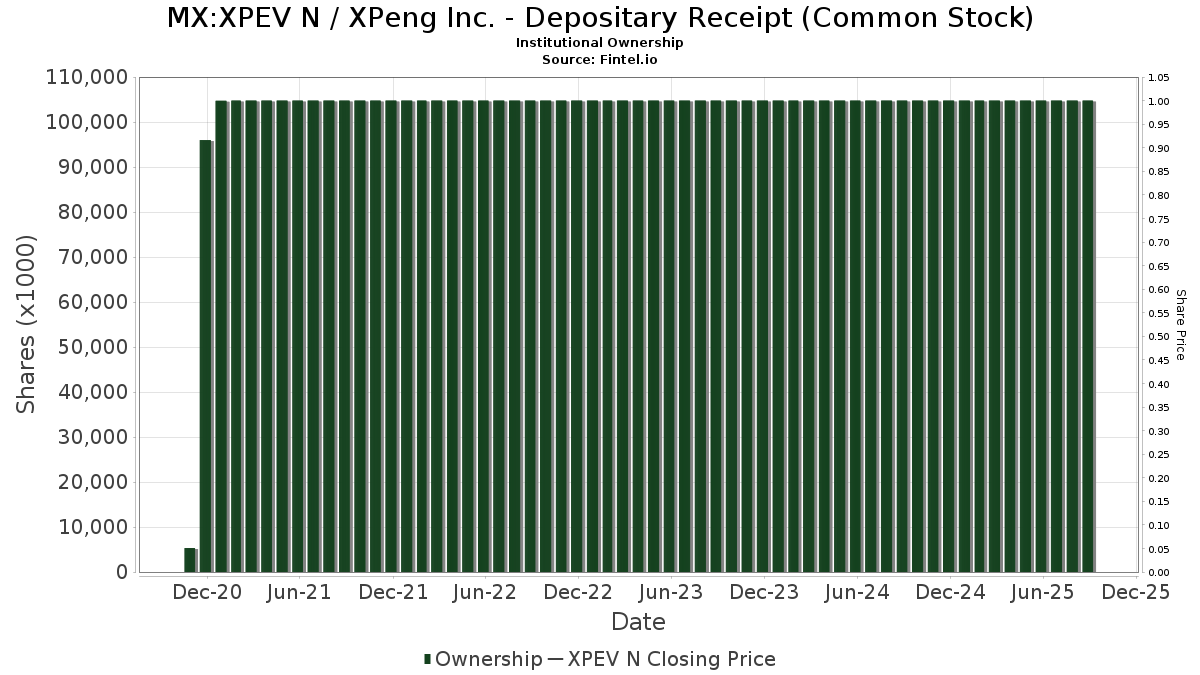
Institutionelt ejerskab og aktionærer
XPeng Inc. - Depositary Receipt (Common Stock) (MX:XPEV N) har 245 institutionelle ejere og aktionærer, der har indsendt 13D/G- eller 13F-formularer til Securities Exchange Commission (SEC). Disse institutioner har i alt 117,413,800 aktier. Største aktionærer omfatter Alibaba Group Holding Ltd, Primecap Management Co/ca/, TMT General Partner Ltd, Ghisallo Capital Management LLC, Morgan Stanley, UBS Group AG, Susquehanna International Group, Llp, Primavera Capital Management Ltd, Goldman Sachs Group Inc, and Bank Of America Corp /de/ .
XPeng Inc. - Depositary Receipt (Common Stock) (BMV:XPEV N) institutionel ejerskabsstruktur viser aktuelle positioner i virksomheden efter institutioner og fonde, samt seneste ændringer i positionsstørrelse. Større aktionærer kan omfatte individuelle investorer, investeringsforeninger, hedgefonde eller institutioner. Skema 13D angiver, at investoren besidder (eller besidder) mere end 5 % af virksomheden og har til hensigt (eller har til hensigt at) aktivt at forfølge en ændring i forretningsstrategi. Skema 13G indikerer en passiv investering på over 5%.
Fondens stemningsscore
Fund Sentiment Score (fka Ownership Accumulation Score) finder de aktier, der bliver mest købt af fonde. Det er resultatet af en sofistikeret, multi-faktor kvantitativ model, der identificerer virksomheder med de højeste niveauer af institutionel akkumulering. Scoringsmodellen bruger en kombination af den samlede stigning i oplyste ejere, ændringerne i porteføljeallokeringer i disse ejere og andre målinger. Tallet går fra 0 til 100, hvor højere tal indikerer et højere niveau af akkumulering for sine jævnaldrende, og 50 er gennemsnittet.
Opdateringsfrekvens: Dagligt
Se Ownership Explorer, som giver en liste over højest rangerende virksomheder.
AI+ Ask Fintel’s AI assistant about XPeng Inc. - Depositary Receipt (Common Stock).
Select a question to share a public post with an AI-crafted answer.
Thinking of good questions…
13F og NPORT arkivering
Detaljer om 13F-arkivering er gratis. Detaljer om NP-ansøgninger kræver et premium-medlemskab. Grønne rækker angiver nye positioner. Røde rækker angiver lukkede positioner. Klik på linket ikon for at se den fulde transaktionshistorik.
Opgrader
for at låse premium-data op og eksportere til Excel ![]() .
.
| Fil dato | Kilde | Investor | Type | Gennemsnitlig pris (Øst) |
Aktier | Δ Aktier (%) |
Rapporteret Værdi ($1000) |
Δ Værdi (%) |
Port Alloc (%) |
|
|---|---|---|---|---|---|---|---|---|---|---|
| 2026-02-17 | 13F | LMR Partners LLP | Call | 385.000 | 0,00 | 7.808 | -13,41 | |||
| 2026-02-09 | 13F | Legal & General Group Plc | 692.554 | 30,09 | 14.046 | 12,65 | ||||
| 2026-02-17 | 13F | LMR Partners LLP | 100.000 | 2.028 | ||||||
| 2026-02-06 | 13F | Bare Financial Services, Inc | 101 | 2 | ||||||
| 2026-02-17 | 13F | LMR Partners LLP | Put | 385.000 | 0,00 | 7.808 | -13,41 | |||
| 2025-11-14 | 13F | XTX Topco Ltd | 0 | -100,00 | 0 | -100,00 | ||||
| 2026-04-15 | 13F | Gf Fund Management Co. Ltd. | 0 | -100,00 | 0 | |||||
| 2026-02-17 | 13F | Raymond James Financial Inc | 18.992 | -31,74 | 385 | -40,86 | ||||
| 2025-11-14 | 13F | Lazard Asset Management Llc | 0 | -100,00 | 0 | |||||
| 2026-04-22 | 13F | Pasadena Private Wealth, LLC | Call | 0 | -100,00 | 0 | -100,00 | |||
| 2026-02-13 | 13F | Caitong International Asset Management Co., Ltd | 2.708 | 159,14 | 55 | 125,00 | ||||
| 2026-02-13 | 13F | Barclays Plc | Put | 0 | -100,00 | 0 | -100,00 | |||
| 2026-02-13 | 13F | First Trust Advisors Lp | 0 | -100,00 | 0 | |||||
| 2026-02-17 | 13F | Dv Equities, Llc | 23 | 0 | ||||||
| 2026-02-17 | 13F | Advisory Services Network, LLC | 0 | -100,00 | 0 | |||||
| 2025-11-14 | 13F | Cetera Investment Advisers | Put | 0 | -100,00 | 0 | -100,00 | |||
| 2025-11-14 | 13F | ExodusPoint Capital Management, LP | 0 | -100,00 | 0 | |||||
| 2026-04-13 | 13F | Creative Financial Designs Inc /adv | 700 | 0,00 | 12 | -21,43 | ||||
| 2026-04-21 | 13F | PDS Planning, Inc | 11.983 | 1,73 | 205 | -13,87 | ||||
| 2026-02-17 | 13F | DZ BANK AG Deutsche Zentral Genossenschafts Bank, Frankfurt am Main | 8.000 | 162 | ||||||
| 2026-02-13 | 13F | Ubs Asset Management Americas Inc | 190 | 4 | ||||||
| 2026-02-13 | 13F | Y-Intercept (Hong Kong) Ltd | 0 | -100,00 | 0 | |||||
| 2026-02-17 | 13F | Two Sigma Advisers, Lp | 18.600 | -91,60 | 377 | -92,73 | ||||
| 2026-02-06 | 13F | Pnc Financial Services Group, Inc. | 18.571 | 0,09 | 377 | -13,36 | ||||
| 2026-02-20 | 13F/A | Capital Markets Trading UK LLP | 90.823 | 229,08 | 2 | |||||
| 2026-02-06 | 13F | EverSource Wealth Advisors, LLC | 3.906 | 44,99 | 79 | 25,40 | ||||
| 2026-02-13 | 13F | American Century Companies Inc | 32.679 | 2,17 | 663 | -11,62 | ||||
| 2026-02-06 | 13F | Profund Advisors Llc | 92.744 | -20,23 | 1.881 | -30,96 | ||||
| 2026-04-20 | 13F | Jfs Wealth Advisors, Llc | 597 | -4,17 | 10 | -16,67 | ||||
| 2026-02-03 | 13F | Winch Advisory Services, LLC | 28 | 0,00 | 1 | |||||
| 2026-02-17 | 13F | Two Sigma Securities, Llc | 0 | -100,00 | 0 | |||||
| 2026-02-13 | 13F | Wexford Capital Lp | 34.614 | 5,50 | 702 | -8,72 | ||||
| 2026-01-28 | 13F | CAPROCK Group, Inc. | 15.037 | 305 | ||||||
| 2026-02-17 | 13F | SIH Partners, LLLP | 2.226.625 | 799,23 | 45.156 | 678,67 | ||||
| 2026-02-19 | 13F | Invesco Ltd. | 1.278.673 | 114,53 | 25.931 | 85,77 | ||||
| 2026-02-17 | 13F | Massar Capital Management, LP | 38.300 | 0,00 | 777 | -13,39 | ||||
| 2026-02-13 | 13F | Van Eck Associates Corp | 149.575 | -16,55 | 3 | -25,00 | ||||
| 2026-02-13 | 13F | Pinnacle Wealth Planning Services, Inc. | 4.705 | 95 | ||||||
| 2026-04-22 | 13F | Pasadena Private Wealth, LLC | 10.365 | 0,00 | 177 | -15,71 | ||||
| 2026-02-13 | 13F | Golden State Wealth Management, LLC | 250 | 0,00 | 5 | 0,00 | ||||
| 2026-01-21 | 13F | Flagship Harbor Advisors, Llc | 100 | 2 | ||||||
| 2026-01-09 | 13F | 180 Wealth Advisors, Llc | 0 | -100,00 | 0 | |||||
| 2026-02-03 | 13F | Ballentine Partners, LLC | 25.342 | 1,44 | 514 | -12,31 | ||||
| 2025-11-14 | 13F | Point72 Europe (London) LLP | 107.493 | 71,44 | 2.517 | 124,53 | ||||
| 2026-02-13 | 13F | Headlands Technologies LLC | 122.037 | 319,92 | 2.475 | 263,82 | ||||
| 2026-04-24 | 13F | Abacus Wealth Partners, LLC | 46.504 | -11,03 | 796 | -25,00 | ||||
| 2026-04-15 | 13F | Exchange Traded Concepts, Llc | 1.465.595 | 42,16 | 25.076 | 19,94 | ||||
| 2025-10-30 | 13F | Investment Management Corp /va/ /adv | 0 | -100,00 | 0 | |||||
| 2026-04-06 | 13F | Versant Capital Management, Inc | 51 | 1 | ||||||
| 2026-02-11 | 13F | MCF Advisors LLC | 4.606 | 0,00 | 93 | -13,08 | ||||
| 2026-02-17 | 13F | Point72 Asset Management, L.P. | 160.378 | 3.252 | ||||||
| 2025-11-14 | 13F | Voloridge Investment Management, Llc | 0 | -100,00 | 0 | |||||
| 2026-02-17 | 13F | DV Trading LLC | 19 | 0 | ||||||
| 2026-02-09 | 13F | Hantz Financial Services, Inc. | 13.010 | 18,62 | 0 | |||||
| 2026-02-17 | 13F | Point72 Asset Management, L.P. | Put | 100.600 | 0,00 | 2.040 | -13,41 | |||
| 2026-01-21 | 13F | Step Capital Management Pte. Ltd. | 105.000 | 2.129 | ||||||
| 2026-02-17 | 13F | Point72 Asset Management, L.P. | Call | 93.500 | 36,30 | 1.896 | 18,06 | |||
| 2026-02-17 | 13F | Boothbay Fund Management, Llc | 23.288 | 42,09 | 472 | 23,24 | ||||
| 2025-10-28 | 13F | Nations Financial Group Inc, /ia/ /adv | 0 | -100,00 | 0 | |||||
| 2026-04-24 | 13F | Key FInancial Inc | 74 | 0,00 | 1 | 0,00 | ||||
| 2026-04-13 | 13F | IFP Advisors, Inc | 271 | 0,00 | 5 | -20,00 | ||||
| 2025-11-14 | 13F | Bayesian Capital Management, LP | 0 | -100,00 | 0 | |||||
| 2026-01-27 | 13F | TD Waterhouse Canada Inc. | 3.080 | 0,00 | 62 | -15,07 | ||||
| 2026-02-13 | 13F | Pathstone Holdings, LLC | 30.679 | -20,86 | 622 | -31,42 | ||||
| 2026-02-17 | 13F | Symmetry Peak Management Llc | Call | 0 | -100,00 | 0 | ||||
| 2026-02-17 | 13F | Cresset Asset Management, LLC | 12.576 | -3,20 | 255 | -16,12 | ||||
| 2026-02-17 | 13F | Trexquant Investment LP | 0 | -100,00 | 0 | |||||
| 2026-04-22 | 13F | Stone House Investment Management, LLC | 36 | 100,00 | 1 | |||||
| 2026-02-13 | 13F | Wells Fargo & Company/mn | 3.551 | -42,36 | 72 | -50,00 | ||||
| 2026-04-21 | 13F | Maseco Llp | 299 | 0,00 | 5 | -16,67 | ||||
| 2025-11-12 | 13F | HAP Trading, LLC | Call | 22.200 | 54 | |||||
| 2026-04-17 | 13F | AdvisorNet Financial, Inc | 0 | -100,00 | 0 | |||||
| 2026-04-24 | 13F | TT International Asset Management LTD | 0 | -100,00 | 0 | |||||
| 2025-11-12 | 13F | HAP Trading, LLC | Put | 11.300 | 2 | |||||
| 2026-04-21 | 13F | Venturi Wealth Management, LLC | 16.481 | 66,31 | 282 | 40,50 | ||||
| 2026-02-17 | 13F | MIRAE ASSET GLOBAL ETFS HOLDINGS Ltd. | 309.519 | 6,65 | 6.403 | -5,49 | ||||
| 2026-02-11 | 13F | Primecap Management Co/ca/ | 12.801.087 | -7,81 | 259.606 | -20,17 | ||||
| 2026-01-27 | 13F | Belpointe Asset Management LLC | 0 | -100,00 | 0 | |||||
| 2026-02-14 | 13F | Taikang Asset Management (Hong Kong) Co Ltd | 308.737 | 6.261 | ||||||
| 2025-12-16 | 13F | Garde Capital, Inc. | 0 | -100,00 | 0 | -100,00 | ||||
| 2026-04-22 | 13F | Patriot Financial Group Insurance Agency, LLC | 18.700 | 320 | ||||||
| 2026-02-17 | 13F | Qube Research & Technologies Ltd | Put | 15.200 | 15.100,00 | 308 | 15.300,00 | |||
| 2026-02-12 | 13F | Ci Investments Inc. | 0 | -100,00 | 0 | |||||
| 2026-02-17 | 13F | Equitable Holdings, Inc. | 11.475 | -53,92 | 233 | -60,21 | ||||
| 2026-02-17 | 13F | Qube Research & Technologies Ltd | Call | 103.500 | 4.040,00 | 2.099 | 3.517,24 | |||
| 2026-02-13 | 13F | Morgan Stanley | 5.855.148 | 14,98 | 118.742 | -0,44 | ||||
| 2026-02-10 | 13F | Bnp Paribas Arbitrage, Sa | 294.564 | -69,25 | 5.974 | -73,37 | ||||
| 2025-11-10 | 13F | New Millennium Group LLC | 0 | -100,00 | 0 | -100,00 | ||||
| 2026-04-17 | 13F | CENTRAL TRUST Co | 0 | -100,00 | 0 | |||||
| 2026-02-03 | 13F | Sequoia Financial Advisors, LLC | 18.036 | -0,84 | 366 | -14,12 | ||||
| 2026-02-11 | 13F | West Family Investments, Inc. | 11.813 | 32,09 | 240 | 14,35 | ||||
| 2026-02-18 | 13F | GWM Advisors LLC | 0 | -100,00 | 0 | |||||
| 2026-02-18 | 13F | Mackenzie Financial Corp | 144.928 | 1,88 | 3.078 | -7,60 | ||||
| 2026-01-30 | 13F | TMT General Partner Ltd | 10.285.837 | -59,53 | 208.597 | -29,92 | ||||
| 2026-02-17 | 13F | Caption Management, LLC | 0 | -100,00 | 0 | |||||
| 2026-02-17 | 13F | Weiss Asset Management LP | 0 | -100,00 | 0 | -100,00 | ||||
| 2026-02-17 | 13F | Tower Research Capital LLC (TRC) | 1.207 | -93,78 | 24 | -94,71 | ||||
| 2026-02-11 | 13F | Parallel Advisors, LLC | 10.293 | 6,02 | 209 | -8,37 | ||||
| 2026-02-13 | 13F | Citigroup Inc | 121.177 | -48,61 | 2.457 | -55,51 | ||||
| 2026-01-27 | 13F | Zurcher Kantonalbank (Zurich Cantonalbank) | 11.627 | 73,38 | 236 | 49,68 | ||||
| 2026-02-17 | 13F | Advisor Group Holdings, Inc. | 4.688 | 1,38 | 95 | -7,77 | ||||
| 2025-11-10 | 13F | Citigroup Inc | Put | 0 | -100,00 | 0 | -100,00 | |||
| 2026-02-13 | 13F | Toroso Investments, LLC | 72.176 | 59,09 | 1.464 | 37,76 | ||||
| 2026-04-03 | 13F | Global Wealth Strategies & Associates | 11 | 0,00 | 0 | |||||
| 2026-03-06 | 13F | Hsbc Holdings Plc | 198.534 | 190,56 | 4.026 | 151,63 | ||||
| 2026-04-14 | 13F | Nbc Securities, Inc. | 185 | 3 | ||||||
| 2026-02-13 | 13F | Macquarie Group Ltd | 20.287 | -50,00 | 411 | -50,90 | ||||
| 2026-02-17 | 13F | Man Group plc | 490.173 | -44,82 | 9.941 | -52,22 | ||||
| 2025-11-05 | 13F | Worm Capital, Llc | 0 | -100,00 | 0 | -100,00 | ||||
| 2026-01-20 | 13F | Nvwm, Llc | 61 | 1 | ||||||
| 2026-02-17 | 13F | Royal Bank Of Canada | 13.060 | -15,23 | 264 | -26,67 | ||||
| 2026-01-28 | 13F | DekaBank Deutsche Girozentrale | 1.100.000 | 0,00 | 10 | -65,38 | ||||
| 2026-02-10 | 13F | Savant Capital, LLC | 13.389 | -3,84 | 272 | -16,87 | ||||
| 2026-02-13 | 13F | Primavera Capital Management Ltd | 3.306.567 | 0,00 | 67.057 | -13,41 | ||||
| 2025-11-14 | 13F | J. Goldman & Co LP | 0 | -100,00 | 0 | |||||
| 2026-02-03 | 13F | Strengthening Families & Communities, LLC | 500 | 10 | ||||||
| 2026-02-10 | 13F | Fideuram Asset Management (Ireland) dac | 91.098 | 1.815 | ||||||
| 2026-01-23 | 13F | Bridgewater Advisors Inc. | 9.868 | 4,31 | 201 | -11,11 | ||||
| 2026-02-12 | 13F | Steward Partners Investment Advisory, Llc | 830 | -1,78 | 17 | -15,79 | ||||
| 2026-02-17 | 13F | Balyasny Asset Management Llc | Put | 174.000 | 26,55 | 3.529 | 9,57 | |||
| 2026-02-17 | 13F | Susquehanna International Group, Llp | 2.201.547 | -11,33 | 44.647 | -23,22 | ||||
| 2026-02-17 | 13F | Balyasny Asset Management Llc | 190.073 | 3.855 | ||||||
| 2026-02-17 | 13F | Balyasny Asset Management Llc | Call | 529.000 | 47,19 | 10.728 | 27,46 | |||
| 2026-02-13 | 13F | Knollwood Investment Advisory, LLC | 11.250 | -21,60 | 228 | -32,14 | ||||
| 2026-01-26 | 13F | PFG Investments, LLC | 10.998 | 5,01 | 223 | -8,98 | ||||
| 2025-11-14 | 13F | Public Employees Retirement System Of Ohio | 0 | -100,00 | 0 | -100,00 | ||||
| 2025-11-14 | 13F | Strategic Wealth Partners, Ltd. | 211 | 427,50 | 5 | |||||
| 2026-02-14 | 13F | Rockefeller Capital Management L.P. | 3.125 | 0,00 | 63 | -13,70 | ||||
| 2026-02-03 | 13F | SBI Securities Co., Ltd. | 16.535 | 7,73 | 335 | -6,69 | ||||
| 2026-04-17 | 13F | Bell Investment Advisors, Inc | 642 | 5,42 | 11 | -16,67 | ||||
| 2026-02-17 | 13F | Susquehanna International Group, Llp | Put | 2.486.900 | -39,98 | 50.434 | -48,03 | |||
| 2026-02-17 | 13F | Susquehanna International Group, Llp | Call | 4.988.000 | -11,52 | 101.157 | -23,38 | |||
| 2026-02-12 | 13F | BlackRock, Inc. | 2.872.090 | 37,27 | 58.246 | 18,86 | ||||
| 2026-02-06 | 13F | Global Retirement Partners, LLC | 487 | 161,83 | 10 | 125,00 | ||||
| 2026-04-20 | 13F | Banque Cantonale Vaudoise | 3.798 | 37,46 | 65 | 16,07 | ||||
| 2026-01-13 | 13F | CoreCap Advisors, LLC | 0 | -100,00 | 0 | |||||
| 2026-02-17 | 13F | Portolan Capital Management, LLC | 96.927 | 1.966 | ||||||
| 2026-02-12 | 13F | Marex Group plc | 18.217 | 369 | ||||||
| 2026-02-17 | 13F | Sandler Capital Management | Call | 33.900 | 687 | |||||
| 2026-02-13 | 13F | Gts Securities Llc | 0 | -100,00 | 0 | |||||
| 2026-02-04 | 13F | Tsfg, Llc | 100 | 0,00 | 0 | |||||
| 2026-02-06 | 13F | HighTower Advisors, LLC | 17.089 | 0,84 | 347 | -12,63 | ||||
| 2026-02-13 | 13F | Cornerstone Financial Management LLC | 41 | 1 | ||||||
| 2026-02-12 | 13F | Advisors Asset Management, Inc. | 59.981 | 4,04 | 1.216 | -9,93 | ||||
| 2026-04-07 | 13F | Farther Finance Advisors, LLC | 3.946 | 54,02 | 69 | 35,29 | ||||
| 2025-11-12 | 13F/A | Norges Bank | 1.438.159 | 17.517 | ||||||
| 2026-02-11 | 13F | O'shaughnessy Asset Management, Llc | 41.523 | 10,86 | 842 | -3,99 | ||||
| 2026-02-13 | 13F | PCM Encore, LLC | 23.346 | 473 | ||||||
| 2026-01-15 | 13F | Nisa Investment Advisors, Llc | 300 | 0,00 | 6 | -14,29 | ||||
| 2026-01-29 | 13F | China Universal Asset Management Co., Ltd. | 10.000 | 0,00 | 203 | -13,68 | ||||
| 2026-02-11 | 13F | Deutsche Bank Ag\ | 80.883 | -0,15 | 1.640 | -13,55 | ||||
| 2026-02-05 | 13F | Central Asset Investments & Management Holdings (HK) Ltd | 38.222 | -89,05 | 775 | -90,52 | ||||
| 2026-02-10 | 13F | Strategic Advisors LLC | 44.492 | -2,62 | 902 | -15,70 | ||||
| 2025-12-15 | 13F | FNY Investment Advisers, LLC | 0 | -100,00 | 0 | |||||
| 2026-02-12 | 13F | Renaissance Technologies Llc | 0 | -100,00 | 0 | |||||
| 2026-03-04 | 13F | SHP Wealth Management | 200 | 4 | ||||||
| 2025-11-13 | 13F | Jump Financial, LLC | 0 | -100,00 | 0 | |||||
| 2026-01-23 | 13F | Assetmark, Inc | 346 | 59,45 | 7 | 40,00 | ||||
| 2026-02-11 | 13F | LPL Financial LLC | 123.223 | 46,83 | 2.499 | 27,12 | ||||
| 2026-02-19 | 13F | Atomi Financial Group, Inc. | 22.299 | 14,20 | 452 | -1,09 | ||||
| 2025-11-14 | 13F | Wolverine Trading, Llc | 55.470 | 25,51 | 1.286 | 60,55 | ||||
| 2025-11-14 | 13F | Wolverine Trading, Llc | Call | 427.100 | 119,25 | 9.904 | 180,49 | |||
| 2026-02-10 | 13F | Main Management ETF Advisors, LLC | 115.101 | 1,03 | 2 | 0,00 | ||||
| 2026-02-17 | 13F | Creative Planning | 38.951 | 2,31 | 790 | -11,45 | ||||
| 2025-11-14 | 13F | Wolverine Trading, Llc | Put | 254.000 | 57,37 | 5.890 | 101,30 | |||
| 2026-02-17 | 13F | Bamco Inc /ny/ | 940.642 | 1,28 | 19.076 | -12,30 | ||||
| 2026-02-11 | 13F | CNB Bank | 100 | 0,00 | 2 | 0,00 | ||||
| 2026-02-11 | 13F | Curio Wealth, Llc | 15 | 0 | ||||||
| 2026-02-11 | 13F | Simplex Trading, Llc | 447.752 | 99,03 | 9.080 | 181.500,00 | ||||
| 2025-11-14 | 13F | Wetherby Asset Management Inc | 69.656 | 2,27 | 1.631 | 34,02 | ||||
| 2026-02-12 | 13F | Rossby Financial, LCC | 50 | 0,00 | 1 | 0,00 | ||||
| 2026-01-26 | 13F | Cwm, Llc | 3.318 | 20,48 | 0 | |||||
| 2026-02-02 | 13F | Fifth Third Bancorp | 1.023 | 21 | ||||||
| 2026-02-17 | 13F | Ancora Advisors, LLC | 520 | 0,00 | 11 | -16,67 | ||||
| 2026-01-30 | 13F | Yong Rong (HK) Asset Management Ltd | 1.588.000 | 32 | ||||||
| 2025-11-14 | 13F | Cubist Systematic Strategies, LLC | Call | 0 | -100,00 | 0 | -100,00 | |||
| 2026-04-21 | 13F | Aaron Wealth Advisors LLC | 19.045 | 326 | ||||||
| 2026-02-03 | 13F | Manning & Napier Advisors Llc | 0 | -100,00 | 0 | |||||
| 2026-02-17 | 13F | Bank Of America Corp /de/ | 3.127.757 | -13,52 | 63.431 | -25,12 | ||||
| 2026-01-26 | 13F | KBC Group NV | 32.158 | -11,35 | 1 | |||||
| 2026-02-17 | 13F | Temasek Holdings (Private) Ltd | 1.194.538 | 0,00 | 24.225 | -13,41 | ||||
| 2025-11-12 | 13F | Quantbot Technologies LP | 0 | -100,00 | 0 | |||||
| 2026-02-17 | 13F | Tudor Investment Corp Et Al | Call | 24.600 | 499 | |||||
| 2026-02-17 | 13F | Tudor Investment Corp Et Al | Put | 10.000 | 203 | |||||
| 2026-01-29 | 13F | Sanctuary Advisors, LLC | 12.824 | -2,52 | 260 | -15,58 | ||||
| 2026-02-17 | 13F | Cetera Investment Advisers | 0 | -100,00 | 0 | |||||
| 2026-01-26 | 13F | Mirae Asset Global Investments Co., Ltd. | 53.570 | -1,22 | 1.086 | -14,49 | ||||
| 2026-02-12 | 13F | CIBC Private Wealth Group, LLC | 2.000 | 0,00 | 41 | -13,04 | ||||
| 2026-02-09 | 13F | AIA Group Ltd | 18.536 | 376 | ||||||
| 2026-02-17 | 13F | Clear Street Markets Llc | 0 | -100,00 | 0 | |||||
| 2026-02-13 | 13F | Aviso Financial Inc. | 0 | -100,00 | 0 | |||||
| 2026-02-13 | 13F | Rafferty Asset Management, LLC | 0 | -100,00 | 0 | |||||
| 2026-02-11 | 13F | Group One Trading, L.p. | 42.457 | 861 | ||||||
| 2026-02-13 | 13F | State Street Corp | 478.720 | -16,64 | 9.708 | -27,82 | ||||
| 2026-02-13 | 13F | MAI Capital Management | 658 | 65,33 | 13 | 44,44 | ||||
| 2026-02-11 | 13F | Empowered Funds, LLC | 0 | -100,00 | 0 | |||||
| 2026-02-12 | 13F | Principal Securities, Inc. | 0 | -100,00 | 0 | -100,00 | ||||
| 2026-04-06 | 13F | Washington Trust Advisors, Inc. | 150 | 0,00 | 3 | -33,33 | ||||
| 2026-02-10 | 13F | NINE MASTS CAPITAL Ltd | 0 | -100,00 | 0 | |||||
| 2025-11-14 | 13F | Caption Management, LLC | Put | 0 | -100,00 | 0 | -100,00 | |||
| 2026-02-05 | 13F | Navalign, LLC | 40 | 1 | ||||||
| 2026-01-29 | 13F | Rakuten Securities, Inc. | 18.595 | 190,50 | 377 | 153,02 | ||||
| 2026-04-21 | 13F | Nemes Rush Group LLC | 75 | 1 | ||||||
| 2026-02-17 | 13F | Clough Capital Partners L P | 0 | -100,00 | 0 | |||||
| 2026-02-17 | 13F | Quantitative Investment Management, LLC | 0 | -100,00 | 0 | |||||
| 2026-02-13 | 13F | National Bank Of Canada /fi/ | 4.240 | -2,24 | 86 | -15,84 | ||||
| 2026-02-12 | 13F | Groupe la Francaise | 0 | -100,00 | 0 | |||||
| 2026-02-06 | 13F | Larson Financial Group LLC | 91 | -54,27 | 2 | -75,00 | ||||
| 2026-01-28 | 13F | Financial Perspectives, Inc | 4.399 | 0,00 | 89 | -13,59 | ||||
| 2026-02-17 | 13F | Ghisallo Capital Management LLC | 7.500.000 | 1.400,00 | 152.100 | 1.198,89 | ||||
| 2026-04-21 | 13F | Vise Technologies, Inc. | 27.645 | 0,00 | 561 | 0,00 | ||||
| 2026-02-13 | 13F | Walleye Trading LLC | 359.175 | 7.284 | ||||||
| 2026-01-27 | 13F | Evergreen Capital Management Llc | 30.040 | -0,08 | 609 | -13,49 | ||||
| 2026-02-05 | 13F | WIM INVESTMENT MANAGEMENT Ltd | 87.500 | 1.774 | ||||||
| 2026-03-20 | 13F | Purpose Unlimited Inc. | 350 | 7 | ||||||
| 2026-02-13 | 13F | Walleye Trading LLC | Put | 826.200 | -22,23 | 16.755 | -32,65 | |||
| 2026-02-13 | 13F | Walleye Trading LLC | Call | 1.235.400 | 66,25 | 25.054 | 43,96 | |||
| 2026-02-12 | 13F | Brown Brothers Harriman & Co | 201 | 0,00 | 4 | 0,00 | ||||
| 2026-02-13 | 13F | Aigen Investment Management, Lp | 0 | -100,00 | 0 | |||||
| 2025-11-14 | 13F | Bridgefront Capital, LLC | 0 | -100,00 | 0 | -100,00 | ||||
| 2026-04-24 | 13F | Root Financial Partners, LLC | 565 | 1,80 | 10 | -18,18 | ||||
| 2026-02-13 | 13F | Hurley Capital, LLC | 0 | 0 | ||||||
| 2026-02-13 | 13F | Vontobel Holding Ltd. | 46.484 | 140,61 | 943 | 108,41 | ||||
| 2026-02-17 | 13F | Parallax Volatility Advisers, L.P. | Put | 100.000 | 2.028 | |||||
| 2026-02-05 | 13F | Allworth Financial LP | 3.032 | 95,99 | 61 | 69,44 | ||||
| 2026-02-17 | 13F | Parallax Volatility Advisers, L.P. | Call | 199.200 | 32,71 | 4.040 | 14,91 | |||
| 2026-02-11 | 13F | Harvest Fund Management Co., Ltd | 88.500 | 0,00 | 1 | 0,00 | ||||
| 2026-02-12 | 13F | Bank of Jackson Hole Trust | 0 | -100,00 | 0 | |||||
| 2025-11-14 | 13F | Truvestments Capital Llc | 0 | -100,00 | 0 | |||||
| 2026-02-13 | 13F | Walleye Capital LLC | Put | 147.100 | 735,80 | 2.983 | 624,03 | |||
| 2026-02-13 | 13F | Walleye Capital LLC | 118.162 | 2.468,74 | 2.396 | 2.139,25 | ||||
| 2026-02-13 | 13F | Polymer Capital Management (HK) LTD | 27.700 | 73,91 | 562 | 50,40 | ||||
| 2026-02-13 | 13F | Walleye Capital LLC | Call | 110.900 | 1.845,61 | 2.249 | 1.590,98 | |||
| 2026-04-21 | 13F | Financial Consulate, Inc | 390 | 1.292,86 | 7 | |||||
| 2026-02-05 | 13F | LGT Fund Management Co Ltd. | 0 | -100,00 | 0 | |||||
| 2026-02-06 | 13F | Leonteq Securities AG | 4.783 | -18,02 | 97 | -29,41 | ||||
| 2026-04-07 | 13F | Signaturefd, Llc | 23.103 | 0,23 | 395 | -15,42 | ||||
| 2025-11-13 | 13F | Connor, Clark & Lunn Investment Management Ltd. | 0 | -100,00 | 0 | -100,00 | ||||
| 2025-11-14 | 13F | Arrowpoint Investment Partners (Singapore) Pte. Ltd. | Call | 0 | -100,00 | 0 | -100,00 | |||
| 2026-02-10 | 13F | Nomura Asset Management Co Ltd | 1.790 | 0,00 | 36 | -12,20 | ||||
| 2026-04-06 | 13F | Highline Wealth Partners Llc | 307 | 22,31 | 5 | 0,00 | ||||
| 2026-01-21 | 13F | Greenleaf Trust | 17.057 | 0,31 | 346 | -13,32 | ||||
| 2026-02-17 | 13F | Jones Financial Companies Lllp | 2.638 | 8,16 | 53 | -3,64 | ||||
| 2026-02-13 | 13F | Kestra Advisory Services, LLC | 0 | -100,00 | 0 | |||||
| 2026-03-09 | 13F/A | CI Private Wealth, LLC | 36.051 | 2,79 | 731 | -10,96 | ||||
| 2026-02-12 | 13F | DRW Securities, LLC | 0 | -100,00 | 0 | |||||
| 2026-02-13 | 13F | SRS Capital Advisors, Inc. | 335 | 80,11 | 7 | 50,00 | ||||
| 2025-11-13 | 13F | Russell Investments Group, Ltd. | 0 | -100,00 | 0 | -100,00 | ||||
| 2026-01-27 | 13F | Fortis Capital Advisors, LLC | 0 | -100,00 | 0 | |||||
| 2026-02-13 | 13F | Wells Fargo & Company/mn | Put | 0 | -100,00 | 0 | -100,00 | |||
| 2026-02-12 | 13F | Jane Street Group, Llc | Put | 2.573.400 | 120,08 | 52.189 | 90,57 | |||
| 2026-02-12 | 13F | Jane Street Group, Llc | Call | 2.339.900 | 7,09 | 47.453 | -7,26 | |||
| 2026-02-13 | 13F | Becker Capital Management Inc | 22.000 | 446 | ||||||
| 2026-02-09 | 13F | Coldstream Capital Management Inc | 10.238 | -68,74 | 208 | -73,01 | ||||
| 2026-02-13 | 13F | Verition Fund Management LLC | Put | 23.600 | 479 | |||||
| 2026-02-17 | 13F | Citadel Advisors Llc | Call | 2.177.300 | 49,50 | 44.156 | 29,46 | |||
| 2025-11-12 | 13F | Fox Run Management, L.l.c. | 0 | -100,00 | 0 | |||||
| 2026-02-17 | 13F | Citadel Advisors Llc | Put | 1.866.700 | -7,39 | 37.857 | -19,81 | |||
| 2026-02-17 | 13F | Citadel Advisors Llc | 1.210.966 | -1,04 | 24.558 | -14,31 | ||||
| 2025-11-14 | 13F | Polymer Capital Management (US) LLC | 0 | -100,00 | 0 | -100,00 | ||||
| 2026-02-13 | 13F | Rhumbline Advisers | 3.974 | -8,92 | 81 | -21,57 | ||||
| 2025-10-30 | 13F | Mizuho Securities Co. Ltd. | 0 | -100,00 | 0 | -100,00 | ||||
| 2026-02-10 | 13F/A | Northwestern Mutual Wealth Management Co | 791 | -0,25 | 16 | -11,11 | ||||
| 2026-02-11 | 13F | Havemeyer Place LP | 76.108 | 1.543 | ||||||
| 2026-02-12 | 13F | Jane Street Group, Llc | 0 | -100,00 | 0 | -100,00 | ||||
| 2026-02-10 | 13F | Bnp Paribas | 16.350 | 10,85 | 332 | -4,06 | ||||
| 2025-11-07 | 13F | Sierra Ocean, Llc | 0 | -100,00 | 0 | |||||
| 2026-01-27 | 13F | Bayforest Capital Ltd | 0 | -100,00 | 0 | |||||
| 2026-02-13 | 13F | Squarepoint Ops LLC | Call | 144.800 | -50,77 | 2.937 | -57,37 | |||
| 2026-02-18 | 13F | Vident Advisory, LLC | 55.997 | 0,40 | 1.136 | -13,09 | ||||
| 2026-02-13 | 13F | Squarepoint Ops LLC | Put | 33.700 | -43,07 | 683 | -50,72 | |||
| 2026-02-13 | 13F | Squarepoint Ops LLC | 46.347 | 940 | ||||||
| 2026-02-17 | 13F | Ameriprise Financial Inc | 24.621 | -5,61 | 499 | -18,20 | ||||
| 2026-04-10 | 13F | Abound Wealth Management | 6 | -50,00 | 0 | |||||
| 2026-02-13 | 13F | Verition Fund Management LLC | 0 | -100,00 | 0 | -100,00 | ||||
| 2026-02-12 | 13F | Bank Of Montreal /can/ | 117.491 | 80,49 | 2.383 | 56,30 | ||||
| 2026-02-13 | 13F | Flow Traders U.s. Llc | 0 | -100,00 | 0 | |||||
| 2026-02-17 | 13F | PharVision Advisers, LLC | 0 | -100,00 | 0 | |||||
| 2026-02-17 | 13F | Laird Norton Trust Company, Llc | 81.855 | 1.660 | ||||||
| 2025-11-14 | 13F | Sig Brokerage, Lp | Call | 0 | -100,00 | 0 | ||||
| 2026-02-11 | 13F | Cerity Partners LLC | 17.760 | 360 | ||||||
| 2026-02-13 | 13F | Smartleaf Asset Management LLC | 1.219 | 26 | ||||||
| 2026-02-13 | 13F | Dymon Asia Capital (singapore) Pte. Ltd. | 0 | -100,00 | 0 | |||||
| 2026-04-24 | 13F | UMA Financial Services, Inc. | 17 | 0 | ||||||
| 2026-02-02 | 13F | Nkcfo Llc | 18.000 | 80,00 | 0 | |||||
| 2026-02-10 | 13F | Goldman Sachs Group Inc | Call | 250.000 | 5.070 | |||||
| 2026-02-17 | 13F | Orland Properties Ltd | 774.462 | 0,00 | 15.706 | -13,40 | ||||
| 2026-02-10 | 13F | Goldman Sachs Group Inc | 3.275.956 | -8,00 | 66.436 | -20,34 | ||||
| 2026-02-13 | 13F | Atlas Capital Advisors Llc | 200 | 0,00 | 4 | 33,33 | ||||
| 2026-02-03 | 13F | Ethic Inc. | 78.380 | 6,08 | 1.590 | -8,15 | ||||
| 2026-02-13 | 13F | Marshall Wace, Llp | Put | 0 | -100,00 | 0 | ||||
| 2025-11-17 | 13F | Hancock Prospecting Pty Ltd | 0 | -100,00 | 0 | -100,00 | ||||
| 2026-02-11 | 13F | Gordian Capital Singapore Pte Ltd | 15.000 | 2 | ||||||
| 2026-02-13 | 13F | Marshall Wace, Llp | Call | 0 | -100,00 | 0 | ||||
| 2026-02-13 | 13F | Marshall Wace, Llp | 0 | -100,00 | 0 | |||||
| 2026-02-17 | 13F | Jain Global LLC | 65.492 | 1.328 | ||||||
| 2026-02-13 | 13F | Intercapital, Llc | 25.000 | 507 | ||||||
| 2026-02-12 | 13F | Quadrant Capital Group Llc | 20.250 | -1,46 | 411 | -14,76 | ||||
| 2026-02-17 | 13F | Prelude Capital Management, Llc | 14.000 | -13,85 | 284 | -25,53 | ||||
| 2026-02-17 | 13F | Northern Trust Corp | 170.601 | 0,26 | 3.460 | -13,18 | ||||
| 2026-02-05 | 13F | DnB Asset Management AS | 114.648 | 2.325 | ||||||
| 2026-01-29 | 13F | Kickstand Ventures, Llc. | 9.952 | 202 | ||||||
| 2026-02-05 | 13F | Phoenix Holdings Ltd. | 0 | -100,00 | 0 | |||||
| 2026-02-12 | 13F | Alibaba Group Holding Ltd | 33.537.232 | 0,00 | 680.135 | -13,41 | ||||
| 2026-02-17 | 13F | D. E. Shaw & Co., Inc. | Call | 1.342.300 | 63,38 | 27.222 | 41,47 | |||
| 2026-04-13 | 13F | Global X Japan Co., Ltd. | 786 | 13 | ||||||
| 2026-02-13 | 13F | Natixis | 7.964 | -62,50 | 162 | -67,61 | ||||
| 2026-02-17 | 13F | D. E. Shaw & Co., Inc. | 156.778 | -90,37 | 3.179 | -91,67 | ||||
| 2026-02-20 | 13F/A | CMT Capital Markets Trading GmbH | 18.604 | -5,08 | 0 | |||||
| 2026-02-17 | 13F | D. E. Shaw & Co., Inc. | Put | 337.600 | 6.847 | |||||
| 2026-02-17 | 13F | Optiver Holding B.V. | 31 | 1 | ||||||
| 2026-02-17 | 13F | Engineers Gate Manager LP | 31.329 | 22,39 | 635 | 6,01 | ||||
| 2026-02-17 | 13F | Credit Agricole S A | 10.569 | 214 | ||||||
| 2026-02-12 | 13F | Barometer Capital Management Inc. | 0 | -100,00 | 0 | |||||
| 2026-03-12 | 13F/A | Peak6 Llc | Call | 2.343.700 | 32,07 | 47.530 | 14,36 | |||
| 2026-02-17 | 13F | Scarborough Advisors, LLC | 46 | 0,00 | 1 | -100,00 | ||||
| 2026-03-12 | 13F/A | Peak6 Llc | 35.876 | 728 | ||||||
| 2026-02-17 | 13F | Millennium Management Llc | 49.468 | -90,44 | 1.003 | -91,72 | ||||
| 2026-02-17 | 13F | Fmr Llc | 81.203 | -32,82 | 1.647 | -41,86 | ||||
| 2026-03-12 | 13F/A | Peak6 Llc | Put | 778.200 | 3,62 | 15.782 | -10,27 | |||
| 2026-04-02 | 13F | Ares Financial Consulting, LLC | 73 | 0,00 | 1 | 0,00 | ||||
| 2026-02-17 | 13F | Millennium Management Llc | Call | 104.600 | 1.012,77 | 2.121 | 864,09 | |||
| 2026-02-17 | 13F | Millennium Management Llc | Put | 118.100 | -44,99 | 2.395 | -52,37 | |||
| 2025-11-07 | 13F | Gsa Capital Partners Llp | 0 | -100,00 | 0 | |||||
| 2026-01-08 | 13F | Tuttle Tactical Management LLC | 13.176 | 267 | ||||||
| 2026-02-04 | 13F | Abc Arbitrage Sa | 0 | -100,00 | 0 | |||||
| 2026-02-12 | 13F | Skopos Labs, Inc. | 18.618 | 22,32 | 382 | 7,02 | ||||
| 2026-01-22 | 13F | HHM Wealth Advisors, LLC | 0 | -100,00 | 0 | |||||
| 2026-04-13 | 13F | True Wealth Design, LLC | 173 | 723,81 | 3 | |||||
| 2026-02-12 | 13F | Federation des caisses Desjardins du Quebec | 26.528 | -13,70 | 538 | -25,31 | ||||
| 2026-04-21 | 13F | Robeco Institutional Asset Management B.V. | 18.536 | 0,00 | 317 | -15,47 | ||||
| 2026-02-03 | 13F | Crossmark Global Holdings, Inc. | 14.504 | -0,48 | 294 | -13,78 | ||||
| 2026-04-15 | 13F | Compagnie Lombard Odier SCmA | 450 | 0,00 | 8 | -22,22 | ||||
| 2026-01-21 | 13F | MBL Wealth, LLC | 10.284 | 0,00 | 209 | -13,33 | ||||
| 2026-02-05 | 13F | Bessemer Group Inc | 10 | 0,00 | 0 | |||||
| 2026-02-03 | 13F | Robeco Schweiz AG | 666.000 | 13.506 | ||||||
| 2026-04-16 | 13F | SG Americas Securities, LLC | 1.067.173 | -8,66 | 18 | -21,74 | ||||
| 2026-04-24 | 13F | Triasima Portfolio Management inc. | 0 | -100,00 | 0 | |||||
| 2026-04-14 | 13F | Yarbrough Capital, LLC | 278.642 | 0,00 | 4.768 | -15,63 | ||||
| 2026-02-09 | 13F | Accent Capital Management, LLC | 330 | 10,00 | 7 | -14,29 | ||||
| 2026-02-02 | 13F | Truist Financial Corp | 14.285 | -13,86 | 290 | -25,52 | ||||
| 2026-02-13 | 13F | JustInvest LLC | 73.805 | 6,91 | 1.497 | -7,43 | ||||
| 2026-02-13 | 13F | Parkside Financial Bank & Trust | 58 | 0,00 | 1 | 0,00 | ||||
| 2026-02-13 | 13F | Ieq Capital, Llc | 10.056 | -13,28 | 204 | -25,09 | ||||
| 2026-02-12 | 13F | Hrt Financial Lp | 0 | -100,00 | 0 | |||||
| 2026-02-17 | 13F | Himension Fund | 0 | -100,00 | 0 | |||||
| 2026-02-17 | 13F | Qube Research & Technologies Ltd | 0 | -100,00 | 0 | |||||
| 2025-11-07 | 13F | Shell Asset Management Co | 0 | -100,00 | 0 | |||||
| 2026-01-29 | 13F | UBS Group AG | Put | 299.900 | 6.082 | |||||
| 2026-01-29 | 13F | UBS Group AG | Call | 2.757.716 | 4,63 | 55.926 | -9,40 | |||
| 2026-01-29 | 13F | UBS Group AG | 5.341.214 | -48,20 | 108.320 | -55,15 | ||||
| 2026-02-17 | 13F | KADENSA CAPITAL Ltd | 0 | -100,00 | 0 | |||||
| 2026-02-12 | 13F | Dimensional Fund Advisors Lp | 11.202 | -6,69 | 227 | -19,22 | ||||
| 2026-02-13 | 13F | Barclays Plc | 1.060.869 | 382,22 | 21.514 | 317,59 | ||||
| 2026-02-10 | 13F | Yunqi Capital Ltd | 212.600 | 4.312 | ||||||
| 2026-02-13 | 13F | Barclays Plc | Call | 381.300 | 281,30 | 7.733 | 230,15 | |||
| 2026-02-17 | 13F | Schonfeld Strategic Advisors LLC | 0 | -100,00 | 0 | |||||
| 2026-02-11 | 13F | Jpmorgan Chase & Co | 719.121 | 11.491,25 | 14.584 | 9.957,24 | ||||
| 2026-02-10 | 13F | JTC Employer Solutions Trusteee Ltd | 1.271 | 0,00 | 0 | |||||
| 2025-10-30 | 13F | Ridgewood Investments LLC | 0 | -100,00 | 0 | -100,00 | ||||
| 2026-04-20 | 13F | Ronald Blue Trust, Inc. | 622 | 8,74 | 11 | -9,09 | ||||
| 2025-11-04 | 13F | Twenty Acre Capital LP | 0 | -100,00 | 0 | -100,00 | ||||
| 2026-01-30 | 13F | Us Bancorp \de\ | 68.987 | -5,80 | 1.399 | -18,43 | ||||
| 2026-01-29 | 13F | IMC-Chicago, LLC | 809.987 | 36,80 | 16.427 | 18,46 | ||||
| 2026-02-03 | 13F | Mitsubishi UFJ Kokusai Asset Management Co., Ltd. | 88.688 | -19,19 | 1.812 | -29,53 | ||||
| 2026-02-06 | 13F/A | Rathbone Brothers plc | 24.858 | 1,26 | 504 | -12,20 | ||||
| 2026-02-17 | 13F | SageView Advisory Group, LLC | 266 | 5 | ||||||
| 2026-02-17 | 13F | Quantinno Capital Management LP | 105.210 | 13,46 | 2.134 | -1,75 | ||||
| 2025-11-03 | 13F | Private Wealth Asset Management, LLC | 0 | -100,00 | 0 | -100,00 | ||||
| 2026-02-13 | 13F | Mariner, LLC | 64.798 | -4,37 | 1.316 | -17,02 | ||||
| 2026-02-13 | 13F | Motiv8 Investments LLC | 3 | 0 | ||||||
| 2026-04-23 | 13F | North Star Investment Management Corp. | 139 | 434,62 | 2 |