Grundlæggende statistik
| Institutionelle ejere | 158 total, 144 long only, 0 short only, 14 long/short - change of 94,12% MRQ |
| Gennemsnitlig porteføljeallokering | 0.0044 % - change of -44,34% MRQ |
| Institutionelle aktier (lange) | 67.486.779 (ex 13D/G) - change of 4,04MM shares 455,94% MRQ |
| Institutionel værdi (lang) | $ 639.540 USD ($1000) |
Institutionelt ejerskab og aktionærer
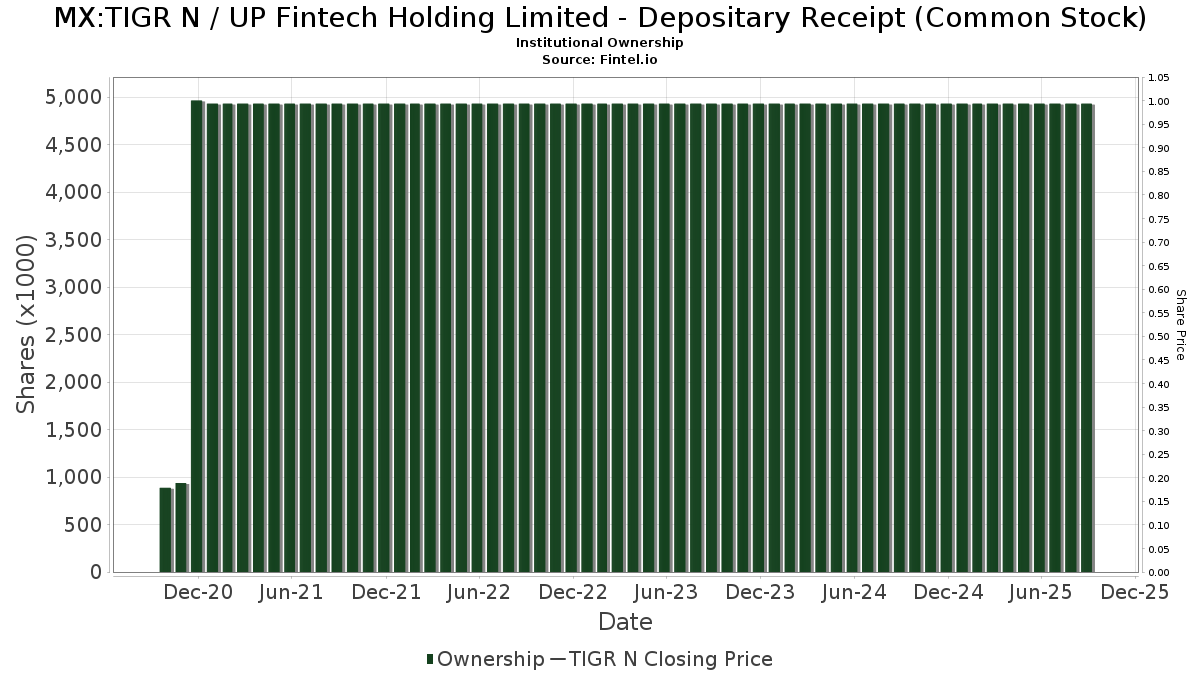
UP Fintech Holding Limited - Depositary Receipt (Common Stock) (MX:TIGR N) har 158 institutionelle ejere og aktionærer, der har indsendt 13D/G- eller 13F-formularer til Securities Exchange Commission (SEC). Disse institutioner har i alt 67,486,779 aktier. Største aktionærer omfatter Avenir Tech Ltd, Sparta 24 Ltd., Capital International Investors, Arrowstreet Capital, Limited Partnership, Group One Trading, L.p., Jupiter Asset Management Ltd, Susquehanna International Group, Llp, Susquehanna International Group, Llp, Jane Street Group, Llc, and BlackRock, Inc. .
UP Fintech Holding Limited - Depositary Receipt (Common Stock) (BMV:TIGR N) institutionel ejerskabsstruktur viser aktuelle positioner i virksomheden efter institutioner og fonde, samt seneste ændringer i positionsstørrelse. Større aktionærer kan omfatte individuelle investorer, investeringsforeninger, hedgefonde eller institutioner. Skema 13D angiver, at investoren besidder (eller besidder) mere end 5 % af virksomheden og har til hensigt (eller har til hensigt at) aktivt at forfølge en ændring i forretningsstrategi. Skema 13G indikerer en passiv investering på over 5%.
Fondens stemningsscore
Fund Sentiment Score (fka Ownership Accumulation Score) finder de aktier, der bliver mest købt af fonde. Det er resultatet af en sofistikeret, multi-faktor kvantitativ model, der identificerer virksomheder med de højeste niveauer af institutionel akkumulering. Scoringsmodellen bruger en kombination af den samlede stigning i oplyste ejere, ændringerne i porteføljeallokeringer i disse ejere og andre målinger. Tallet går fra 0 til 100, hvor højere tal indikerer et højere niveau af akkumulering for sine jævnaldrende, og 50 er gennemsnittet.
Opdateringsfrekvens: Dagligt
Se Ownership Explorer, som giver en liste over højest rangerende virksomheder.
AI+ Ask Fintel’s AI assistant about UP Fintech Holding Limited - Depositary Receipt (Common Stock).
Select a question to share a public post with an AI-crafted answer.
Thinking of good questions…
13F og NPORT arkivering
Detaljer om 13F-arkivering er gratis. Detaljer om NP-ansøgninger kræver et premium-medlemskab. Grønne rækker angiver nye positioner. Røde rækker angiver lukkede positioner. Klik på linket ikon for at se den fulde transaktionshistorik.
Opgrader
for at låse premium-data op og eksportere til Excel ![]() .
.
| Fil dato | Kilde | Investor | Type | Gennemsnitlig pris (Øst) |
Aktier | Δ Aktier (%) |
Rapporteret Værdi ($1000) |
Δ Værdi (%) |
Port Alloc (%) |
|
|---|---|---|---|---|---|---|---|---|---|---|
| 2026-02-17 | 13F | Wellington Management Group Llp | 24.400 | -69,94 | 233 | -73,09 | ||||
| 2026-02-17 | 13F | Susquehanna International Group, Llp | Put | 851.200 | -89,36 | 8.137 | -90,46 | |||
| 2026-02-13 | 13F | Verition Fund Management LLC | 69.768 | -31,45 | 667 | -38,62 | ||||
| 2026-02-17 | 13F | Susquehanna International Group, Llp | Call | 3.077.200 | -21,18 | 29.418 | -29,38 | |||
| 2026-02-13 | 13F | Citigroup Inc | 996.208 | -7,52 | 9.524 | -17,15 | ||||
| 2026-02-17 | 13F | Susquehanna International Group, Llp | 3.525.686 | -48,24 | 33.706 | -53,62 | ||||
| 2026-02-12 | 13F | BlackRock, Inc. | 2.454.178 | 7,44 | 23.462 | -3,74 | ||||
| 2026-02-17 | 13F | Oxford Asset Management Llp | 24.316 | 232 | ||||||
| 2026-02-17 | 13F | Parallax Volatility Advisers, L.P. | Call | 0 | -100,00 | 0 | ||||
| 2026-02-13 | 13F | Toroso Investments, LLC | 0 | -100,00 | 0 | -100,00 | ||||
| 2026-02-13 | 13F | State Street Corp | 818.741 | 5,20 | 7.823 | -5,78 | ||||
| 2026-01-23 | 13F | Wallace Advisory Group, LLC | 0 | -100,00 | 0 | |||||
| 2026-01-14 | 13F | ORG Wealth Partners, LLC | 626 | 6,46 | 6 | -16,67 | ||||
| 2026-02-17 | 13F | Tower Research Capital LLC (TRC) | 71 | -95,57 | 1 | -100,00 | ||||
| 2026-02-12 | 13F | Federation des caisses Desjardins du Quebec | 370 | 0,00 | 4 | 0,00 | ||||
| 2026-02-10 | 13F | Envestnet Asset Management Inc | 285.114 | 24,54 | 2.726 | 11,59 | ||||
| 2026-02-13 | 13F | Walleye Trading LLC | Put | 678.300 | -76,91 | 6.485 | -79,32 | |||
| 2026-02-06 | 13F | HighTower Advisors, LLC | 49.495 | -8,70 | 473 | -18,17 | ||||
| 2026-02-17 | 13F | Trexquant Investment LP | 688.393 | -35,43 | 6.581 | -42,15 | ||||
| 2026-02-10 | 13F | Bank of New York Mellon Corp | 73.772 | 705 | ||||||
| 2026-01-23 | 13F | Farther Finance Advisors, LLC | Call | 0 | -100,00 | 0 | -100,00 | |||
| 2026-01-29 | 13F | Sanctuary Advisors, LLC | 14.306 | 8,82 | 137 | -2,86 | ||||
| 2025-11-12 | 13F | Commons Capital, Llc | 0 | -100,00 | 0 | |||||
| 2026-02-05 | 13F | Atria Investments Llc | 48.634 | 0,60 | 465 | -9,90 | ||||
| 2026-01-26 | 13F | Cwm, Llc | 33.299 | 0 | ||||||
| 2026-02-17 | 13F | Private Advisor Group, LLC | 257.480 | 2.462 | ||||||
| 2026-02-17 | 13F | Qube Research & Technologies Ltd | 0 | -100,00 | 0 | |||||
| 2026-02-17 | 13F | Quadrature Capital Ltd | 40.493 | -68,90 | 387 | -72,10 | ||||
| 2025-11-14 | 13F | Squarepoint Ops LLC | Put | 0 | -100,00 | 0 | -100,00 | |||
| 2026-02-17 | 13F | Symmetry Peak Management Llc | Call | 0 | -100,00 | 0 | ||||
| 2026-02-10 | 13F | Bnp Paribas Arbitrage, Sa | 249.200 | -3,84 | 2.382 | -13,85 | ||||
| 2025-11-13 | 13F | Healthcare Of Ontario Pension Plan Trust Fund | 0 | -100,00 | 0 | |||||
| 2026-02-13 | 13F | Wells Fargo & Company/mn | 23.864 | -83,82 | 228 | -85,51 | ||||
| 2026-02-13 | 13F | JustInvest LLC | 14.946 | 7,49 | 143 | -4,05 | ||||
| 2026-02-11 | 13F | Prudential Plc | 477.049 | 44,76 | 4.561 | 29,69 | ||||
| 2026-02-17 | 13F | Signature Equity Partners, LLC | 237 | 2 | ||||||
| 2026-03-17 | 13F/A | Barclays Plc | Put | 0 | -100,00 | 0 | -100,00 | |||
| 2026-02-03 | 13F | Maxi Investments CY Ltd | 0 | -100,00 | 0 | -100,00 | ||||
| 2026-02-13 | 13F | Walleye Trading LLC | Call | 53.200 | -83,47 | 509 | -85,21 | |||
| 2026-02-13 | 13F | Walleye Trading LLC | 658.618 | -29,61 | 6.296 | -36,93 | ||||
| 2026-02-12 | 13F | Jane Street Group, Llc | Put | 2.179.200 | -64,60 | 20.833 | -68,29 | |||
| 2026-02-12 | 13F | Jane Street Group, Llc | Call | 2.612.300 | 19,46 | 24.974 | 7,03 | |||
| 2026-02-12 | 13F | Jane Street Group, Llc | 2.379.336 | -30,53 | 22.746 | -37,76 | ||||
| 2026-02-13 | 13F | Rhumbline Advisers | 1.323 | -8,63 | 13 | -20,00 | ||||
| 2026-02-13 | 13F | Walleye Capital LLC | 684.559 | -14,03 | 6.544 | -22,98 | ||||
| 2026-01-22 | 13F | Personal Cfo Solutions, Llc | 32.372 | 10,39 | 309 | -0,96 | ||||
| 2025-11-14 | 13F | Mangrove Partners | 0 | -100,00 | 0 | -100,00 | ||||
| 2026-02-11 | 13F | Contrarius Group Holdings Ltd | 1.071.425 | 10.243 | ||||||
| 2026-02-09 | 13F | William Blair Investment Management, Llc | 0 | -100,00 | 0 | -100,00 | ||||
| 2026-02-13 | 13F | Walleye Capital LLC | Call | 11.400 | 75,38 | 109 | 56,52 | |||
| 2026-02-13 | 13F | Squarepoint Ops LLC | 29.343 | -38,04 | 281 | -44,55 | ||||
| 2026-02-13 | 13F | Walleye Capital LLC | Put | 194.400 | 1.196,00 | 1.858 | 1.061,25 | |||
| 2026-02-17 | 13F | Royal Bank Of Canada | 5.158 | -33,12 | 49 | -40,24 | ||||
| 2026-02-17 | 13F | Persistent Asset Partners Ltd | 0 | -100,00 | 0 | -100,00 | ||||
| 2026-04-22 | 13F | Spirepoint Private Client, Llc | 45.693 | 50,80 | 288 | -0,69 | ||||
| 2026-02-13 | 13F | Van Eck Associates Corp | 74.181 | 0,00 | 1 | |||||
| 2025-11-07 | 13F | Alberta Investment Management Corp | 0 | -100,00 | 0 | |||||
| 2026-04-21 | 13F | PharVision Advisers, LLC | 0 | -100,00 | 0 | |||||
| 2026-01-29 | 13F | IMC-Chicago, LLC | Put | 615.400 | -45,66 | 5.883 | -51,31 | |||
| 2026-01-29 | 13F | IMC-Chicago, LLC | Call | 2.450.000 | -5,28 | 23.422 | -15,13 | |||
| 2026-02-10 | 13F | Acadian Asset Management Llc | 13.377 | -95,11 | 0 | -100,00 | ||||
| 2026-02-12 | 13F | Renaissance Technologies Llc | 775.500 | 38,14 | 7.414 | 23,76 | ||||
| 2026-02-17 | 13F | Two Sigma Advisers, Lp | 48.900 | -38,02 | 467 | -44,47 | ||||
| 2026-02-06 | 13F | Profund Advisors Llc | 59.416 | -11,32 | 568 | -20,45 | ||||
| 2026-02-18 | 13F | GWM Advisors LLC | 100 | 0,00 | 1 | -100,00 | ||||
| 2026-02-17 | 13F | Jones Financial Companies Lllp | 11.981 | -7,17 | 115 | -12,98 | ||||
| 2026-01-29 | 13F | UBS Group AG | Call | 24.000 | 0,00 | 229 | -10,55 | |||
| 2026-02-02 | 13F | Truist Financial Corp | 18.165 | -34,07 | 174 | -40,96 | ||||
| 2025-11-14 | 13F | Caption Management, LLC | Call | 0 | -100,00 | 0 | ||||
| 2026-01-29 | 13F | UBS Group AG | 380.806 | -20,76 | 3.641 | -29,00 | ||||
| 2026-01-28 | 13F | Quaker Wealth Management, LLC | 0 | -100,00 | 0 | |||||
| 2026-04-22 | 13F | Pictet Asset Management Holding SA | 42.100 | 0,00 | 265 | -34,08 | ||||
| 2025-11-14 | 13F | Militia Capital Partners, LP | 140.000 | 1.494 | ||||||
| 2026-02-17 | 13F | Susquehanna Fundamental Investments, Llc | 0 | -100,00 | 0 | -100,00 | ||||
| 2026-04-07 | 13F | Farther Finance Advisors, LLC | 17 | -98,88 | 0 | -100,00 | ||||
| 2026-02-13 | 13F | Mml Investors Services, Llc | 0 | -100,00 | 0 | |||||
| 2026-01-30 | 13F | Precision Wealth Strategies, LLC | 54.790 | -6,72 | 524 | -16,45 | ||||
| 2026-02-13 | 13F | Quinn Opportunity Partners LLC | 618.921 | 0,00 | 5.917 | -10,40 | ||||
| 2026-04-24 | 13F | UMA Financial Services, Inc. | 0 | -100,00 | 0 | |||||
| 2026-01-30 | 13F | Bogart Wealth, LLC | 1.868 | 0,00 | 18 | -10,53 | ||||
| 2026-02-13 | 13F | Avenir Tech Ltd | 10.346.087 | -3,01 | 98.909 | -13,10 | ||||
| 2026-02-11 | 13F | Winton Capital Group Ltd | 37.300 | 357 | ||||||
| 2026-02-17 | 13F | D. E. Shaw & Co., Inc. | Put | 263.000 | 39,60 | 2.514 | 25,07 | |||
| 2026-02-17 | 13F | D. E. Shaw & Co., Inc. | 1.293.236 | -35,93 | 12.363 | -42,59 | ||||
| 2026-02-11 | 13F | LPL Financial LLC | 155.447 | 10,01 | 1.486 | -1,39 | ||||
| 2026-02-17 | 13F | Voloridge Investment Management, Llc | 0 | -100,00 | 0 | |||||
| 2026-02-17 | 13F | D. E. Shaw & Co., Inc. | Call | 21.800 | -95,65 | 208 | -96,11 | |||
| 2026-02-11 | 13F | Simplex Trading, Llc | 330.741 | -44,80 | 3.162 | 52.583,33 | ||||
| 2026-02-11 | 13F | Simplex Trading, Llc | Call | 951.800 | 8,41 | 9.099 | 101.000,00 | |||
| 2026-02-11 | 13F | Simplex Trading, Llc | Put | 720.800 | -28,26 | 6.891 | 68.800,00 | |||
| 2026-02-13 | 13F | Smartleaf Asset Management LLC | 176 | 2 | ||||||
| 2026-02-13 | 13F | Avenir Tech Ltd | Put | 0 | -100,00 | 0 | -100,00 | |||
| 2026-02-17 | 13F | Northern Trust Corp | 196.342 | 8,90 | 1.877 | -2,39 | ||||
| 2026-02-13 | 13F | American Century Companies Inc | 11.452 | 109 | ||||||
| 2026-02-17 | 13F | Advisory Services Network, LLC | 12.405 | -0,57 | 119 | -11,28 | ||||
| 2026-02-13 | 13F | Marshall Wace, Llp | 2.019.197 | 128,52 | 19.304 | 104,74 | ||||
| 2026-02-17 | 13F | Citadel Advisors Llc | Put | 750.200 | -59,76 | 7.172 | -63,95 | |||
| 2026-01-28 | 13F | Oversea-Chinese Banking CORP Ltd | 55.591 | -4,55 | 531 | -14,49 | ||||
| 2026-02-12 | 13F | Bank Of Montreal /can/ | 0 | -100,00 | 0 | -100,00 | ||||
| 2026-02-13 | 13F | Integrated Wealth Concepts LLC | 0 | -100,00 | 0 | |||||
| 2026-02-13 | 13F | Police & Firemen's Retirement System of New Jersey | 35.039 | -18,82 | 335 | -27,39 | ||||
| 2026-02-12 | 13F | Skopos Labs, Inc. | 10.363 | 94 | ||||||
| 2026-02-13 | 13F | National Bank Of Canada /fi/ | 430.920 | -78,20 | 4.120 | -80,47 | ||||
| 2026-02-02 | 13F | Sparta 24 Ltd. | 5.325.660 | -14,94 | 50.913 | -23,79 | ||||
| 2026-02-14 | 13F | Militia Capital Partners, LP | Call | 250.000 | 25,00 | 4 | -98,98 | |||
| 2026-02-17 | 13F | Altshuler Shaham Ltd | 1.200 | 11 | ||||||
| 2026-02-09 | 13F | Legal & General Group Plc | 12.864 | 10,95 | 123 | -0,81 | ||||
| 2026-02-10 | 13F | Jupiter Asset Management Ltd | 4.216.229 | 157,28 | 40.307 | 130,52 | ||||
| 2026-02-13 | 13F | Quarry LP | 1.708 | -85,00 | 16 | -86,78 | ||||
| 2026-02-17 | 13F | Schonfeld Strategic Advisors LLC | 0 | -100,00 | 0 | |||||
| 2025-11-13 | 13F | Eschler Asset Management LLP | 0 | -100,00 | 0 | |||||
| 2026-02-17 | 13F | Alliancebernstein L.p. | 24.238 | 0,00 | 232 | -10,47 | ||||
| 2026-03-12 | 13F/A | Peak6 Llc | Put | 471.400 | -78,87 | 4.507 | -81,07 | |||
| 2025-11-14 | 13F | Lazard Asset Management Llc | 0 | -100,00 | 0 | |||||
| 2026-03-12 | 13F/A | Peak6 Llc | Call | 110.100 | -90,53 | 1.053 | -91,52 | |||
| 2026-03-12 | 13F/A | Peak6 Llc | 71.311 | -84,17 | 682 | -85,83 | ||||
| 2026-01-29 | 13F | Cornerstone Investment Partners, LLC | 20.881 | 200 | ||||||
| 2026-02-12 | 13F | Nuveen, LLC | 77.100 | 0,00 | 737 | -10,34 | ||||
| 2026-01-09 | 13F | SG Americas Securities, LLC | Call | 0 | -100,00 | 0 | ||||
| 2025-11-14 | 13F | Cubist Systematic Strategies, LLC | Put | 13.400 | -29,47 | 143 | -22,40 | |||
| 2025-11-14 | 13F | Cubist Systematic Strategies, LLC | Call | 462.900 | -54,33 | 4.939 | -49,50 | |||
| 2026-02-20 | 13F | Dorsey Wright & Associates | 204.132 | 2,59 | 1.952 | -8,05 | ||||
| 2026-02-17 | 13F | Numerai GP LLC | 34.391 | 329 | ||||||
| 2026-02-13 | 13F | Morgan Stanley | 1.608.446 | -20,52 | 15.377 | -28,79 | ||||
| 2026-02-13 | 13F | Polymer Capital Management (HK) LTD | 0 | -100,00 | 0 | |||||
| 2026-02-17 | 13F | Citadel Advisors Llc | 1.186.032 | 14,04 | 11.338 | 2,18 | ||||
| 2026-02-17 | 13F | Citadel Advisors Llc | Call | 915.400 | -50,32 | 8.751 | -55,49 | |||
| 2026-02-06 | 13F | Larson Financial Group LLC | 643 | 5,93 | 6 | 0,00 | ||||
| 2026-02-09 | 13F | IPG Investment Advisors LLC | 16.150 | 154 | ||||||
| 2026-04-07 | 13F | CoreCap Advisors, LLC | 1 | 0,00 | 0 | |||||
| 2026-02-12 | 13F | Rossby Financial, LCC | 106 | 0,00 | 1 | 0,00 | ||||
| 2026-02-12 | 13F | Loomis Sayles & Co L P | 0 | -100,00 | 0 | -100,00 | ||||
| 2025-11-14 | 13F | Tudor Investment Corp Et Al | 0 | -100,00 | 0 | |||||
| 2026-01-27 | 13F | Asset Management One Co., Ltd. | 60.417 | 433,20 | 549 | 357,50 | ||||
| 2026-02-06 | 13F | Wrapmanager Inc | 10.981 | -6,47 | 105 | -16,80 | ||||
| 2025-11-07 | 13F | Icapital Wealth Llc | 0 | -100,00 | 0 | |||||
| 2026-02-06 | 13F | Handelsbanken Fonder AB | 27.700 | 2,59 | 0 | |||||
| 2026-02-17 | 13F | Man Group plc | 1.906.970 | 6,50 | 18.231 | -4,58 | ||||
| 2026-02-13 | 13F | Pathstone Holdings, LLC | 12.562 | 0,00 | 120 | -10,45 | ||||
| 2026-02-19 | 13F | Invesco Ltd. | 99.552 | -4,75 | 952 | -14,71 | ||||
| 2025-11-13 | 13F | Canada Pension Plan Investment Board | 0 | -100,00 | 0 | |||||
| 2026-01-29 | 13F | D.a. Davidson & Co. | 0 | -100,00 | 0 | |||||
| 2026-02-17 | 13F | Cetera Investment Advisers | 50.168 | -43,84 | 480 | -49,74 | ||||
| 2026-02-13 | 13F | Ubs Asset Management Americas Inc | 38.900 | 372 | ||||||
| 2026-01-07 | 13F | Harbour Capital Advisors, LLC | 61.000 | -4,52 | 637 | -1,85 | ||||
| 2026-04-20 | 13F | Ronald Blue Trust, Inc. | 221 | 0,00 | 1 | -50,00 | ||||
| 2026-01-23 | 13F | Assetmark, Inc | 0 | -100,00 | 0 | |||||
| 2026-04-15 | 13F | Bayforest Capital Ltd | 82 | -98,58 | 1 | -100,00 | ||||
| 2026-02-06 | 13F | Cullen/frost Bankers, Inc. | 2.000 | 19 | ||||||
| 2026-02-03 | 13F | SBI Securities Co., Ltd. | 5.558 | -28,16 | 53 | -35,37 | ||||
| 2026-02-13 | 13F | Caitong International Asset Management Co., Ltd | 0 | -100,00 | 0 | |||||
| 2026-04-24 | 13F | Root Financial Partners, LLC | 48 | 0 | ||||||
| 2026-02-17 | 13F | Bank Of America Corp /de/ | 1.925.882 | 978,49 | 18.411 | 866,46 | ||||
| 2026-02-17 | 13F | Jump Financial, LLC | 258.013 | -43,79 | 2.467 | -49,65 | ||||
| 2026-02-17 | 13F | Millennium Management Llc | 49.469 | -49,99 | 473 | -55,26 | ||||
| 2026-01-23 | 13F | Bingham Private Wealth, Llc | 12.659 | -0,73 | 121 | -1,63 | ||||
| 2026-04-16 | 13F | SG Americas Securities, LLC | 0 | -100,00 | 0 | |||||
| 2026-04-23 | 13F | J.w. Cole Advisors, Inc. | 0 | -100,00 | 0 | |||||
| 2026-02-11 | 13F | Group One Trading, L.p. | Put | 1.828.100 | -30,01 | 17.477 | -37,29 | |||
| 2026-02-11 | 13F | Group One Trading, L.p. | 4.247.722 | -0,72 | 40.608 | -11,04 | ||||
| 2026-02-17 | 13F | GeoWealth Management, LLC | 3.642 | 35 | ||||||
| 2026-02-11 | 13F | Group One Trading, L.p. | Call | 2.062.100 | -21,55 | 19.714 | -29,71 | |||
| 2026-02-10 | 13F | Goldman Sachs Group Inc | 521.123 | -66,88 | 4.982 | -70,33 | ||||
| 2026-02-17 | 13F | Lighthouse Investment Partners, LLC | 73.370 | 701 | ||||||
| 2026-02-17 | 13F | Advisor Group Holdings, Inc. | 12.197 | -79,11 | 117 | -81,73 | ||||
| 2026-01-15 | 13F | Burns Matteson Capital Management, LLC | 34.270 | 10,45 | 328 | -1,21 | ||||
| 2026-02-13 | 13F | Panagora Asset Management Inc | 630.405 | 11,20 | 6.027 | -0,38 | ||||
| 2026-02-17 | 13F | Boothbay Fund Management, Llc | 0 | -100,00 | 0 | -100,00 | ||||
| 2026-02-10 | 13F | CIBC World Markets Inc. | 22.654 | 95,29 | 217 | 75,61 | ||||
| 2026-02-10 | 13F | Exit Wealth Advisors, LLC. | 85.116 | 8,01 | 814 | -3,21 | ||||
| 2026-04-17 | 13F | Bell Investment Advisors, Inc | 79 | 0 | ||||||
| 2025-11-14 | 13F | Scientech Research LLC | 0 | -100,00 | 0 | |||||
| 2026-02-13 | 13F | Ieq Capital, Llc | 0 | -100,00 | 0 | |||||
| 2026-02-13 | 13F | Barclays Plc | 2.500 | -98,03 | 24 | -98,30 | ||||
| 2026-02-09 | 13F | Geode Capital Management, Llc | 204.076 | 13,37 | 1.951 | 1,56 | ||||
| 2025-11-14 | 13F | Prelude Capital Management, Llc | 0 | -100,00 | 0 | -100,00 | ||||
| 2026-04-23 | 13F | SJS Investment Consulting Inc. | 0 | -100,00 | 0 | |||||
| 2026-02-17 | 13F | Ameriprise Financial Inc | 0 | -100,00 | 0 | |||||
| 2026-02-17 | 13F | Balyasny Asset Management Llc | 17.223 | 165 | ||||||
| 2026-02-13 | 13F | Y-Intercept (Hong Kong) Ltd | 118.499 | -45,38 | 1.133 | -51,08 | ||||
| 2026-04-08 | 13F | Afg Fiduciary Services Limited Partnership | 0 | -100,00 | 0 | |||||
| 2026-02-06 | 13F | Gsa Capital Partners Llp | 48.399 | -74,46 | 0 | -100,00 | ||||
| 2026-02-17 | 13F | Public Employees Retirement System Of Ohio | 20.900 | -44,78 | 200 | -50,62 | ||||
| 2026-02-06 | 13F | Hexagon Capital Partners LLC | 102.348 | 16,77 | 978 | 4,60 | ||||
| 2026-02-17 | 13F | Hilltop Holdings Inc. | 70.237 | 671 | ||||||
| 2026-01-26 | 13F | Mirae Asset Global Investments Co., Ltd. | 4.487 | 1,56 | 43 | -10,64 | ||||
| 2026-01-23 | 13F | Diversify Advisory Services, LLC | 59.749 | 11,60 | 544 | -7,02 | ||||
| 2026-02-13 | 13F | Delos Wealth Advisors, LLC | 488 | 5 | ||||||
| 2025-11-12 | 13F | CMT Capital Markets Trading GmbH | Put | 0 | -100,00 | 0 | ||||
| 2026-02-05 | 13F | Cambridge Investment Research Advisors, Inc. | 68.748 | -0,45 | 1 | |||||
| 2026-02-13 | 13F | Stifel Financial Corp | 81.822 | 6,12 | 782 | -4,87 | ||||
| 2026-02-17 | 13F | Wiley Bros.-aintree Capital, Llc | 17.343 | -0,68 | 166 | -11,76 | ||||
| 2026-02-17 | 13F | Raymond James Financial Inc | 19.771 | -72,64 | 189 | -75,45 | ||||
| 2026-02-11 | 13F | Fox Run Management, L.l.c. | 20.555 | 197 | ||||||
| 2026-04-13 | 13F | Global X Japan Co., Ltd. | 2.718 | 17 | ||||||
| 2026-02-04 | 13F | Beverly Hills Private Wealth, LLC | 22.040 | 0,00 | 235 | 0,00 | ||||
| 2026-02-12 | 13F | Marex Group plc | 32.944 | 99,96 | 315 | 79,43 | ||||
| 2026-02-03 | 13F | Diversify Wealth Management, Llc | 174.439 | 6,29 | 1.661 | -7,26 | ||||
| 2026-02-13 | 13F | Arrowstreet Capital, Limited Partnership | 4.831.636 | -10,66 | 46.190 | -19,95 | ||||
| 2026-02-12 | 13F | CMT Capital Markets Trading GmbH | Call | 0 | -100,00 | 0 | ||||
| 2025-11-14 | 13F | Virtu Financial LLC | 0 | -100,00 | 0 | |||||
| 2026-02-12 | 13F | BRYN MAWR TRUST Co | 10.000 | -37,50 | 96 | -44,12 | ||||
| 2026-02-12 | 13F | Hollencrest Capital Management | 0 | -100,00 | 0 | |||||
| 2026-02-17 | 13F | Parallax Volatility Advisers, L.P. | Put | 4.400 | -97,01 | 42 | -97,33 | |||
| 2026-02-17 | 13F | Parallax Volatility Advisers, L.P. | 230.216 | -26,46 | 2.201 | -34,13 | ||||
| 2026-04-13 | 13F | IFP Advisors, Inc | 11.000 | 69 | ||||||
| 2026-02-17 | 13F | XTX Topco Ltd | 78.916 | 615,14 | 754 | 544,44 | ||||
| 2026-02-17 | 13F | Russell Investments Group, Ltd. | 34.014 | -11,98 | 325 | -22,43 | ||||
| 2025-11-26 | 13F/A | Jpmorgan Chase & Co | Put | 0 | -100,00 | 0 | -100,00 | |||
| 2026-02-17 | 13F | Point72 Asset Management, L.P. | Call | 170.500 | 1.630 | |||||
| 2026-02-10 | 13F | REAP Financial Group, LLC | 500 | 0,00 | 5 | -20,00 | ||||
| 2026-02-17 | 13F | Point72 Asset Management, L.P. | Put | 13.100 | 125 | |||||
| 2026-02-18 | 13F | Vident Advisory, LLC | 45.113 | -7,45 | 431 | -17,12 | ||||
| 2026-02-13 | 13F | Natixis | 18.991 | -5,21 | 180 | -17,13 | ||||
| 2026-02-13 | 13F | Headlands Technologies LLC | 0 | -100,00 | 0 | -100,00 | ||||
| 2025-11-14 | 13F | Wolverine Trading, Llc | 60.322 | -54,81 | 655 | -47,89 | ||||
| 2025-11-14 | 13F | Wolverine Trading, Llc | Call | 349.100 | -0,77 | 3.791 | 14,43 | |||
| 2025-11-14 | 13F | Wolverine Trading, Llc | Put | 162.700 | -30,82 | 1.767 | -20,27 | |||
| 2026-02-11 | 13F | Capital International Investors | 5.005.706 | 47.855 | ||||||
| 2026-02-13 | 13F | Centiva Capital, LP | 0 | -100,00 | 0 | |||||
| 2026-04-06 | 13F | GAMMA Investing LLC | 11.269 | -9,96 | 71 | -41,18 | ||||
| 2026-02-17 | 13F | Nomura Holdings Inc | 15.500 | 148 | ||||||
| 2026-02-11 | 13F | Deutsche Bank Ag\ | 6.073 | -31,78 | 58 | -38,30 | ||||
| 2026-02-06 | 13F | EverSource Wealth Advisors, LLC | 2.603 | 7,96 | 25 | -4,00 | ||||
| 2026-02-10 | 13F | Quantbot Technologies LP | 4.403 | -37,49 | 42 | -44,00 | ||||
| 2026-02-12 | 13F | Brown Brothers Harriman & Co | 0 | -100,00 | 0 | |||||
| 2026-02-17 | 13F | Two Sigma Investments, Lp | 21.751 | 208 | ||||||
| 2026-02-13 | 13F | Vontobel Holding Ltd. | 11.624 | 111 | ||||||
| 2026-02-17 | 13F | Evergreen Quality Fund GP, Ltd. | 80.700 | 771 | ||||||
| 2026-02-10 | 13F | AdvisorShares Investments LLC | 131.542 | 5,67 | 1.258 | -5,35 | ||||
| 2025-11-07 | 13F | Shell Asset Management Co | 2.164 | -68,31 | 0 | |||||
| 2026-01-23 | 13F | Stonehaven Wealth & Tax Solutions, Llc | 10.433 | 100 | ||||||
| 2026-02-02 | 13F | Cornerstone Planning Group LLC | 309 | 442,11 | 3 | 100,00 | ||||
| 2026-02-02 | 13F | Alliance Wealth Advisors, LLC /UT | 12.598 | -13,79 | 120 | -22,58 | ||||
| 2026-02-17 | 13F | Optiver Holding B.V. | 1 | 0 | ||||||
| 2026-02-11 | 13F | Jpmorgan Chase & Co | 238.374 | -79,48 | 2.279 | -81,62 | ||||
| 2026-02-11 | 13F | Harvest Fund Management Co., Ltd | 300.000 | 0,00 | 3 | -33,33 | ||||
| 2026-02-17 | 13F | Fund 1 Investments, LLC | 0 | -100,00 | 0 | |||||
| 2026-02-13 | 13F | Dymon Asia Capital (singapore) Pte. Ltd. | 0 | -100,00 | 0 | |||||
| 2026-02-06 | 13F | Abn Amro Investment Solutions | 14.992 | -19,36 | 143 | -27,78 |