Grundlæggende statistik
| Institutionelle ejere | 98 total, 90 long only, 0 short only, 8 long/short - change of 1,72% MRQ |
| Gennemsnitlig porteføljeallokering | 0.4589 % - change of -46,01% MRQ |
| Institutionelle aktier (lange) | 1.415.663 (ex 13D/G) - change of 0,15MM shares 9,98% MRQ |
| Institutionel værdi (lang) | $ 150.058 USD ($1000) |
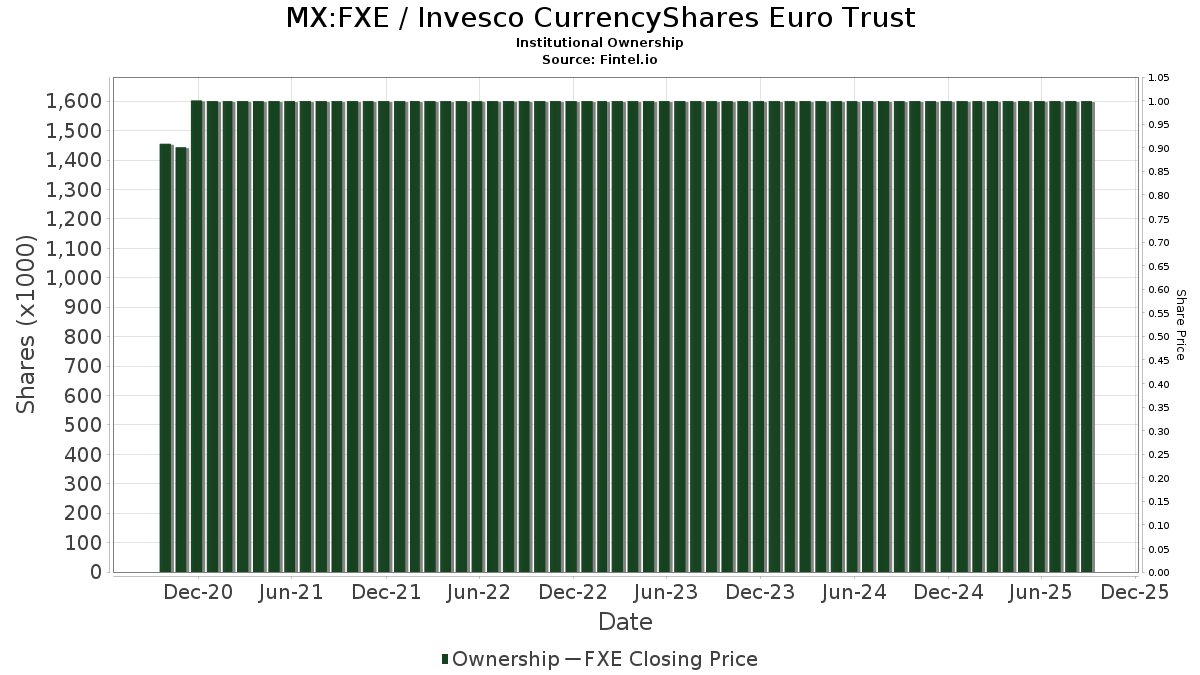
Institutionelt ejerskab og aktionærer
Invesco CurrencyShares Euro Trust (MX:FXE) har 98 institutionelle ejere og aktionærer, der har indsendt 13D/G- eller 13F-formularer til Securities Exchange Commission (SEC). Disse institutioner har i alt 1,415,663 aktier. Største aktionærer omfatter Morgan Stanley, Citadel Advisors Llc, Jane Street Group, Llc, Jane Street Group, Llc, Citadel Advisors Llc, Simplex Trading, Llc, Empowered Funds, LLC, Goldman Sachs Group Inc, Susquehanna International Group, Llp, and Susquehanna International Group, Llp .
Invesco CurrencyShares Euro Trust (BMV:FXE) institutionel ejerskabsstruktur viser aktuelle positioner i virksomheden efter institutioner og fonde, samt seneste ændringer i positionsstørrelse. Større aktionærer kan omfatte individuelle investorer, investeringsforeninger, hedgefonde eller institutioner. Skema 13D angiver, at investoren besidder (eller besidder) mere end 5 % af virksomheden og har til hensigt (eller har til hensigt at) aktivt at forfølge en ændring i forretningsstrategi. Skema 13G indikerer en passiv investering på over 5%.
Fondens stemningsscore
Fund Sentiment Score (fka Ownership Accumulation Score) finder de aktier, der bliver mest købt af fonde. Det er resultatet af en sofistikeret, multi-faktor kvantitativ model, der identificerer virksomheder med de højeste niveauer af institutionel akkumulering. Scoringsmodellen bruger en kombination af den samlede stigning i oplyste ejere, ændringerne i porteføljeallokeringer i disse ejere og andre målinger. Tallet går fra 0 til 100, hvor højere tal indikerer et højere niveau af akkumulering for sine jævnaldrende, og 50 er gennemsnittet.
Opdateringsfrekvens: Dagligt
Se Ownership Explorer, som giver en liste over højest rangerende virksomheder.
AI+ Ask Fintel’s AI assistant about Invesco CurrencyShares Euro Trust.
Select a question to share a public post with an AI-crafted answer.
Thinking of good questions…
13F og NPORT arkivering
Detaljer om 13F-arkivering er gratis. Detaljer om NP-ansøgninger kræver et premium-medlemskab. Grønne rækker angiver nye positioner. Røde rækker angiver lukkede positioner. Klik på linket ikon for at se den fulde transaktionshistorik.
Opgrader
for at låse premium-data op og eksportere til Excel ![]() .
.
| Fil dato | Kilde | Investor | Type | Gennemsnitlig pris (Øst) |
Aktier | Δ Aktier (%) |
Rapporteret Værdi ($1000) |
Δ Værdi (%) |
Port Alloc (%) |
|
|---|---|---|---|---|---|---|---|---|---|---|
| 2025-11-10 | 13F | Choate Investment Advisors | 0 | -100,00 | 0 | -100,00 | ||||
| 2025-10-31 | 13F | Investment House Llc | 0 | -100,00 | 0 | -100,00 | ||||
| 2026-02-11 | 13F | Jpmorgan Chase & Co | 7.146 | 198,00 | 775 | 199,23 | ||||
| 2026-01-26 | 13F | Cwm, Llc | 81 | 0,00 | 0 | |||||
| 2026-01-23 | 13F | Inlight Wealth Management, LLC | 3.002 | 0,00 | 326 | 0,00 | ||||
| 2026-02-12 | 13F | Hrt Financial Lp | 0 | -100,00 | 0 | |||||
| 2026-02-13 | 13F | SRS Capital Advisors, Inc. | 151 | 16 | ||||||
| 2025-11-14 | 13F | Warren Averett Asset Management, LLC | 0 | -100,00 | 0 | -100,00 | ||||
| 2026-01-27 | 13F | Belpointe Asset Management LLC | 11.379 | -11,77 | 1.234 | -11,67 | ||||
| 2026-02-12 | 13F | Jane Street Group, Llc | Call | 20.100 | -55,53 | 2.180 | -55,51 | |||
| 2026-02-12 | 13F | Jane Street Group, Llc | 128.889 | 19,35 | 13.979 | 19,44 | ||||
| 2026-02-12 | 13F | Jane Street Group, Llc | Put | 123.000 | 187,38 | 13.340 | 187,60 | |||
| 2026-02-17 | 13F | Creative Planning | 38.781 | 37,94 | 4.206 | 38,05 | ||||
| 2026-02-17 | 13F | Qube Research & Technologies Ltd | 7.562 | 290,60 | 820 | 292,34 | ||||
| 2026-02-13 | 13F | Stifel Financial Corp | 3.683 | -12,97 | 399 | -12,88 | ||||
| 2025-11-13 | 13F | Bank Of Montreal /can/ | 0 | -100,00 | 0 | -100,00 | ||||
| 2026-02-17 | 13F | Blair William & Co/il | 11.555 | 1.253 | ||||||
| 2025-11-03 | 13F | J. Safra Sarasin Holding AG | 0 | -100,00 | 0 | -100,00 | ||||
| 2025-11-10 | 13F | Pekin Hardy Strauss, Inc. | 0 | -100,00 | 0 | |||||
| 2026-02-13 | 13F | Morgan Stanley | 411.128 | -8,23 | 44.589 | -8,16 | ||||
| 2026-02-10 | 13F | David R. Rahn & Associates Inc. | 4.959 | 538 | ||||||
| 2026-02-19 | 13F | CI Private Wealth, LLC | 7.288 | -62,86 | 790 | -62,84 | ||||
| 2026-01-21 | 13F | Flagship Harbor Advisors, Llc | 595 | -92,93 | 65 | -92,98 | ||||
| 2026-02-13 | 13F | Mml Investors Services, Llc | 2.816 | -82,48 | 305 | -82,48 | ||||
| 2026-01-30 | 13F | Catalytic Wealth RIA, LLC | 5.994 | 0,00 | 650 | 0,15 | ||||
| 2026-02-11 | 13F | Empowered Funds, LLC | 75.872 | 8.224 | ||||||
| 2026-01-23 | 13F | Rsm Us Wealth Management Llc | 2.228 | -0,76 | 242 | -0,82 | ||||
| 2026-02-11 | 13F | LPL Financial LLC | 16.966 | -15,52 | 1.840 | -15,44 | ||||
| 2025-10-28 | 13F | Sage Capital Management, LLC | 0 | -100,00 | 0 | -100,00 | ||||
| 2026-02-12 | 13F | Commonwealth Equity Services, Llc | 20.590 | -0,55 | 2.233 | 111.550,00 | ||||
| 2026-02-13 | 13F | Alerus Financial Na | 1.861 | 0,00 | 202 | 0,00 | ||||
| 2026-04-17 | 13F | Nautilus Advisors LLC | 10.041 | 0,34 | 1.071 | -1,29 | ||||
| 2026-02-06 | 13F | Tortoise Investment Management, LLC | 0 | -100,00 | 0 | |||||
| 2026-02-09 | 13F | Key FInancial Inc | 1.060 | 0,00 | 115 | 0,00 | ||||
| 2026-02-12 | 13F | Renaissance Technologies Llc | 2.900 | -89,61 | 315 | -89,61 | ||||
| 2026-02-17 | 13F | Advisory Services Network, LLC | 46.880 | 4,74 | 5.084 | 4,82 | ||||
| 2026-02-17 | 13F | Royal Bank Of Canada | 10.299 | 176,26 | 1.117 | 176,49 | ||||
| 2026-02-10 | 13F | Goldman Sachs Group Inc | 75.009 | 0,00 | 8.135 | 0,09 | ||||
| 2025-11-14 | 13F | Mount Yale Investment Advisors, LLC | 0 | -100,00 | 0 | -100,00 | ||||
| 2026-02-17 | 13F | Basso Capital Management, L.p. | 0 | -100,00 | 0 | |||||
| 2026-02-10 | 13F | CIBC World Markets Inc. | 0 | -100,00 | 0 | -100,00 | ||||
| 2026-02-13 | 13F | Colony Group, LLC | 0 | -100,00 | 0 | -100,00 | ||||
| 2026-04-14 | 13F | Opal Wealth Advisors, LLC | 842 | -84,88 | 90 | -85,26 | ||||
| 2026-02-13 | 13F | Kestra Advisory Services, LLC | 1.014 | 110 | ||||||
| 2026-01-20 | 13F | Nvwm, Llc | 1.425 | 7,14 | 155 | 6,94 | ||||
| 2026-01-29 | 13F | Dunhill Financial, LLC | 342 | -8,31 | ||||||
| 2026-02-13 | 13F | MAI Capital Management | 55 | 0,00 | 6 | 0,00 | ||||
| 2026-01-30 | 13F | North Star Investment Management Corp. | 1.270 | -8,17 | 138 | -8,05 | ||||
| 2026-04-17 | 13F | Roxbury Financial LLC | 144 | 0,00 | 15 | 0,00 | ||||
| 2026-04-08 | 13F | Wealth Enhancement Advisory Services, Llc | 3.785 | -9,88 | 403 | -11,06 | ||||
| 2026-02-06 | 13F | EverSource Wealth Advisors, LLC | 1.008 | 0,20 | 109 | 0,93 | ||||
| 2025-11-05 | 13F | Ironwood Investment Counsel, LLC | 0 | -100,00 | 0 | |||||
| 2026-01-29 | 13F | Almanack Investment Partners, LLC. | 0 | -100,00 | 0 | |||||
| 2026-02-11 | 13F | GFS Advisors, LLC | 2.291 | 248 | ||||||
| 2025-11-13 | 13F | Bnp Paribas Arbitrage, Sa | 0 | -100,00 | 0 | -100,00 | ||||
| 2026-02-20 | 13F | Sunbelt Securities, Inc. | 48 | 0,00 | 5 | 0,00 | ||||
| 2026-03-06 | 13F | Hsbc Holdings Plc | 10.579 | -0,19 | 1.147 | -0,09 | ||||
| 2026-02-02 | 13F | Hussman Strategic Advisors, Inc. | 7.500 | 0,00 | 813 | 0,12 | ||||
| 2026-02-17 | 13F | Fmr Llc | 46 | 0,00 | 5 | 0,00 | ||||
| 2026-02-17 | 13F | Captrust Financial Advisors | 18.734 | -15,68 | 2.032 | -15,62 | ||||
| 2026-02-13 | 13F | Transamerica Financial Advisors, Inc. | 3 | 0 | ||||||
| 2025-11-14 | 13F | Wolverine Trading, Llc | 9.933 | 15,99 | 1.075 | 16,11 | ||||
| 2025-11-14 | 13F | Wolverine Trading, Llc | Call | 18.000 | -35,94 | 1.948 | -35,89 | |||
| 2026-01-16 | 13F | Augustine Asset Management Inc | 0 | -100,00 | 0 | |||||
| 2025-11-14 | 13F | Wolverine Trading, Llc | Put | 10.800 | -11,48 | 1.169 | -11,38 | |||
| 2026-01-22 | 13F | Yoder Wealth Management, Inc. | 5.000 | 127,27 | 542 | 127,73 | ||||
| 2026-01-22 | 13F | Brookwood Investment Group LLC | 0 | -100,00 | 0 | |||||
| 2026-02-10 | 13F | Verus Capital Partners, Llc | 6.351 | 89,75 | 689 | 90,06 | ||||
| 2026-01-23 | 13F | Nbt Bank N A /ny | 200 | 0,00 | 22 | 0,00 | ||||
| 2026-02-13 | 13F | Wells Fargo & Company/mn | 34.806 | -49,60 | 3.775 | -49,57 | ||||
| 2026-02-13 | 13F | Flow Traders U.s. Llc | 12.071 | 13,23 | 1 | 0,00 | ||||
| 2026-02-13 | 13F | Klingenstein Fields & Co Lp | 0 | -100,00 | 0 | -100,00 | ||||
| 2026-02-13 | 13F | Gts Securities Llc | 3.723 | -17,54 | 404 | -17,59 | ||||
| 2026-04-10 | 13F | Pure Financial Advisors, Inc. | 4.259 | 0,00 | 454 | -1,52 | ||||
| 2026-04-13 | 13F | Fiduciary Financial Group, Llc | 3.887 | 1,97 | 415 | 0,24 | ||||
| 2026-02-02 | 13F | Oppenheimer & Co Inc | 12.700 | -66,38 | 1.377 | -66,36 | ||||
| 2026-02-11 | 13F | Parallel Advisors, LLC | 1.040 | 0,00 | 113 | 0,00 | ||||
| 2026-01-28 | 13F | Geneos Wealth Management Inc. | 184 | 20 | ||||||
| 2026-02-06 | 13F | HighTower Advisors, LLC | 2.464 | -1,60 | 267 | -1,48 | ||||
| 2025-11-14 | 13F | Ameriprise Financial Inc | 0 | -100,00 | 0 | -100,00 | ||||
| 2026-02-17 | 13F | National Asset Management, Inc. | 5.099 | 553 | ||||||
| 2026-01-27 | 13F | Lodestar Private Asset Management Llc | 2.178 | 0,00 | 236 | 0,00 | ||||
| 2026-02-17 | 13F | Parallax Volatility Advisers, L.P. | 5.180 | 0,00 | 562 | 0,00 | ||||
| 2026-02-23 | 13F | Virtu Financial LLC | 10.462 | -61,97 | 1 | -50,00 | ||||
| 2026-01-30 | 13F | Exencial Wealth Advisors, Llc | 5.588 | 0,00 | 606 | 0,17 | ||||
| 2026-02-17 | 13F | Bank Of America Corp /de/ | 22.508 | 67,28 | 2.441 | 67,42 | ||||
| 2026-04-17 | 13F | Baker Ellis Asset Management LLC | 0 | -100,00 | 0 | |||||
| 2025-11-12 | 13F | Group One Trading, L.p. | 0 | -100,00 | 0 | -100,00 | ||||
| 2026-02-02 | 13F | Mutual Advisors, LLC | 1.869 | 0,00 | 203 | 1,00 | ||||
| 2026-04-14 | 13F | Prospera Financial Services Inc | 2.525 | 0,00 | 269 | -1,47 | ||||
| 2026-02-05 | 13F | Cambridge Investment Research Advisors, Inc. | 8.292 | 23,89 | 1 | |||||
| 2026-01-29 | 13F | Ashton Thomas Private Wealth, LLC | 15.398 | 0,00 | 1.670 | 0,06 | ||||
| 2026-01-23 | 13F | Legacy Bridge, LLC | 450 | 0,00 | 49 | 0,00 | ||||
| 2026-02-17 | 13F | Scarborough Advisors, LLC | 185 | 0,00 | 20 | 0,00 | ||||
| 2026-01-23 | 13F | Altfest L J & Co Inc | 2.344 | 254 | ||||||
| 2026-01-29 | 13F | IMC-Chicago, LLC | Put | 14.400 | 1.562 | |||||
| 2026-01-29 | 13F | IMC-Chicago, LLC | Call | 42.800 | 51,77 | 4.642 | 51,87 | |||
| 2026-02-17 | 13F | Citadel Advisors Llc | 19.908 | -59,02 | 2.159 | -58,98 | ||||
| 2026-02-17 | 13F | Citadel Advisors Llc | Call | 117.300 | 163,60 | 12.722 | 163,81 | |||
| 2026-02-17 | 13F | Citadel Advisors Llc | Put | 226.100 | -25,97 | 24.522 | -25,91 | |||
| 2025-11-14 | 13F | Two Sigma Securities, Llc | 0 | -100,00 | 0 | -100,00 | ||||
| 2025-11-10 | 13F | Citigroup Inc | 0 | -100,00 | 0 | -100,00 | ||||
| 2026-02-19 | 13F | Atomi Financial Group, Inc. | 1.981 | 215 | ||||||
| 2025-11-05 | 13F | Waterloo Capital, L.P. | 0 | -100,00 | 0 | -100,00 | ||||
| 2026-02-17 | 13F | Susquehanna International Group, Llp | Call | 72.700 | -13,76 | 7.885 | -13,68 | |||
| 2026-04-07 | 13F | Farther Finance Advisors, LLC | 1.900 | 660,00 | 203 | 648,15 | ||||
| 2026-02-17 | 13F | Susquehanna International Group, Llp | 54.458 | 3,59 | 5.906 | 3,69 | ||||
| 2026-02-17 | 13F | Susquehanna International Group, Llp | Put | 2.000 | -94,32 | 217 | -94,34 | |||
| 2026-03-03 | 13F | NWF Advisory Services Inc. | 0 | -100,00 | 0 | |||||
| 2026-01-27 | 13F | Northern Financial Advisors Inc | 0 | -100,00 | 0 | -100,00 | ||||
| 2026-04-07 | 13F | Blueline Advisors Llc | 97 | 4,30 | 10 | 0,00 | ||||
| 2026-01-29 | 13F | UBS Group AG | 20.748 | -35,08 | 2.250 | -35,03 | ||||
| 2026-01-13 | 13F | Kathmere Capital Management, LLC | 11.109 | 0,00 | 1.205 | 0,08 | ||||
| 2026-02-14 | 13F | Rockefeller Capital Management L.P. | 5.825 | 131,52 | 632 | 131,99 | ||||
| 2026-02-17 | 13F | Tower Research Capital LLC (TRC) | 0 | -100,00 | 0 | |||||
| 2026-01-16 | 13F | Crewe Advisors LLC | 0 | -100,00 | 0 | |||||
| 2026-02-10 | 13F/A | Northwestern Mutual Wealth Management Co | 24 | 3 | ||||||
| 2026-02-12 | 13F | Federation des caisses Desjardins du Quebec | 1.223 | 0,00 | 133 | 0,00 | ||||
| 2025-11-04 | 13F | IMC-Chicago, LLC | 0 | -100,00 | 0 | -100,00 | ||||
| 2026-02-11 | 13F | Cerity Partners LLC | 2.100 | 228 | ||||||
| 2026-02-17 | 13F | Advisor Group Holdings, Inc. | 1.199 | 33,82 | 130 | 34,02 | ||||
| 2025-11-14 | 13F | Comerica Bank | 0 | -100,00 | 0 | |||||
| 2026-02-10 | 13F | Envestnet Asset Management Inc | 7.619 | 73,20 | 826 | 73,53 | ||||
| 2026-02-09 | 13F | Hartland & Co., LLC | 1.638 | 0,00 | 178 | 0,00 | ||||
| 2026-02-10 | 13F | Greenspring Advisors, LLC | 4.964 | 11,10 | 538 | 11,16 | ||||
| 2026-02-10 | 13F | Measured Wealth Private Client Group, LLC | 831 | 0,00 | 90 | 0,00 | ||||
| 2025-11-14 | 13F | Cetera Investment Advisers | 0 | -100,00 | 0 | -100,00 | ||||
| 2026-02-04 | 13F | Tsfg, Llc | 230 | 0,00 | 0 | |||||
| 2025-11-14 | 13F | Raymond James Financial Inc | 0 | -100,00 | 0 | -100,00 | ||||
| 2026-02-13 | 13F | Walleye Trading LLC | Call | 8.800 | 0,00 | 954 | 0,10 | |||
| 2025-10-30 | 13F | Bailard, Inc. | 0 | -100,00 | 0 | -100,00 | ||||
| 2026-01-16 | 13F | Ronald Blue Trust, Inc. | 0 | -100,00 | 0 | -100,00 | ||||
| 2025-11-13 | 13F | Clear Street Markets Llc | Put | 0 | -100,00 | 0 | -100,00 | |||
| 2025-11-10 | 13F | Efficient Advisors, LLC | 0 | -100,00 | 0 | -100,00 | ||||
| 2026-01-30 | 13F | Joel Isaacson & Co., LLC | 2.978 | 0,00 | 323 | 0,00 | ||||
| 2025-11-13 | 13F | BTG Pactual Asset Management US LLC | Call | 0 | -100,00 | 0 | -100,00 | |||
| 2026-02-12 | 13F | Haven Private, LLC | 4.120 | -47,66 | 447 | -47,71 | ||||
| 2026-01-27 | 13F | TD Waterhouse Canada Inc. | 1.720 | 0,00 | 186 | 0,00 | ||||
| 2026-02-05 | 13F | Leuthold Group, Llc | 41.165 | -1,30 | 4.465 | -1,22 | ||||
| 2026-02-12 | 13F | Resurgent Financial Advisors LLC | 23.464 | 2,02 | 2.545 | 2,09 | ||||
| 2026-02-11 | 13F | Group One Trading, L.p. | Put | 300 | 0,00 | 33 | 0,00 | |||
| 2025-11-13 | 13F | GeoWealth Management, LLC | 0 | -100,00 | 0 | -100,00 | ||||
| 2025-11-13 | 13F | BTG Pactual Asset Management US LLC | Put | 0 | -100,00 | 0 | -100,00 | |||
| 2026-02-11 | 13F | Group One Trading, L.p. | Call | 2.000 | -28,57 | 217 | -28,71 | |||
| 2026-02-13 | 13F | Quattro Advisors LLC | 60 | 7 | ||||||
| 2025-12-16 | 13F | Garde Capital, Inc. | 0 | -100,00 | 0 | -100,00 | ||||
| 2025-11-14 | 13F | Millennium Management Llc | Put | 0 | -100,00 | 0 | -100,00 | |||
| 2026-02-13 | 13F | Squarepoint Ops LLC | Call | 5.900 | 0,00 | 640 | 0,00 | |||
| 2025-11-14 | 13F | Millennium Management Llc | Call | 0 | -100,00 | 0 | -100,00 | |||
| 2026-02-02 | 13F | Summit Place Financial Advisors, LLC | 20.300 | 13,28 | 2.202 | 13,40 | ||||
| 2026-02-13 | 13F | Marshall Wace, Llp | 3.600 | 0,00 | 390 | 0,00 | ||||
| 2026-02-11 | 13F | Simplex Trading, Llc | 46.247 | 136,05 | 5.016 | 250.650,00 | ||||
| 2026-02-13 | 13F | Marshall Wace, Llp | Put | 5.300 | 10,42 | 575 | 10,38 | |||
| 2026-02-11 | 13F | Simplex Trading, Llc | Call | 5.600 | 60,00 | 607 | ||||
| 2026-02-13 | 13F | Marshall Wace, Llp | Call | 5.000 | 163,16 | 542 | 164,39 | |||
| 2026-02-11 | 13F | Simplex Trading, Llc | Put | 86.800 | 135,23 | 9.414 | 313.666,67 |
Other Listings
| US:FXE | 108,65 $ |