Grundlæggende statistik
| Institutionelle aktier (lange) | 82.595.375 - 66,54% (ex 13D/G) - change of 0,83MM shares 0,76% MRQ |
| Institutionel værdi (lang) | $ 146.421 USD ($1000) |
Institutionelt ejerskab og aktionærer
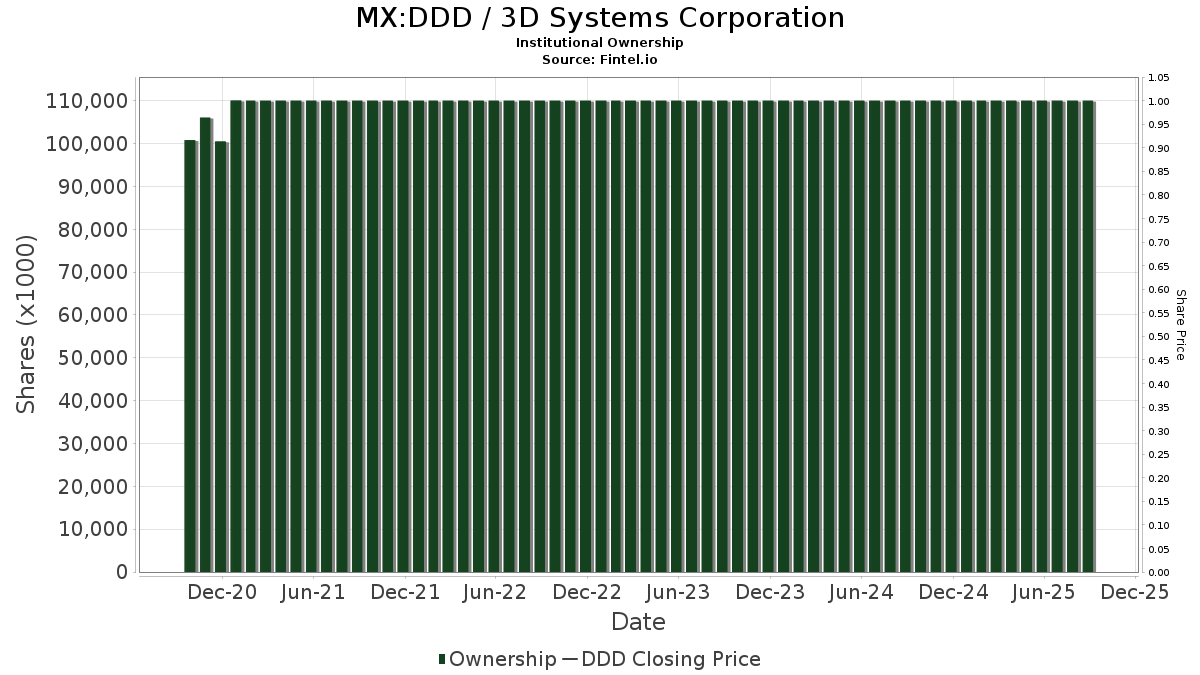
3D Systems Corporation (MX:DDD) har 191 institutionelle ejere og aktionærer, der har indsendt 13D/G- eller 13F-formularer til Securities Exchange Commission (SEC). Disse institutioner har i alt 82,595,375 aktier. Største aktionærer omfatter State Street Corp, BlackRock, Inc., Vanguard Group Inc, Capital World Investors, D. E. Shaw & Co., Inc., Geode Capital Management, Llc, Nuveen, LLC, Silverberg Bernstein Capital Management LLC, Two Sigma Investments, Lp, and Two Sigma Advisers, Lp .
3D Systems Corporation (BMV:DDD) institutionel ejerskabsstruktur viser aktuelle positioner i virksomheden efter institutioner og fonde, samt seneste ændringer i positionsstørrelse. Større aktionærer kan omfatte individuelle investorer, investeringsforeninger, hedgefonde eller institutioner. Skema 13D angiver, at investoren besidder (eller besidder) mere end 5 % af virksomheden og har til hensigt (eller har til hensigt at) aktivt at forfølge en ændring i forretningsstrategi. Skema 13G indikerer en passiv investering på over 5%.
Fondens stemningsscore
Fund Sentiment Score (fka Ownership Accumulation Score) finder de aktier, der bliver mest købt af fonde. Det er resultatet af en sofistikeret, multi-faktor kvantitativ model, der identificerer virksomheder med de højeste niveauer af institutionel akkumulering. Scoringsmodellen bruger en kombination af den samlede stigning i oplyste ejere, ændringerne i porteføljeallokeringer i disse ejere og andre målinger. Tallet går fra 0 til 100, hvor højere tal indikerer et højere niveau af akkumulering for sine jævnaldrende, og 50 er gennemsnittet.
Opdateringsfrekvens: Dagligt
Se Ownership Explorer, som giver en liste over højest rangerende virksomheder.
AI+ Ask Fintel’s AI assistant about 3D Systems Corporation.
Select a question to share a public post with an AI-crafted answer.
Thinking of good questions…
13F og NPORT arkivering
Detaljer om 13F-arkivering er gratis. Detaljer om NP-ansøgninger kræver et premium-medlemskab. Grønne rækker angiver nye positioner. Røde rækker angiver lukkede positioner. Klik på linket ikon for at se den fulde transaktionshistorik.
Opgrader
for at låse premium-data op og eksportere til Excel ![]() .
.
| Fil dato | Kilde | Investor | Type | Gennemsnitlig pris (Øst) |
Aktier | Δ Aktier (%) |
Rapporteret Værdi ($1000) |
Δ Værdi (%) |
Port Alloc (%) |
|
|---|---|---|---|---|---|---|---|---|---|---|
| 2026-02-17 | 13F | XTX Topco Ltd | 316.684 | -20,62 | 561 | -51,56 | ||||
| 2026-02-11 | 13F | Hilton Head Capital Partners, LLC | 46 | 0 | ||||||
| 2026-02-17 | 13F | Raymond James Financial Inc | 71.929 | -0,69 | 127 | -39,52 | ||||
| 2026-01-29 | 13F | UBS Group AG | 2.117.975 | 83,09 | 3.749 | 11,75 | ||||
| 2026-01-23 | 13F | Robbins Farley Llc | 0 | -100,00 | 0 | |||||
| 2026-02-17 | 13F | Edmond De Rothschild Holding S.a. | 0 | -100,00 | 0 | |||||
| 2026-01-14 | 13F | ORG Wealth Partners, LLC | 157 | 0,00 | 0 | |||||
| 2026-02-17 | 13F | EFG International AG | 700 | 1 | ||||||
| 2026-02-11 | 13F | MCF Advisors LLC | 0 | -100,00 | 0 | |||||
| 2026-01-21 | 13F | Newbridge Financial Services Group, Inc. | 0 | -100,00 | 0 | |||||
| 2026-02-10 | 13F/A | Northwestern Mutual Wealth Management Co | 67 | 0,00 | 0 | |||||
| 2026-02-05 | 13F | Teton Advisors, LLC | 40.000 | 0,00 | 71 | -39,66 | ||||
| 2026-02-13 | 13F | Barclays Plc | 195.334 | -0,08 | 346 | -39,05 | ||||
| 2026-02-09 | 13F | Penn Capital Management Co Inc | 1.292.379 | 992,08 | 2.288 | 566,76 | ||||
| 2026-02-06 | 13F | Bare Financial Services, Inc | 0 | -100,00 | 0 | |||||
| 2026-02-13 | 13F | Mariner, LLC | 22.838 | -52,27 | 40 | -71,01 | ||||
| 2025-11-03 | 13F | AE Wealth Management LLC | 0 | -100,00 | 0 | -100,00 | ||||
| 2026-02-12 | 13F | Renaissance Technologies Llc | 997.907 | -33,13 | 1.766 | -59,19 | ||||
| 2026-02-05 | 13F | Tucker Asset Management Llc | 704 | 1 | ||||||
| 2026-02-12 | 13F | BlackRock, Inc. | 9.715.438 | -0,60 | 17.196 | -39,33 | ||||
| 2026-02-17 | 13F | Citadel Advisors Llc | 1.188.245 | -52,76 | 2.103 | -71,17 | ||||
| 2026-02-05 | 13F | Bessemer Group Inc | 500 | 0 | ||||||
| 2026-02-17 | 13F | Citadel Advisors Llc | Call | 305.400 | -1,86 | 541 | -40,13 | |||
| 2026-02-17 | 13F | Citadel Advisors Llc | Put | 142.300 | 34,75 | 252 | -17,97 | |||
| 2026-02-05 | 13F | GABELLI & Co INVESTMENT ADVISERS, INC. | 0 | -100,00 | 0 | |||||
| 2026-02-10 | 13F | Belvedere Trading LLC | Call | 10.100 | 1,00 | 18 | -41,38 | |||
| 2026-02-17 | 13F | Tower Research Capital LLC (TRC) | 11.109 | 8,54 | 20 | -34,48 | ||||
| 2026-01-15 | 13F | Nisa Investment Advisors, Llc | 686 | -71,13 | 1 | -83,33 | ||||
| 2026-02-13 | 13F | Prudential Financial Inc | 0 | -100,00 | 0 | |||||
| 2026-02-12 | 13F | Cibc World Markets Corp | 0 | -100,00 | 0 | |||||
| 2026-02-17 | 13F | Two Sigma Investments, Lp | 2.511.590 | 36,79 | 4.446 | -16,51 | ||||
| 2026-04-06 | 13F | GAMMA Investing LLC | 1.616 | -35,57 | 3 | -25,00 | ||||
| 2026-02-17 | 13F | Atom Investors LP | 52.078 | 46,59 | 92 | -10,68 | ||||
| 2026-04-15 | 13F | Fortitude Family Office, LLC | 532 | 74,43 | 1 | |||||
| 2026-02-06 | 13F | Pnc Financial Services Group, Inc. | 550 | 0,00 | 1 | -100,00 | ||||
| 2026-02-17 | 13F | Quadrature Capital Ltd | 49.755 | 88 | ||||||
| 2026-02-10 | 13F | Goldman Sachs Group Inc | 901.863 | -56,13 | 1.596 | -73,23 | ||||
| 2026-02-11 | 13F | Jpmorgan Chase & Co | 884.020 | -34,13 | 1.565 | -59,82 | ||||
| 2026-02-11 | 13F | Jpmorgan Chase & Co | Call | 400 | 0,00 | 1 | -100,00 | |||
| 2026-02-12 | 13F | Federation des caisses Desjardins du Quebec | 1.520 | -39,20 | 3 | -71,43 | ||||
| 2026-02-12 | 13F | EntryPoint Capital, LLC | 0 | -100,00 | 0 | |||||
| 2025-11-14 | 13F | Skopos Labs, Inc. | 0 | -100,00 | 0 | -100,00 | ||||
| 2026-02-13 | 13F | Charles Schwab Investment Management Inc | 1.081.067 | -0,07 | 1.913 | -39,02 | ||||
| 2026-01-26 | 13F | Cwm, Llc | 2.049 | -22,30 | 0 | |||||
| 2026-02-17 | 13F | ExodusPoint Capital Management, LP | 0 | -100,00 | 0 | -100,00 | ||||
| 2026-02-13 | 13F/A | Texas Permanent School Fund | 0 | -100,00 | 0 | |||||
| 2026-01-23 | 13F | Ogorek Anthony Joseph /ny/ /adv | 25 | 0,00 | 0 | |||||
| 2026-02-05 | 13F | Allworth Financial LP | 1.735 | -10,34 | 3 | -40,00 | ||||
| 2026-02-11 | 13F | Simplex Trading, Llc | Call | 117.900 | -9,79 | 209 | ||||
| 2026-02-12 | 13F | Bank Of Montreal /can/ | 0 | -100,00 | 0 | |||||
| 2026-02-11 | 13F | Simplex Trading, Llc | Put | 90.500 | -34,42 | 160 | ||||
| 2026-02-06 | 13F | Transce3nd, LLC | 0 | -100,00 | 0 | |||||
| 2026-02-11 | 13F | Simplex Trading, Llc | 536 | -99,56 | 1 | |||||
| 2025-11-12 | 13F | Gamco Investors, Inc. Et Al | 0 | -100,00 | 0 | -100,00 | ||||
| 2025-10-27 | 13F | Belvedere Trading LLC | Put | 0 | -100,00 | 0 | -100,00 | |||
| 2026-02-10 | 13F | Root Financial Partners, LLC | 0 | -100,00 | 0 | |||||
| 2026-02-18 | 13F | Beacon Pointe Advisors, LLC | 25.600 | 0,00 | 45 | -39,19 | ||||
| 2026-02-17 | 13F | MIRAE ASSET GLOBAL ETFS HOLDINGS Ltd. | 57.877 | -5,49 | 102 | -42,37 | ||||
| 2026-02-13 | 13F | Rhumbline Advisers | 169.165 | -12,70 | 299 | -46,70 | ||||
| 2026-02-06 | 13F | Gsa Capital Partners Llp | 0 | -100,00 | 0 | |||||
| 2026-02-11 | 13F | ARK Investment Management LLC | 945.298 | -43,75 | 1.673 | -65,67 | ||||
| 2026-04-13 | 13F | Ledgewood Wealth Advisors, LLC | 350.200 | 0,00 | 658 | 6,30 | ||||
| 2026-02-12 | 13F | CIBC Private Wealth Group, LLC | 748 | 0,00 | 1 | -50,00 | ||||
| 2026-02-13 | 13F | Manufacturers Life Insurance Company, The | 0 | -100,00 | 0 | |||||
| 2026-01-27 | 13F | TD Waterhouse Canada Inc. | 1.475 | -4,84 | 3 | -50,00 | ||||
| 2026-01-12 | 13F | AllSquare Wealth Management LLC | 560 | 0,00 | 2 | |||||
| 2026-02-17 | 13F | Balyasny Asset Management Llc | 49.736 | 88 | ||||||
| 2026-02-12 | 13F | Hollencrest Capital Management | 3.000 | 0,00 | 5 | -37,50 | ||||
| 2026-02-12 | 13F | Steward Partners Investment Advisory, Llc | 10 | 0 | ||||||
| 2026-02-13 | 13F | Walleye Capital LLC | Call | 51.500 | 8.483,33 | 91 | 9.000,00 | |||
| 2026-02-13 | 13F | Walleye Capital LLC | Put | 13.100 | 95,52 | 23 | 21,05 | |||
| 2026-02-13 | 13F | Walleye Capital LLC | 2.767 | -7,83 | 5 | -50,00 | ||||
| 2026-02-10 | 13F | Axq Capital, Lp | 0 | -100,00 | 0 | |||||
| 2026-02-12 | 13F | Voya Investment Management Llc | 23.628 | 0,00 | 42 | -39,71 | ||||
| 2026-02-11 | 13F | Manchester Capital Management LLC | 0 | -100,00 | 0 | -100,00 | ||||
| 2026-02-12 | 13F | Xponance, Inc. | 0 | -100,00 | 0 | |||||
| 2026-02-06 | 13F | Larson Financial Group LLC | 2.193 | -54,86 | 4 | -78,57 | ||||
| 2026-02-10 | 13F | Quantbot Technologies LP | 98.559 | 35,77 | 174 | -17,14 | ||||
| 2026-02-09 | 13F | Harbour Investments, Inc. | 777 | 0,00 | 1 | -50,00 | ||||
| 2026-01-22 | 13F | Financial Consulate, Inc | 100 | 0,00 | 0 | |||||
| 2026-01-26 | 13F | Riverview Trust Co | 1.000 | 0,00 | 2 | -50,00 | ||||
| 2026-02-10 | 13F | CIBC Asset Management Inc | 20.088 | 36 | ||||||
| 2026-02-17 | 13F | Fmr Llc | 6.285 | 48,76 | 11 | -8,33 | ||||
| 2025-11-03 | 13F | Kapitalo Investimentos Ltda | 0 | -100,00 | 0 | -100,00 | ||||
| 2026-04-13 | 13F | St Germain D J Co Inc | 50 | 0,00 | 0 | |||||
| 2026-02-12 | 13F | MetLife Investment Management, LLC | 36.419 | -43,30 | 64 | -65,59 | ||||
| 2026-02-05 | 13F | Pinnacle Associates Ltd | 323.272 | 72,58 | 572 | 5,34 | ||||
| 2026-01-23 | 13F | Westside Investment Management, Inc. | 98 | 0,00 | 0 | |||||
| 2025-11-12 | 13F | Teachers Retirement System Of The State Of Kentucky | 0 | -100,00 | 0 | |||||
| 2026-02-17 | 13F | Russell Investments Group, Ltd. | 14.505 | -66,22 | 26 | -79,84 | ||||
| 2026-02-12 | 13F | New York State Common Retirement Fund | 21.502 | 0,00 | 38 | -38,71 | ||||
| 2026-02-13 | 13F | Sterling Capital Management LLC | 7.189 | -20,96 | 13 | -53,85 | ||||
| 2026-01-27 | 13F | GHP Investment Advisors, Inc. | 225 | 0,00 | 0 | |||||
| 2026-02-11 | 13F | Group One Trading, L.p. | Put | 151.900 | 9,20 | 269 | -33,50 | |||
| 2026-02-11 | 13F | Group One Trading, L.p. | 11.579 | -43,72 | 20 | -66,10 | ||||
| 2026-02-11 | 13F | Group One Trading, L.p. | Call | 476.300 | -11,55 | 843 | -46,00 | |||
| 2026-02-12 | 13F | Nuveen, LLC | 2.704.430 | 406,43 | 4.787 | 209,17 | ||||
| 2026-04-15 | 13F | Activest Wealth Management | 644 | 0,00 | 1 | 0,00 | ||||
| 2026-02-13 | 13F | Glen Eagle Advisors, LLC | 30 | 0,00 | 0 | |||||
| 2026-02-17 | 13F | Millennium Management Llc | Call | 177.300 | 314 | |||||
| 2026-02-17 | 13F | Millennium Management Llc | 1.282.926 | 1.832,38 | 2.271 | 1.082,29 | ||||
| 2026-02-17 | 13F | Cresset Asset Management, LLC | 15.144 | 2,49 | 27 | -38,10 | ||||
| 2026-02-24 | 13F/A | Pacer Advisors, Inc. | 42.478 | -20,64 | 75 | -51,61 | ||||
| 2026-02-13 | 13F | Citigroup Inc | 10.392 | 126,31 | 18 | 38,46 | ||||
| 2025-11-14 | 13F | Wolverine Trading, Llc | 73.973 | 41,68 | 219 | 175,95 | ||||
| 2025-11-14 | 13F | Wolverine Trading, Llc | Call | 127.200 | 218,80 | 377 | 526,67 | |||
| 2025-11-14 | 13F | Wolverine Trading, Llc | Put | 45.900 | 28,57 | 136 | 150,00 | |||
| 2026-04-16 | 13F | Silverberg Bernstein Capital Management LLC | 2.653.912 | 3,16 | 4.989 | 9,58 | ||||
| 2026-02-17 | 13F | Price T Rowe Associates Inc /md/ | 116.997 | 0,00 | 0 | |||||
| 2026-03-03 | 13F/A | Caitong International Asset Management Co., Ltd | 12.062 | -35,73 | 21 | -61,11 | ||||
| 2025-11-12 | 13F | Ameriflex Group, Inc. | 0 | -100,00 | 0 | |||||
| 2026-02-17 | 13F | Aqr Capital Management Llc | 11.034 | -74,93 | 20 | -85,04 | ||||
| 2025-11-06 | 13F | Abich Financial Wealth Management LLC | 0 | -100,00 | 0 | |||||
| 2026-02-03 | 13F | SBI Securities Co., Ltd. | 30.535 | 8,93 | 54 | -33,33 | ||||
| 2025-10-28 | 13F | CarsonAllaria Wealth Management, Ltd. | 0 | -100,00 | 0 | -100,00 | ||||
| 2026-02-10 | 13F | Bank of New York Mellon Corp | 379.135 | -1,78 | 671 | -40,04 | ||||
| 2026-02-10 | 13F | Belvedere Trading LLC | 0 | -100,00 | 0 | -100,00 | ||||
| 2026-02-17 | 13F | Tudor Investment Corp Et Al | 772.424 | 1,10 | 1.367 | -38,28 | ||||
| 2025-11-14 | 13F | Ancora Advisors, LLC | 0 | -100,00 | 0 | |||||
| 2026-02-12 | 13F | Commonwealth Equity Services, Llc | 39.842 | 2,93 | 71 | |||||
| 2026-01-21 | 13F | Sound Income Strategies, LLC | 200 | 1 | ||||||
| 2026-04-17 | 13F | Kentucky Trust Co | 200 | 0,00 | 0 | |||||
| 2026-04-15 | 13F | Atwood & Palmer Inc | 50 | 0,00 | 0 | |||||
| 2026-02-17 | 13F | Dark Forest Capital Management Lp | 0 | -100,00 | 0 | -100,00 | ||||
| 2026-02-17 | 13F | Schonfeld Strategic Advisors LLC | 55.826 | 99 | ||||||
| 2026-02-13 | 13F | Verition Fund Management LLC | 270.437 | 32,03 | 479 | -19,39 | ||||
| 2026-02-12 | 13F | State Board Of Administration Of Florida Retirement System | 48.771 | 0,00 | 86 | -39,01 | ||||
| 2026-02-13 | 13F | Vontobel Holding Ltd. | 60.750 | 0,83 | 108 | -38,51 | ||||
| 2026-02-13 | 13F | Public Employees Retirement Association Of Colorado | 20.046 | 0,00 | 0 | |||||
| 2026-02-05 | 13F | Baader Bank INC | 11.376 | -70,29 | 12 | -82,35 | ||||
| 2026-01-26 | 13F | Wealth Effects Llc | 93.492 | -44,91 | 165 | -66,46 | ||||
| 2026-02-13 | 13F | Smartleaf Asset Management LLC | 200 | 0 | ||||||
| 2026-01-26 | 13F | PFG Investments, LLC | 83.185 | 147 | ||||||
| 2026-01-29 | 13F | IMC-Chicago, LLC | 292.689 | 27,91 | 518 | -21,87 | ||||
| 2026-02-11 | 13F | Ameritas Investment Partners, Inc. | 12.675 | 22 | ||||||
| 2026-01-29 | 13F | IMC-Chicago, LLC | Put | 265.800 | 44,14 | 470 | -11,99 | |||
| 2026-01-29 | 13F | IMC-Chicago, LLC | Call | 257.400 | -24,93 | 456 | -54,23 | |||
| 2026-02-12 | 13F | Hrt Financial Lp | 125.938 | 0 | ||||||
| 2025-11-14 | 13F | Point72 Europe (London) LLP | 2.593 | 8 | ||||||
| 2026-04-10 | 13F | YHB Investment Advisors, Inc. | 0 | -100,00 | 0 | |||||
| 2026-02-13 | 13F | Y-Intercept (Hong Kong) Ltd | 15.775 | 28 | ||||||
| 2026-02-18 | 13F | GWM Advisors LLC | 7.835 | -69,87 | 14 | -82,67 | ||||
| 2026-02-11 | 13F | Los Angeles Capital Management Llc | 87.800 | 73,53 | 248 | 69,18 | ||||
| 2026-02-17 | 13F | Two Sigma Advisers, Lp | 2.375.300 | 0,64 | 4.204 | -38,57 | ||||
| 2026-02-04 | 13F | Ameritas Advisory Services, LLC | 0 | -100,00 | 0 | |||||
| 2026-02-09 | 13F | Key FInancial Inc | 419 | 0,00 | 1 | -100,00 | ||||
| 2026-02-09 | 13F | Legal & General Group Plc | 11.075 | 0,00 | 20 | -40,62 | ||||
| 2026-04-07 | 13F | Farther Finance Advisors, LLC | 714 | 113,77 | 1 | |||||
| 2025-11-14 | 13F | Brevan Howard Capital Management LP | 0 | -100,00 | 0 | -100,00 | ||||
| 2026-02-13 | 13F | Victory Capital Management Inc | 14.148 | -0,17 | 25 | -39,02 | ||||
| 2026-02-05 | 13F | Amalgamated Bank | 3.918 | -11,76 | 0 | |||||
| 2026-02-13 | 13F | C M Bidwell & Associates Ltd | 300 | 1 | ||||||
| 2026-02-06 | 13F | Bastion Asset Management Inc. | 0 | -100,00 | 0 | |||||
| 2026-02-17 | 13F | California State Teachers Retirement System | 7.669 | -7,05 | 14 | -43,48 | ||||
| 2025-11-07 | 13F | Murphy & Mullick Capital Management Corp | 0 | -100,00 | 0 | |||||
| 2026-01-29 | 13F | Vanguard Group Inc | 7.254.026 | -0,91 | 12.840 | -39,52 | ||||
| 2026-02-17 | 13F | Bridgeway Capital Management Inc | 71.500 | 0,00 | 127 | -39,13 | ||||
| 2025-10-20 | 13F | Forefront Wealth Partners, LLC | 0 | -100,00 | 0 | -100,00 | ||||
| 2026-02-13 | 13F | American Century Companies Inc | 54.221 | 96 | ||||||
| 2026-02-13 | 13F | Headlands Technologies LLC | 0 | -100,00 | 0 | |||||
| 2025-11-14 | 13F | Zurcher Kantonalbank (Zurich Cantonalbank) | 0 | -100,00 | 0 | |||||
| 2026-02-09 | 13F | Huntington National Bank | 501 | 0,00 | 1 | -100,00 | ||||
| 2026-04-09 | 13F | Pacifica Partners Inc. | 33 | 0,00 | 0 | |||||
| 2026-02-13 | 13F | Jacobs Levy Equity Management, Inc | 0 | -100,00 | 0 | |||||
| 2025-12-15 | 13F | FNY Investment Advisers, LLC | Call | 0 | -100,00 | 0 | ||||
| 2026-02-06 | 13F | Covestor Ltd | 19 | -5,00 | 0 | |||||
| 2026-02-06 | 13F | Global Retirement Partners, LLC | 114 | 1,79 | 0 | |||||
| 2026-02-17 | 13F | Jones Financial Companies Lllp | 10.724 | 39,35 | 19 | -21,74 | ||||
| 2026-04-07 | 13F | CoreCap Advisors, LLC | 350 | 0,00 | 1 | |||||
| 2026-01-23 | 13F | Bellevue Asset Management, Llc | 0 | -100,00 | 0 | |||||
| 2026-02-13 | 13F | SRS Capital Advisors, Inc. | 100 | -92,92 | 0 | -100,00 | ||||
| 2026-02-06 | 13F | ProShare Advisors LLC | 56.675 | 11,77 | 100 | -31,97 | ||||
| 2026-02-17 | 13F | DZ BANK AG Deutsche Zentral Genossenschafts Bank, Frankfurt am Main | 0 | -100,00 | 0 | |||||
| 2026-01-29 | 13F | Sanctuary Advisors, LLC | 0 | -100,00 | 0 | -100,00 | ||||
| 2026-02-13 | 13F | Marshall Wace, Llp | 1.799.804 | 3.186 | ||||||
| 2026-02-10 | 13F | Intech Investment Management Llc | 52.435 | 15,93 | 93 | -29,77 | ||||
| 2026-02-10 | 13F | Lido Advisors, LLC | 336.856 | 0,00 | 977 | 0,00 | ||||
| 2026-02-11 | 13F | Prestige Wealth Management Group LLC | 200 | 0,00 | 0 | |||||
| 2026-02-17 | 13F | nVerses Capital, LLC | 10.411 | 18 | ||||||
| 2025-11-14 | 13F | Cubist Systematic Strategies, LLC | 59.780 | 173 | ||||||
| 2026-02-17 | 13F | Northern Trust Corp | 954.189 | -9,43 | 1.689 | -44,75 | ||||
| 2026-02-13 | 13F | Divisadero Street Capital Management, LP | 90.531 | 0,00 | 160 | -38,93 | ||||
| 2026-02-13 | 13F | Peak6 Llc | Call | 0 | -100,00 | 0 | ||||
| 2026-02-13 | 13F | Police & Firemen's Retirement System of New Jersey | 36.524 | 0,00 | 65 | -39,05 | ||||
| 2026-02-13 | 13F | Icon Advisers Inc/co | 1.400.000 | -46,15 | 2.478 | -67,14 | ||||
| 2026-02-10 | 13F | JTC Employer Solutions Trusteee Ltd | 1.500 | 0,00 | 0 | |||||
| 2026-02-13 | 13F | Sei Investments Co | 40.130 | 26,09 | 71 | -22,83 | ||||
| 2026-04-17 | 13F | AdvisorNet Financial, Inc | 2 | 0,00 | 0 | |||||
| 2026-02-06 | 13F | Keystone Financial Group | 0 | -100,00 | 0 | |||||
| 2026-01-20 | 13F | Wall Street Access Asset Management, LLC | 0 | -100,00 | 0 | |||||
| 2026-02-12 | 13F | Dimensional Fund Advisors Lp | 1.560.884 | 4,12 | 2.763 | -36,49 | ||||
| 2026-02-23 | 13F | Virtu Financial LLC | 13.263 | 0 | ||||||
| 2026-02-13 | 13F | State Street Corp | 11.359.707 | 15,88 | 20.107 | -29,28 | ||||
| 2026-02-13 | 13F | Walleye Trading LLC | Call | 104.300 | 28,77 | 185 | -21,37 | |||
| 2026-02-13 | 13F | Walleye Trading LLC | 105.146 | 74,93 | 186 | 6,90 | ||||
| 2026-02-17 | 13F | Susquehanna Portfolio Strategies, LLC | 243.892 | 0,00 | 432 | -39,04 | ||||
| 2026-02-09 | 13F | Hartland & Co., LLC | 0 | -100,00 | 0 | |||||
| 2026-02-11 | 13F | Deutsche Bank Ag\ | 98.565 | 5,45 | 174 | -35,79 | ||||
| 2026-02-13 | 13F | Walleye Trading LLC | Put | 316.500 | 63,48 | 560 | -0,18 | |||
| 2026-02-17 | 13F | Parallax Volatility Advisers, L.P. | Put | 60.300 | 84,97 | 107 | 12,77 | |||
| 2026-01-30 | 13F | Us Bancorp \de\ | 600 | 0,00 | 1 | 0,00 | ||||
| 2026-02-06 | 13F | Axxcess Wealth Management, Llc | 22.000 | 0,00 | 39 | -39,68 | ||||
| 2025-11-13 | 13F | Hsbc Holdings Plc | 0 | -100,00 | 0 | |||||
| 2026-03-23 | 13F | J. Derek Lewis & Associates Inc. | 15.000 | 27 | ||||||
| 2026-04-17 | 13F/A | Founders Financial Securities Llc | 17.305 | 0,00 | 33 | 6,67 | ||||
| 2026-02-17 | 13F | Alliancebernstein L.p. | 171.910 | 0,00 | 304 | -38,96 | ||||
| 2026-02-10 | 13F | Bnp Paribas | 2.000 | 0,00 | 4 | -40,00 | ||||
| 2025-11-04 | 13F | Flaharty Asset Management, LLC | 0 | -100,00 | 0 | |||||
| 2026-01-29 | 13F | Dunhill Financial, LLC | 500 | 0,00 | 1 | -100,00 | ||||
| 2026-02-26 | 13F/A | Alpine Global Management, LLC | 98.900 | 175 | ||||||
| 2026-02-13 | 13F | Squarepoint Ops LLC | 0 | -100,00 | 0 | |||||
| 2026-02-09 | 13F | Geode Capital Management, Llc | 3.040.654 | -3,69 | 5.383 | -41,21 | ||||
| 2026-02-17 | 13F | D. E. Shaw & Co., Inc. | 3.318.121 | 4,12 | 5.873 | -36,45 | ||||
| 2026-02-17 | 13F | D. E. Shaw & Co., Inc. | Put | 267.000 | 0,00 | 473 | -39,02 | |||
| 2026-02-14 | 13F | Rockefeller Capital Management L.P. | 7.235 | 20,58 | 13 | -29,41 | ||||
| 2026-02-17 | 13F | Susquehanna Fundamental Investments, Llc | 0 | -100,00 | 0 | -100,00 | ||||
| 2025-11-13 | 13F | Canada Pension Plan Investment Board | 0 | -100,00 | 0 | -100,00 | ||||
| 2026-02-12 | 13F | Jane Street Group, Llc | Call | 28.500 | -19,03 | 50 | -50,98 | |||
| 2026-02-12 | 13F | Jane Street Group, Llc | 1.972.833 | 13,45 | 3.492 | -30,78 | ||||
| 2026-02-12 | 13F | Jane Street Group, Llc | Put | 50.500 | 367,59 | 89 | 187,10 | |||
| 2026-02-13 | 13F | Quarry LP | 0 | -100,00 | 0 | |||||
| 2026-02-13 | 13F | Neuberger Berman Group LLC | 10.249 | -36,65 | 18 | -60,87 | ||||
| 2026-04-08 | 13F | Wealth Enhancement Advisory Services, Llc | 16.384 | 30 | ||||||
| 2026-04-14 | 13F | Nbc Securities, Inc. | 200 | 0,00 | 0 | |||||
| 2026-02-23 | 13F | Leonteq Securities AG | 0 | -100,00 | 0 | -100,00 | ||||
| 2026-02-12 | 13F | Grey Fox Wealth Advisors, LLC | 0 | -100,00 | 0 | |||||
| 2025-11-21 | 13F/A | CIBC Bancorp USA Inc. | 14.051 | 41 | ||||||
| 2026-02-19 | 13F | Invesco Ltd. | 491.753 | 19,71 | 870 | -26,95 | ||||
| 2026-03-09 | 13F/A | CI Private Wealth, LLC | 35.047 | 0,00 | 62 | -38,61 | ||||
| 2026-01-22 | 13F | HHM Wealth Advisors, LLC | 0 | -100,00 | 0 | |||||
| 2026-02-10 | 13F | Acadian Asset Management Llc | 13.586 | 0 | ||||||
| 2026-01-28 | 13F | Universal- Beteiligungs- und Servicegesellschaft mbH | 0 | -100,00 | 0 | |||||
| 2026-02-04 | 13F | Bailard, Inc. | 0 | -100,00 | 0 | |||||
| 2026-02-17 | 13F | Voleon Capital Management Lp | 70.167 | -0,21 | 124 | -38,92 | ||||
| 2026-02-13 | 13F | Morgan Stanley | 1.979.438 | -41,11 | 3.504 | -64,06 | ||||
| 2026-01-29 | 13F | Comerica Bank | 72 | 0,00 | 0 | |||||
| 2026-02-17 | 13F | Point72 Asset Management, L.P. | 51.714 | 92 | ||||||
| 2026-02-03 | 13F | Winch Advisory Services, LLC | 495 | 0,00 | 1 | -100,00 | ||||
| 2026-02-17 | 13F | Susquehanna International Group, Llp | Put | 72.600 | -81,05 | 129 | -88,47 | |||
| 2026-02-17 | 13F | Susquehanna International Group, Llp | Call | 402.100 | -48,12 | 712 | -68,36 | |||
| 2026-02-17 | 13F | Creative Planning | 26.954 | 48 | ||||||
| 2026-02-11 | 13F | Capital World Investors | 5.208.333 | 0,00 | 9.219 | -38,97 | ||||
| 2026-02-11 | 13F | LPL Financial LLC | 731.857 | -0,93 | 1.295 | -39,54 | ||||
| 2026-02-11 | 13F | LPL Financial LLC | Call | 18.000 | 0,00 | 32 | -40,38 | |||
| 2026-02-17 | 13F | Advisor Group Holdings, Inc. | 5.495 | -9,53 | 10 | -40,00 | ||||
| 2025-11-12 | 13F/A | Norges Bank | 0 | -100,00 | 0 | |||||
| 2026-02-17 | 13F | Bank Of America Corp /de/ | 121.946 | -80,67 | 216 | -88,24 | ||||
| 2026-02-17 | 13F | Crawford Fund Management, LLC | Put | 30.500 | 0,00 | 54 | -39,77 | |||
| 2026-04-06 | 13F | Washington Trust Advisors, Inc. | 4.225 | -19,14 | 8 | -22,22 | ||||
| 2026-01-28 | 13F | Geneos Wealth Management Inc. | 430 | 0,00 | 1 | -100,00 | ||||
| 2026-02-13 | 13F | Archon Capital Management LLC | 975.157 | 1.726 | ||||||
| 2026-02-17 | 13F | Cetera Investment Advisers | 179.549 | -15,51 | 318 | -48,54 | ||||
| 2026-02-13 | 13F | Wilkerson Advisory Group LLC | 50 | 0 | ||||||
| 2026-02-17 | 13F | Cetera Investment Advisers | Call | 10.000 | 0,00 | 0 | ||||
| 2026-02-13 | 13F | Wells Fargo & Company/mn | 178.624 | 42,92 | 316 | -12,71 | ||||
| 2026-01-21 | 13F | Westfuller Advisors, LLC | 0 | -100,00 | 0 | |||||
| 2026-02-13 | 13F | MAI Capital Management | 120 | -77,98 | 0 | -100,00 | ||||
| 2026-02-17 | 13F | Two Sigma Securities, Llc | 0 | -100,00 | 0 | |||||
| 2026-02-17 | 13F | CWM Advisors, LLC | 143 | 0 | ||||||
| 2026-04-16 | 13F | SG Americas Securities, LLC | 83.516 | -31,79 | 0 | |||||
| 2026-02-17 | 13F | Royal Bank Of Canada | 10.852 | -91,72 | 19 | -95,01 | ||||
| 2026-04-13 | 13F | CGC Financial Services, LLC | 2.983 | 0,00 | 6 | 0,00 | ||||
| 2026-02-17 | 13F | Susquehanna International Group, Llp | 473.081 | -20,21 | 837 | -51,31 | ||||
| 2026-02-13 | 13F | Hurley Capital, LLC | 2.049 | 0,00 | 4 | -40,00 | ||||
| 2026-02-13 | 13F | National Bank Of Canada /fi/ | 2.235 | 0,00 | 4 | -50,00 | ||||
| 2026-04-08 | 13F | Presidio Capital Management, LLC | 49.900 | 0,00 | 94 | 5,68 | ||||
| 2026-02-17 | 13F | Graham Capital Management, L.P. | 142.948 | 253 | ||||||
| 2026-02-11 | 13F | Sunrise Financial Services, LLC | 6.313 | 11 | ||||||
| 2026-02-05 | 13F | Phoenix Holdings Ltd. | 0 | -100,00 | 0 | |||||
| 2026-02-12 | 13F | Clark Estates Inc/ny | 1.418.614 | 0,00 | 2.511 | -38,97 | ||||
| 2026-01-16 | 13F | Ronald Blue Trust, Inc. | 200 | 0,00 | 0 | |||||
| 2026-01-26 | 13F | Patriot Financial Group Insurance Agency, LLC | 13.000 | 0,00 | 23 | -37,84 | ||||
| 2026-02-05 | 13F | Gabelli Funds Llc | 50.000 | -19,40 | 88 | -50,84 | ||||
| 2026-02-10 | 13F | Bnp Paribas Arbitrage, Sa | 558.178 | 0,15 | 988 | -38,92 | ||||
| 2026-02-05 | 13F | Bank Julius Baer & Co. Ltd, Zurich | 849 | 0,00 | 2 | -50,00 | ||||
| 2026-02-13 | 13F | Squarepoint Ops LLC | Put | 0 | -100,00 | 0 | ||||
| 2026-02-17 | 13F | Scarborough Advisors, LLC | 300 | 0,00 | 1 | |||||
| 2026-02-06 | 13F/A | IFP Advisors, Inc | 0 | -100,00 | 0 | |||||
| 2026-01-15 | 13F | Royal Fund Management, LLC | 0 | -100,00 | 0 | |||||
| 2026-01-14 | 13F | Spire Wealth Management | 300 | 0,00 | 1 |