Grundlæggende statistik
| Institutionelle ejere | 105 total, 102 long only, 0 short only, 3 long/short - change of 12,90% MRQ |
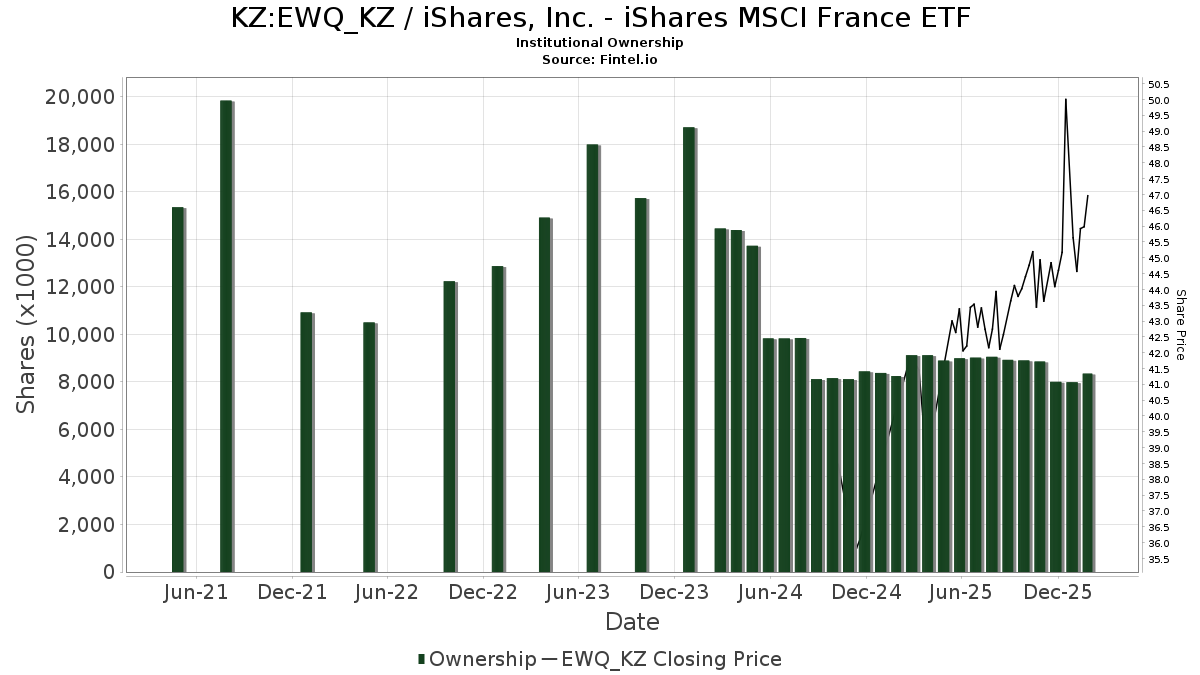
| Del pris | 47,23 |
| Gennemsnitlig porteføljeallokering | 0.2391 % - change of -35,67% MRQ |
| Institutionelle aktier (lange) | 7.686.751 (ex 13D/G) - change of -0,32MM shares -3,94% MRQ |
| Institutionel værdi (lang) | $ 335.017 USD ($1000) |
Institutionelt ejerskab og aktionærer
iShares, Inc. - iShares MSCI France ETF (KZ:EWQ_KZ) har 105 institutionelle ejere og aktionærer, der har indsendt 13D/G- eller 13F-formularer til Securities Exchange Commission (SEC). Disse institutioner har i alt 7,686,751 aktier. Største aktionærer omfatter Morgan Stanley, BlackRock, Inc., Allspring Global Investments Holdings, LLC, Bank Of America Corp /de/, Jane Street Group, Llc, Ameriprise Financial Inc, LPL Financial LLC, Susquehanna International Group, Llp, MBXAX - Catalyst/Millburn Hedge Strategy Fund Class A, and HighTower Advisors, LLC .
iShares, Inc. - iShares MSCI France ETF (KAS:EWQ_KZ) institutionel ejerskabsstruktur viser aktuelle positioner i virksomheden efter institutioner og fonde, samt seneste ændringer i positionsstørrelse. Større aktionærer kan omfatte individuelle investorer, investeringsforeninger, hedgefonde eller institutioner. Skema 13D angiver, at investoren besidder (eller besidder) mere end 5 % af virksomheden og har til hensigt (eller har til hensigt at) aktivt at forfølge en ændring i forretningsstrategi. Skema 13G indikerer en passiv investering på over 5%.
The share price as of February 20, 2026 is 47,23 / share. Previously, on February 24, 2025, the share price was 40,10 / share. This represents an increase of 17,78% over that period.
Fondens stemningsscore
Fund Sentiment Score (fka Ownership Accumulation Score) finder de aktier, der bliver mest købt af fonde. Det er resultatet af en sofistikeret, multi-faktor kvantitativ model, der identificerer virksomheder med de højeste niveauer af institutionel akkumulering. Scoringsmodellen bruger en kombination af den samlede stigning i oplyste ejere, ændringerne i porteføljeallokeringer i disse ejere og andre målinger. Tallet går fra 0 til 100, hvor højere tal indikerer et højere niveau af akkumulering for sine jævnaldrende, og 50 er gennemsnittet.
Opdateringsfrekvens: Dagligt
Se Ownership Explorer, som giver en liste over højest rangerende virksomheder.
AI+ Ask Fintel’s AI assistant about iShares, Inc. - iShares MSCI France ETF.
Select a question to share a public post with an AI-crafted answer.
Thinking of good questions…
13F og NPORT arkivering
Detaljer om 13F-arkivering er gratis. Detaljer om NP-ansøgninger kræver et premium-medlemskab. Grønne rækker angiver nye positioner. Røde rækker angiver lukkede positioner. Klik på linket ikon for at se den fulde transaktionshistorik.
Opgrader
for at låse premium-data op og eksportere til Excel ![]() .
.
| Fil dato | Kilde | Investor | Type | Gennemsnitlig pris (Øst) |
Aktier | Δ Aktier (%) |
Rapporteret Værdi ($1000) |
Δ Værdi (%) |
Port Alloc (%) |
|
|---|---|---|---|---|---|---|---|---|---|---|
| 2026-02-02 | 13F | Peregrine Asset Advisers, Inc. | 28.459 | -1,70 | 1.280 | 0,71 | ||||
| 2026-02-17 | 13F | Wellington Management Group Llp | 5.324 | 240 | ||||||
| 2025-11-13 | 13F | Schroder Investment Management Group | 0 | -100,00 | 0 | |||||
| 2026-02-10 | 13F | Envestnet Asset Management Inc | 14.056 | -2,08 | 632 | 0,32 | ||||
| 2026-02-13 | 13F | Flow Traders U.s. Llc | 38.260 | 2 | ||||||
| 2026-02-17 | 13F | Prostatis Group LLC | 89.180 | 11,43 | 4.012 | 14,14 | ||||
| 2026-02-17 | 13F | Quadrature Capital Ltd | 5.768 | 260 | ||||||
| 2026-02-12 | 13F | Brueske Advisory Services, LLC | 0 | -100,00 | 0 | |||||
| 2026-01-15 | 13F | Nisa Investment Advisors, Llc | 6.620 | 0,00 | 298 | 2,41 | ||||
| 2026-01-16 | 13F | Pictet North America Advisors SA | 115.725 | -11,21 | 5.206 | -9,07 | ||||
| 2026-02-13 | 13F | Citigroup Inc | 113 | -86,75 | 5 | -86,49 | ||||
| 2026-01-30 | 13F | Us Bancorp \de\ | 0 | -100,00 | 0 | |||||
| 2026-02-04 | 13F | Abc Arbitrage Sa | 0 | -100,00 | 0 | |||||
| 2026-02-12 | 13F | Jane Street Group, Llc | 532.857 | 85,99 | 23.973 | 90,47 | ||||
| 2026-02-13 | 13F | Mml Investors Services, Llc | 0 | -100,00 | 0 | |||||
| 2025-10-10 | 13F | Cyndeo Wealth Partners, LLC | 0 | -100,00 | 0 | |||||
| 2026-02-13 | 13F | Kestra Advisory Services, LLC | 2.920 | 131 | ||||||
| 2026-02-13 | 13F | Vontobel Holding Ltd. | 35.413 | -36,00 | 1.593 | -34,44 | ||||
| 2026-02-05 | 13F | Idaho Trust Bank | 48.909 | 19,24 | 2.200 | 22,15 | ||||
| 2026-02-10 | 13F | Lido Advisors, LLC | 177.461 | 2,14 | 7.809 | 2,32 | ||||
| 2026-02-11 | 13F | Dearborn Partners Llc | 4.500 | 202 | ||||||
| 2026-02-12 | 13F | BlackRock, Inc. | 790.723 | 38,69 | 35.575 | 42,03 | ||||
| 2026-02-12 | 13F | Federation des caisses Desjardins du Quebec | 0 | -100,00 | 0 | |||||
| 2026-02-13 | 13F | Sharp Capital Gestora de Recursos Ltda. | 92.643 | 4.168 | ||||||
| 2026-02-10 | 13F | Avestar Capital, LLC | 21.702 | 0,00 | 976 | 2,41 | ||||
| 2026-02-11 | 13F | LPL Financial LLC | 258.737 | -18,74 | 11.641 | -16,78 | ||||
| 2025-08-29 | NP | MBXAX - Catalyst/Millburn Hedge Strategy Fund Class A | 201.263 | -18,61 | 8.614 | -12,47 | ||||
| 2026-02-12 | 13F | Jane Street Group, Llc | Put | 100.900 | 1.405,97 | 4.539 | 1.443,88 | |||
| 2026-02-13 | 13F | Integrated Wealth Concepts LLC | 25.793 | 258,04 | 1.160 | 267,09 | ||||
| 2026-01-15 | 13F | Cobblestone Asset Management LLC | 15.026 | 676 | ||||||
| 2026-02-06 | 13F | HighTower Advisors, LLC | 199.919 | 3,36 | 8.994 | 5,85 | ||||
| 2026-02-17 | 13F | Royal Bank Of Canada | 10.144 | -84,46 | 457 | -84,06 | ||||
| 2026-02-05 | 13F | Northwestern Mutual Wealth Management Co | 33 | -70,80 | 3 | -50,00 | ||||
| 2026-02-11 | 13F | Jpmorgan Chase & Co | 3.172 | 41,80 | 143 | 44,90 | ||||
| 2026-01-26 | 13F | Private Trust Co Na | 93 | 0,00 | 4 | 0,00 | ||||
| 2026-01-30 | 13F | Innealta Capital, Llc | 45.719 | -24,78 | 2.057 | -22,97 | ||||
| 2026-01-26 | 13F | Mirae Asset Global Investments Co., Ltd. | 10.750 | 484 | ||||||
| 2026-01-02 | 13F | Boltwood Capital Management | 9.650 | 3,21 | 434 | 5,85 | ||||
| 2026-02-04 | 13F | swisspartners Advisors Ltd | 5.725 | 0,00 | 257 | 2,39 | ||||
| 2026-02-17 | 13F | Advisory Services Network, LLC | 0 | -100,00 | 0 | |||||
| 2026-01-23 | 13F | Visionary Horizons, LLC | 16.370 | -0,71 | 736 | 1,66 | ||||
| 2026-02-05 | 13F | Allworth Financial LP | 270 | 12 | ||||||
| 2026-01-13 | 13F | CoreCap Advisors, LLC | 500 | 0,00 | 22 | 4,76 | ||||
| 2025-09-26 | NP | SSXU - Day Hagan/Ned Davis Research Smart Sector International ETF | 35.874 | -44,77 | 1.505 | -43,56 | ||||
| 2026-01-29 | 13F | IMC-Chicago, LLC | 17.871 | 804 | ||||||
| 2026-02-02 | 13F | Millburn Ridgefield Corp | 178.952 | 0,00 | 8.051 | 2,42 | ||||
| 2026-02-04 | 13F | BCJ Capital Management, LLC | 16.446 | 740 | ||||||
| 2026-02-17 | 13F | Cetera Investment Advisers | 5.368 | 242 | ||||||
| 2026-01-29 | 13F | UBS Group AG | 46.417 | -4,38 | 2.088 | -2,06 | ||||
| 2025-11-13 | 13F | Hsbc Holdings Plc | 21.735 | 29,31 | 955 | 32,68 | ||||
| 2026-01-28 | 13F | Salomon & Ludwin, LLC | 64 | 0,00 | 3 | 0,00 | ||||
| 2026-02-13 | 13F/A | Planwiser Financial, Llc | 0 | -100,00 | 0 | |||||
| 2025-10-14 | 13F | Monument Capital Management | 0 | -100,00 | 0 | |||||
| 2026-02-11 | 13F | O'shaughnessy Asset Management, Llc | 944 | 23,40 | 42 | 27,27 | ||||
| 2026-02-13 | 13F | Wells Fargo & Company/mn | 27.175 | -10,62 | 1.223 | -8,46 | ||||
| 2026-02-10 | 13F | Peapack Gladstone Financial Corp | 10.869 | 0,00 | 0 | |||||
| 2026-02-13 | 13F | Atlas Capital Advisors Llc | 19 | 1 | ||||||
| 2026-02-02 | 13F | CX Institutional | 1.610 | -10,26 | 0 | |||||
| 2026-02-09 | 13F | Fisher Asset Management, LLC | 8.807 | -1,12 | 396 | 1,28 | ||||
| 2025-11-13 | 13F | Promus Capital, LLC | 2.473 | 2,78 | 109 | 5,88 | ||||
| 2026-02-06 | 13F | BlueStem Wealth Partners, LLC | 0 | -100,00 | 0 | |||||
| 2026-02-17 | 13F | Susquehanna International Group, Llp | 70.275 | 238,50 | 3.162 | 246,60 | ||||
| 2026-02-17 | 13F | Susquehanna International Group, Llp | Put | 6.400 | 288 | |||||
| 2026-02-17 | 13F | Citadel Advisors Llc | 23.865 | -54,52 | 1.074 | -53,45 | ||||
| 2026-02-17 | 13F | Citadel Advisors Llc | Call | 23.900 | 1.075 | |||||
| 2026-01-23 | 13F | Assetmark, Inc | 12 | 0,00 | 1 | |||||
| 2026-02-17 | 13F | Citadel Advisors Llc | Put | 37.100 | 1.669 | |||||
| 2025-08-28 | NP | ICCIX - Dynamic International Opportunity Fund Class I | 84.548 | 5,54 | 3.619 | 13,49 | ||||
| 2026-02-17 | 13F | D. E. Shaw & Co., Inc. | 7.388 | 332 | ||||||
| 2026-02-02 | 13F | CENTRAL TRUST Co | 1.802 | 10,21 | 81 | 14,08 | ||||
| 2026-02-17 | 13F | Bank Of America Corp /de/ | 683.981 | -12,72 | 30.772 | -10,61 | ||||
| 2025-11-14 | 13F | National Bank Of Canada /fi/ | 0 | -100,00 | 0 | |||||
| 2026-01-29 | 13F | Comerica Bank | 1.907 | -1,60 | 86 | 0,00 | ||||
| 2025-09-24 | NP | BlackRock ETF Trust - iShares International Country Rotation Active ETF | 11.097 | 4,26 | 465 | 6,65 | ||||
| 2026-02-17 | 13F | Susquehanna International Group, Llp | Call | 221.800 | 9.979 | |||||
| 2026-02-12 | 13F | Hrt Financial Lp | 7.706 | 0 | ||||||
| 2025-11-14 | 13F | Horizon Investments, LLC | 0 | -100,00 | 0 | |||||
| 2026-02-13 | 13F | Avos Capital Management, LLC | 5.908 | 0,00 | 266 | 2,32 | ||||
| 2026-02-05 | 13F | Thrivent Financial For Lutherans | 0 | -100,00 | 0 | |||||
| 2026-02-13 | 13F | Gts Securities Llc | 56.700 | 2.551 | ||||||
| 2026-02-17 | 13F | Zacks Investment Management | 60.297 | 4,89 | 2.713 | 7,41 | ||||
| 2026-02-10 | 13F | Goldman Sachs Group Inc | 31.346 | 1.410 | ||||||
| 2025-08-28 | NP | SYMIX - AlphaCentric Symmetry Strategy Fund Class I | 2.691 | -9,88 | 115 | -2,54 | ||||
| 2026-01-21 | 13F | Prime Capital Investment Advisors, LLC | 4.937 | 0,51 | 222 | 3,26 | ||||
| 2026-02-05 | 13F | Cambridge Investment Research Advisors, Inc. | 97.885 | -14,52 | 4 | -20,00 | ||||
| 2026-02-17 | 13F | Blair William & Co/il | 101 | 0,00 | 5 | 0,00 | ||||
| 2025-11-12 | 13F | Cresset Asset Management, LLC | 0 | -100,00 | 0 | |||||
| 2026-02-06 | 13F | IFP Advisors, Inc | 430 | 68,63 | 19 | 72,73 | ||||
| 2026-02-12 | 13F | Steward Partners Investment Advisory, Llc | 473 | 0,00 | 21 | 5,00 | ||||
| 2026-02-17 | 13F | Equitable Holdings, Inc. | 34.183 | -26,15 | 1.538 | -24,40 | ||||
| 2026-02-17 | 13F | Fmr Llc | 677 | 5,95 | 30 | 7,14 | ||||
| 2026-01-27 | 13F | TD Waterhouse Canada Inc. | 1.506 | -2,78 | 68 | -1,47 | ||||
| 2025-11-14 | 13F | Raymond James Financial Inc | 0 | -100,00 | 0 | |||||
| 2026-02-17 | 13F | Qube Research & Technologies Ltd | 32.806 | 1.476 | ||||||
| 2026-02-05 | 13F | Mount Lucas Management LP | 19.152 | -0,23 | 862 | 2,14 | ||||
| 2026-02-13 | 13F | Marshall Wace, Llp | 0 | -100,00 | 0 | |||||
| 2026-01-15 | 13F | Allspring Global Investments Holdings, LLC | 769.801 | -0,06 | 34.633 | 2,35 | ||||
| 2026-02-10 | 13F | Bnp Paribas Arbitrage, Sa | 48 | -94,94 | 2 | -95,12 | ||||
| 2026-02-12 | 13F | Sun Life Financial Inc | 58.910 | 0,00 | 3 | 0,00 | ||||
| 2026-01-22 | 13F | Glass Jacobson Investment Advisors llc | 100 | 0,00 | 4 | 0,00 | ||||
| 2026-02-10 | 13F | Catalyst Capital Advisors LLC | 178.952 | 0,00 | 8.051 | 2,42 | ||||
| 2026-02-19 | 13F | Invesco Ltd. | 5.804 | 261 | ||||||
| 2026-02-18 | 13F | Onyx Bridge Wealth Group LLC | 0 | -100,00 | 0 | |||||
| 2026-02-12 | 13F | AlphaCentric Advisors LLC | 2.934 | 132 | ||||||
| 2026-02-13 | 13F | Motiv8 Investments LLC | 42 | 0 | ||||||
| 2026-02-06 | 13F | Global Retirement Partners, LLC | 4.292 | -1,94 | 193 | 0,52 | ||||
| 2026-02-11 | 13F | Strategic Financial Partners, Ltd. | 0 | -100,00 | 0 | |||||
| 2025-11-14 | 13F | Old Mission Capital Llc | 0 | -100,00 | 0 | |||||
| 2026-01-14 | 13F | USA Financial Portformulas Corp | 3.364 | 151 | ||||||
| 2026-02-14 | 13F | Rockefeller Capital Management L.P. | 391 | 0,26 | 18 | 0,00 | ||||
| 2026-02-17 | 13F | Two Sigma Securities, Llc | 4.843 | -32,47 | 218 | -31,11 | ||||
| 2025-08-26 | NP | EQ ADVISORS TRUST - EQ/International Core Managed Volatility Portfolio Class IB | 46.167 | 0,00 | 1.976 | 7,51 | ||||
| 2026-02-10 | 13F | Rice Partnership, LLC | 20.035 | -85,39 | 901 | -85,04 | ||||
| 2026-02-17 | 13F | Ameriprise Financial Inc | 412.791 | -56,93 | 18.569 | -55,89 | ||||
| 2025-11-14 | 13F | New Vernon Capital Holdings II LLC | 0 | -100,00 | 0 | |||||
| 2026-02-06 | 13F | Pnc Financial Services Group, Inc. | 440 | 0,00 | 20 | 0,00 | ||||
| 2026-02-12 | 13F | Tiemann Investment Advisors, Llc | 9.130 | 0,00 | 411 | 2,24 | ||||
| 2026-02-17 | 13F | Advisor Group Holdings, Inc. | 10.087 | -52,12 | 454 | -50,27 | ||||
| 2026-02-17 | 13F | Warren Averett Asset Management, LLC | 30 | -92,70 | 1 | -91,67 | ||||
| 2026-02-13 | 13F | Morgan Stanley | 1.675.565 | 17,05 | 75.384 | 19,87 | ||||
| 2026-02-06 | 13F | Covestor Ltd | 19 | -53,66 | 0 | |||||
| 2026-02-20 | 13F | Kovitz Investment Group Partners, LLC | 14.804 | 8,45 | 666 | 11,19 | ||||
| 2026-02-09 | 13F | Keating Financial Advisory Services, Inc. | 22 | 1 | ||||||
| 2026-01-26 | 13F | Cwm, Llc | 225 | 84,43 | 0 | |||||
| 2026-02-05 | 13F | Bank Julius Baer & Co. Ltd, Zurich | 22.043 | 0,00 | 992 | 2,38 | ||||
| 2026-01-16 | 13F | Bangor Savings Bank | 77 | 3 | ||||||
| 2026-02-17 | 13F | Tower Research Capital LLC (TRC) | 185 | -33,93 | 8 | -33,33 | ||||
| 2026-02-12 | 13F | Bank Of Montreal /can/ | 185 | -51,95 | 8 | -50,00 | ||||
| 2026-02-17 | 13F | Jones Financial Companies Lllp | 96 | -82,58 | 4 | -83,33 | ||||
| 2026-02-12 | 13F | Principal Securities, Inc. | 0 | -100,00 | 0 | |||||
| 2026-02-13 | 13F | SRS Capital Advisors, Inc. | 14.919 | 671 | ||||||
| 2026-02-17 | 13F | Russell Investments Group, Ltd. | 356 | 0,56 | 16 | 6,67 |
Other Listings
| US:EWQ | 47,68 $ |