Grundlæggende statistik
| Institutionelle aktier (lange) | 214.014.598 - 66,33% (ex 13D/G) - change of -8,08MM shares -3,62% MRQ |
| Institutionel værdi (lang) | $ 3.974.175 USD ($1000) |
Institutionelt ejerskab og aktionærer
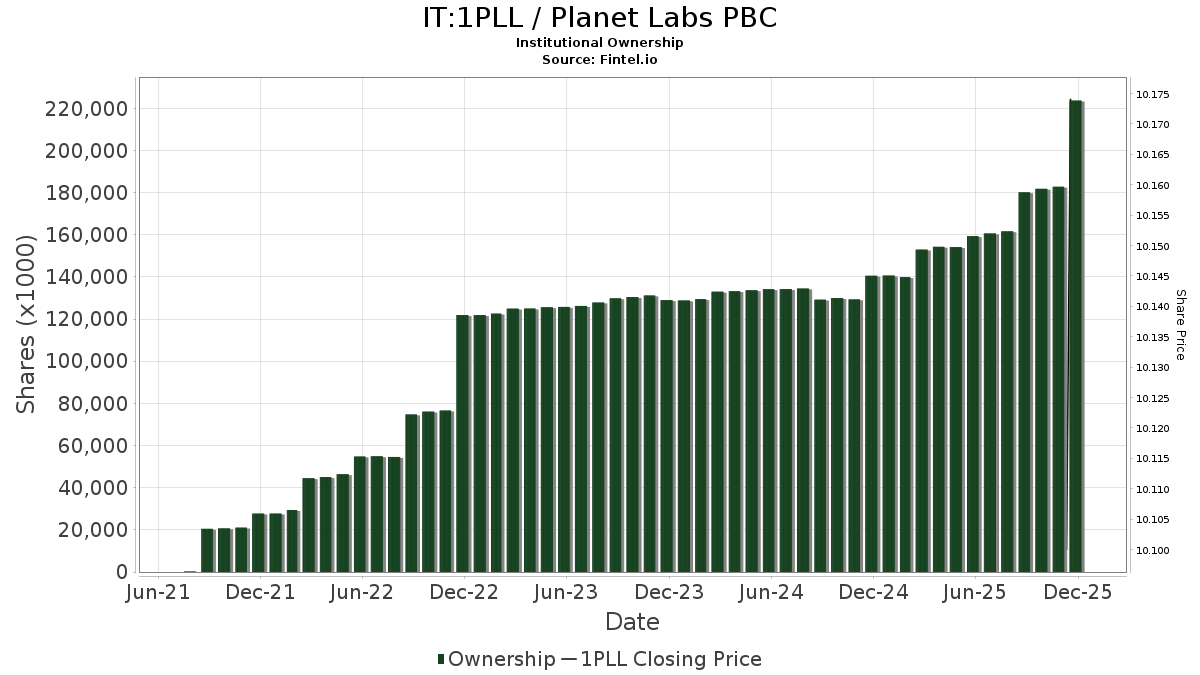
Planet Labs PBC (IT:1PLL) har 360 institutionelle ejere og aktionærer, der har indsendt 13D/G- eller 13F-formularer til Securities Exchange Commission (SEC). Disse institutioner har i alt 214,014,598 aktier. Største aktionærer omfatter Alphabet Inc., BlackRock, Inc., Vanguard Group Inc, D. E. Shaw & Co., Inc., Driehaus Capital Management Llc, Canada Pension Plan Investment Board, Van Eck Associates Corp, Capricorn Investment Group LLC, State Street Corp, and Geode Capital Management, Llc .
Planet Labs PBC (BIT:1PLL) institutionel ejerskabsstruktur viser aktuelle positioner i virksomheden efter institutioner og fonde, samt seneste ændringer i positionsstørrelse. Større aktionærer kan omfatte individuelle investorer, investeringsforeninger, hedgefonde eller institutioner. Skema 13D angiver, at investoren besidder (eller besidder) mere end 5 % af virksomheden og har til hensigt (eller har til hensigt at) aktivt at forfølge en ændring i forretningsstrategi. Skema 13G indikerer en passiv investering på over 5%.
The share price as of March 26, 2026 is 28,50 / share. Previously, on November 24, 2025, the share price was 10,04 / share. This represents an increase of 183,75% over that period.
Fondens stemningsscore
Fund Sentiment Score (fka Ownership Accumulation Score) finder de aktier, der bliver mest købt af fonde. Det er resultatet af en sofistikeret, multi-faktor kvantitativ model, der identificerer virksomheder med de højeste niveauer af institutionel akkumulering. Scoringsmodellen bruger en kombination af den samlede stigning i oplyste ejere, ændringerne i porteføljeallokeringer i disse ejere og andre målinger. Tallet går fra 0 til 100, hvor højere tal indikerer et højere niveau af akkumulering for sine jævnaldrende, og 50 er gennemsnittet.
Opdateringsfrekvens: Dagligt
Se Ownership Explorer, som giver en liste over højest rangerende virksomheder.
AI+ Ask Fintel’s AI assistant about Planet Labs PBC.
Select a question to share a public post with an AI-crafted answer.
Thinking of good questions…
13F og NPORT arkivering
Detaljer om 13F-arkivering er gratis. Detaljer om NP-ansøgninger kræver et premium-medlemskab. Grønne rækker angiver nye positioner. Røde rækker angiver lukkede positioner. Klik på linket ikon for at se den fulde transaktionshistorik.
Opgrader
for at låse premium-data op og eksportere til Excel ![]() .
.
| Fil dato | Kilde | Investor | Type | Gennemsnitlig pris (Øst) |
Aktier | Δ Aktier (%) |
Rapporteret Værdi ($1000) |
Δ Værdi (%) |
Port Alloc (%) |
|
|---|---|---|---|---|---|---|---|---|---|---|
| 2026-02-17 | 13F | Advisory Services Network, LLC | 48.646 | 1.034,47 | 959 | 1.643,64 | ||||
| 2026-02-17 | 13F | Cresset Asset Management, LLC | 130.316 | -28,26 | 2.570 | 8,99 | ||||
| 2026-02-13 | 13F | Next Century Growth Investors Llc | 1.065.166 | -40,08 | 21.005 | -8,96 | ||||
| 2025-10-27 | 13F | Belvedere Trading LLC | 0 | -100,00 | 0 | -100,00 | ||||
| 2026-02-13 | 13F | Victory Capital Management Inc | 202.528 | 683,32 | 3.994 | 1.091,94 | ||||
| 2026-01-16 | 13F | Genesis Financial Group, LLC | 22.500 | 444 | ||||||
| 2026-02-09 | 13F | SLT Holdings LLC | 10.550 | 208 | ||||||
| 2026-02-13 | 13F | Nicholas Investment Partners, LP | 420.841 | 5,44 | 8.299 | 60,19 | ||||
| 2026-01-28 | 13F | Chicago Partners Investment Group LLC | 9.691 | 261 | ||||||
| 2026-02-13 | 13F | Golden State Wealth Management, LLC | 250 | 5 | ||||||
| 2026-02-10 | 13F | Impact Partnership Wealth, LLC | 14.053 | 32,48 | 277 | 102,19 | ||||
| 2026-02-11 | 13F | Group One Trading, L.p. | 306.949 | 6.053 | ||||||
| 2026-02-13 | 13F | Centiva Capital, LP | 13.000 | 256 | ||||||
| 2026-02-13 | 13F | Sei Investments Co | 120.528 | 211,43 | 2.377 | 373,31 | ||||
| 2026-01-09 | 13F | Diversified Trust Co | 0 | -100,00 | 0 | -100,00 | ||||
| 2026-02-17 | 13F | Cetera Investment Advisers | 12.502 | -14,78 | 247 | 29,47 | ||||
| 2026-02-09 | 13F | Quest Partners LLC | 21.643 | -0,77 | 427 | 50,53 | ||||
| 2026-03-16 | 13F | Osbon Capital Management Llc | 28.118 | 554 | ||||||
| 2026-02-11 | 13F | Twin Tree Management, LP | 9.315 | 184 | ||||||
| 2026-02-13 | 13F | FORA Capital, LLC | 80.784 | 1.795 | ||||||
| 2026-02-06 | 13F | Addison Advisors LLC | 200 | 4 | ||||||
| 2026-02-13 | 13F | Panagora Asset Management Inc | 237.091 | -22,36 | 4.675 | 17,97 | ||||
| 2026-02-17 | 13F | Optiver Holding B.V. | 0 | -100,00 | 0 | |||||
| 2026-02-17 | 13F | Two Sigma Investments, Lp | 4.496.720 | 90,36 | 88.675 | 189,20 | ||||
| 2025-11-10 | 13F | Bck Capital Management Lp | 0 | -100,00 | 0 | -100,00 | ||||
| 2025-11-14 | 13F | Voloridge Investment Management, Llc | 0 | -100,00 | 0 | -100,00 | ||||
| 2026-02-11 | 13F | Los Angeles Capital Management Llc | 69.356 | 49,34 | 892 | 48,01 | ||||
| 2026-02-13 | 13F | Rhumbline Advisers | 283.990 | -9,63 | 5.600 | 37,32 | ||||
| 2026-02-10 | 13F | JTC Employer Solutions Trusteee Ltd | 8.440 | 0 | ||||||
| 2026-01-21 | 13F | SJS Investment Consulting Inc. | 16 | 0 | ||||||
| 2026-02-11 | 13F | Ameritas Investment Partners, Inc. | 19.515 | 0,00 | 385 | 51,78 | ||||
| 2026-02-17 | 13F | Qube Research & Technologies Ltd | 1.410.008 | -14,76 | 27.805 | 29,51 | ||||
| 2026-02-13 | 13F | Y-Intercept (Hong Kong) Ltd | 189.786 | 90,24 | 3.743 | 189,18 | ||||
| 2026-02-12 | 13F | Voya Investment Management Llc | 1.550.741 | 3.673,09 | 30.581 | 5.637,34 | ||||
| 2026-02-10 | 13F | Acadian Asset Management Llc | 39.074 | 42,77 | 1 | |||||
| 2026-02-17 | 13F | Massar Capital Management, LP | 32.216 | 635 | ||||||
| 2026-02-17 | 13F | Dark Forest Capital Management Lp | 39.929 | -85,52 | 787 | -78,00 | ||||
| 2026-02-10 | 13F | Foundations Investment Advisors, LLC | 11.853 | 234 | ||||||
| 2026-02-13 | 13F | Walleye Capital LLC | 236.180 | 4.657 | ||||||
| 2026-02-12 | 13F | Xponance, Inc. | 18.656 | 3,07 | 368 | 56,84 | ||||
| 2026-02-13 | 13F | 1832 Asset Management L.P. | 211.000 | 4.161 | ||||||
| 2026-02-14 | 13F | American Trust | 0 | -100,00 | 0 | |||||
| 2025-11-14 | 13F | Oxford Asset Management Llp | 17.832 | 56,31 | 231 | 234,78 | ||||
| 2026-02-04 | 13F | Valeo Financial Advisors, LLC | Call | 200 | 4 | |||||
| 2026-02-04 | 13F | Valeo Financial Advisors, LLC | 19.694 | -9,00 | 388 | 38,57 | ||||
| 2026-02-10 | 13F | Goldman Sachs Group Inc | 4.137.871 | 7,87 | 81.599 | 63,88 | ||||
| 2026-02-06 | 13F | HighTower Advisors, LLC | 10.700 | -3,17 | 211 | 47,55 | ||||
| 2025-11-14 | 13F | Point72 Europe (London) LLP | 7.809 | 101 | ||||||
| 2025-11-21 | 13F/A | CIBC Bancorp USA Inc. | 24.900 | 323 | ||||||
| 2026-01-15 | 13F | Zevenbergen Capital Investments Llc | 22.500 | -48,86 | 444 | -22,42 | ||||
| 2026-02-17 | 13F | Guardian Partners Inc. | 80.000 | 1.742 | ||||||
| 2026-02-13 | 13F | Peak6 Llc | Call | 1.220.100 | -54,54 | 24.060 | -30,93 | |||
| 2026-02-13 | 13F | Peak6 Llc | Put | 432.100 | 430,84 | 8.521 | 706,91 | |||
| 2026-02-11 | 13F | Janney Montgomery Scott LLC | 10.000 | 0 | ||||||
| 2026-02-13 | 13F | Colony Group, LLC | 26.013 | 4,05 | 344 | 6,17 | ||||
| 2026-02-05 | 13F | Abacus Wealth Partners, LLC | 23.907 | 471 | ||||||
| 2026-02-13 | 13F | Citigroup Inc | 10.018 | -74,06 | 198 | -60,68 | ||||
| 2026-01-15 | 13F | MOR Wealth Management, LLC | 16.898 | 333 | ||||||
| 2026-02-17 | 13F | Capital Fund Management S.a. | Put | 15.200 | 300 | |||||
| 2026-02-13 | 13F | Arete Wealth Advisors, LLC | 120.213 | -17,53 | 2 | 100,00 | ||||
| 2026-02-13 | 13F | Integrated Wealth Concepts LLC | 65.103 | -1,82 | 1.284 | 49,19 | ||||
| 2026-01-29 | 13F | Quent Capital, LLC | 80.600 | 1.589 | ||||||
| 2026-02-05 | 13F | May Hill Capital, LLC | 11.350 | 224 | ||||||
| 2026-02-12 | 13F | BlackRock, Inc. | 20.231.246 | 7,01 | 398.960 | 62,57 | ||||
| 2026-02-12 | 13F | Skopos Labs, Inc. | 25.360 | -7,85 | 504 | 201,20 | ||||
| 2026-01-30 | 13F | North Star Investment Management Corp. | 2.180 | 1.111,11 | 43 | 2.000,00 | ||||
| 2026-01-29 | 13F | Pictet Asset Management Holding SA | 33.090 | 2,13 | 653 | 55,24 | ||||
| 2026-02-13 | 13F | BNP Paribas Asset Management Holding S.A. | 3.535 | 62,83 | 0 | |||||
| 2026-02-09 | 13F | Hartland & Co., LLC | 0 | -100,00 | 0 | |||||
| 2026-02-11 | 13F | Ramirez Asset Management, Inc. | 1.000 | 20 | ||||||
| 2026-02-09 | 13F | Revere Asset Management, Inc | 38.952 | 768 | ||||||
| 2026-02-13 | 13F | Mariner, LLC | 186.672 | 89,12 | 3.681 | 187,35 | ||||
| 2026-03-04 | 13F | SHP Wealth Management | 675 | 13 | ||||||
| 2025-11-14 | 13F | Comprehensive Financial Management LLC | 0 | -100,00 | 0 | -100,00 | ||||
| 2026-02-17 | 13F | Bank Of America Corp /de/ | 1.293.545 | 94,79 | 25.509 | 195,95 | ||||
| 2026-01-27 | 13F | Forum Financial Management, LP | 13.047 | 0,00 | 257 | 52,07 | ||||
| 2026-02-13 | 13F | Manufacturers Life Insurance Company, The | 0 | -100,00 | 0 | |||||
| 2026-02-12 | 13F | CIBC Private Wealth Group, LLC | 4 | 0 | ||||||
| 2026-02-17 | 13F | Algert Global Llc | 950.331 | 22,05 | 19 | 80,00 | ||||
| 2025-10-30 | 13F | Twin Peaks Wealth Advisors, LLC | 0 | -100,00 | 0 | |||||
| 2026-01-27 | 13F | Aspiring Ventures, LLC | 195.555 | 6,04 | 3.856 | 61,14 | ||||
| 2026-02-17 | 13F | Jain Global LLC | 985.641 | 19.437 | ||||||
| 2025-11-12 | 13F | Willow Creek Wealth Management Inc. | 0 | -100,00 | 0 | -100,00 | ||||
| 2026-02-17 | 13F | Aster Capital Management (DIFC) Ltd | 8.131 | -78,18 | 160 | -66,87 | ||||
| 2026-02-05 | 13F | Td Private Client Wealth Llc | 0 | -100,00 | 0 | |||||
| 2026-02-12 | 13F | Steward Partners Investment Advisory, Llc | 3 | 0 | ||||||
| 2026-01-23 | 13F | Ami Asset Management Corp | 34.131 | 673 | ||||||
| 2026-02-13 | 13F | Lord, Abbett & Co. Llc | Call | 0 | 1 | |||||
| 2026-02-17 | 13F | Kemnay Advisory Services Inc. | 371 | 7 | ||||||
| 2026-02-11 | 13F | LPL Financial LLC | 230.212 | 22,17 | 4.540 | 85,64 | ||||
| 2026-02-13 | 13F | Neuberger Berman Group LLC | 1.093.108 | 118,13 | 21.556 | 231,43 | ||||
| 2026-02-17 | 13F | Aquatic Capital Management LLC | 200.094 | -69,82 | 3.946 | -54,16 | ||||
| 2026-02-11 | 13F | LPL Financial LLC | Put | 10.000 | 197 | |||||
| 2026-02-13 | 13F | Van Eck Associates Corp | 7.678.938 | 320,26 | 151 | 556,52 | ||||
| 2026-02-13 | 13F | Vontobel Holding Ltd. | 29.466 | -1,41 | 581 | 50,13 | ||||
| 2026-02-06 | 13F | Pnc Financial Services Group, Inc. | 31.578 | 4,23 | 623 | 58,27 | ||||
| 2026-02-11 | 13F | Cerity Partners LLC | 53.183 | 218,18 | 1.049 | 385,19 | ||||
| 2026-02-10 | 13F | Bnp Paribas Arbitrage, Sa | 966.280 | 2.046,91 | 19.055 | 3.162,84 | ||||
| 2025-11-14 | 13F | Wolverine Trading, Llc | Call | 350.000 | 44,45 | 4.476 | 204,49 | |||
| 2025-11-14 | 13F | Wolverine Trading, Llc | Put | 133.900 | 68,43 | 1.713 | 255,19 | |||
| 2026-02-17 | 13F | Portolan Capital Management, LLC | 68.715 | -89,11 | 1.355 | -83,45 | ||||
| 2026-02-12 | 13F | Renaissance Technologies Llc | 747.880 | 59,80 | 14.748 | 142,81 | ||||
| 2026-02-17 | 13F | Tower Research Capital LLC (TRC) | 9.230 | -34,14 | 182 | 0,55 | ||||
| 2026-02-17 | 13F | Elequin Capital Lp | 903 | 18 | ||||||
| 2026-02-24 | 13F | Bell Investment Advisors, Inc | 106 | 2 | ||||||
| 2026-02-12 | 13F | Hm Payson & Co | 200 | 4 | ||||||
| 2026-02-17 | 13F | Advisor Group Holdings, Inc. | 29.472 | 75,20 | 581 | 297,95 | ||||
| 2025-11-14 | 13F | Wolverine Trading, Llc | 72.319 | 495,51 | 925 | 1.165,75 | ||||
| 2026-02-17 | 13F | Sandler Capital Management | 59.690 | -48,74 | 1.177 | -22,10 | ||||
| 2026-02-13 | 13F | Wexford Capital Lp | 0 | -100,00 | 0 | |||||
| 2026-02-17 | 13F | Tudor Investment Corp Et Al | Put | 516.300 | 10.181 | |||||
| 2026-02-17 | 13F | Lazard Asset Management Llc | 0 | -100,00 | 0 | |||||
| 2026-02-17 | 13F | Lazard Asset Management Llc | Put | 0 | -100,00 | 0 | ||||
| 2026-02-17 | 13F | Tudor Investment Corp Et Al | 1.436.089 | 28.320 | ||||||
| 2026-02-17 | 13F | Gotham Asset Management, LLC | 106.421 | -46,40 | 2.099 | -18,59 | ||||
| 2026-02-17 | 13F | DZ BANK AG Deutsche Zentral Genossenschafts Bank, Frankfurt am Main | 10.000 | 197 | ||||||
| 2026-02-04 | 13F | Swiss Life Asset Management Ltd | 12.407 | 20,50 | 245 | 83,46 | ||||
| 2026-02-17 | 13F | Tudor Investment Corp Et Al | Call | 40.300 | 795 | |||||
| 2026-02-13 | 13F | Verition Fund Management LLC | 220.119 | -27,09 | 4.341 | 10,77 | ||||
| 2026-02-10 | 13F | Godfrey Financial Associates, Inc. | 16 | 0 | ||||||
| 2026-02-10 | 13F | Jupiter Asset Management Ltd | 178.373 | 3.518 | ||||||
| 2026-02-09 | 13F | Geode Capital Management, Llc | 5.702.642 | 1,27 | 112.475 | 53,85 | ||||
| 2026-02-13 | 13F | Ariadne Wealth Management, LP | 10.637 | -5,04 | 227 | 77,95 | ||||
| 2026-02-02 | 13F | Pittenger & Anderson Inc | 965 | 19 | ||||||
| 2026-02-17 | 13F | Capricorn Investment Group LLC | 7.141.130 | 0,00 | 140.823 | 51,93 | ||||
| 2026-02-13 | 13F | Greenline Wealth Management LLC | 156 | 3 | ||||||
| 2026-02-17 | 13F | Cambria Investment Management, L.P. | 36.857 | -74,18 | 727 | -60,80 | ||||
| 2026-02-13 | 13F | Divisadero Street Capital Management, LP | 0 | -100,00 | 0 | |||||
| 2026-01-20 | 13F | Signaturefd, Llc | 1.247 | -34,16 | 25 | 0,00 | ||||
| 2026-01-12 | 13F | CVA Family Office, LLC | 40 | 1 | ||||||
| 2026-02-10 | 13F | Connor, Clark & Lunn Investment Management Ltd. | 3.103.260 | -16,26 | 61.196 | 27,22 | ||||
| 2025-11-14 | 13F | Caption Management, LLC | 0 | -100,00 | 0 | -100,00 | ||||
| 2025-11-13 | 13F | EntryPoint Capital, LLC | 0 | -100,00 | 0 | -100,00 | ||||
| 2026-01-08 | 13F | Wealth Enhancement Advisory Services, Llc | 33.126 | 5,96 | 723 | 47,55 | ||||
| 2026-02-12 | 13F | Swiss National Bank | 480.700 | 17,10 | 9.479 | 77,91 | ||||
| 2026-02-13 | 13F | Prudential Financial Inc | 14.605 | -49,91 | 288 | -23,81 | ||||
| 2026-02-17 | 13F | Bank Of America Corp /de/ | Put | 0 | -100,00 | 0 | -100,00 | |||
| 2026-02-06 | 13F | Global Retirement Partners, LLC | Call | 1.000 | 1 | |||||
| 2026-02-12 | 13F | Federation des caisses Desjardins du Quebec | 8.704 | -23,68 | 172 | 15,54 | ||||
| 2026-02-13 | 13F | Towarzystwo Funduszy Inwestycyjnych Pzu Sa | 0 | -100,00 | 0 | |||||
| 2026-02-17 | 13F | Cardiff Park Advisors, Llc | 18.600 | 0,00 | 367 | 51,87 | ||||
| 2026-02-06 | 13F | Bare Financial Services, Inc | 81 | 2 | ||||||
| 2025-11-13 | 13F/A | Peak6 Llc | 0 | -100,00 | 0 | -100,00 | ||||
| 2026-02-13 | 13F | Police & Firemen's Retirement System of New Jersey | 65.005 | 0,64 | 1.282 | 52,86 | ||||
| 2026-02-17 | 13F | Ghisallo Capital Management LLC | 40.000 | 0,00 | 789 | 51,83 | ||||
| 2026-02-09 | 13F | Wellington Shields Capital Management, LLC | 1.200 | 0,00 | 24 | 53,33 | ||||
| 2026-01-26 | 13F | Cwm, Llc | 15.379 | 65,79 | 0 | |||||
| 2026-02-17 | 13F | Abel Hall, LLC | 11.279 | 222 | ||||||
| 2026-01-27 | 13F | Gf Fund Management Co. Ltd. | 6.213 | 123 | ||||||
| 2026-02-17 | 13F | Numerai GP LLC | 34.716 | 685 | ||||||
| 2026-02-05 | 13F | Unconventional Investor, LLC | 50.000 | 0,00 | 986 | 51,93 | ||||
| 2026-02-17 | 13F | Ameriprise Financial Inc | 72.746 | 1,21 | 1.435 | 53,86 | ||||
| 2026-02-10 | 13F | Bank of New York Mellon Corp | 666.112 | 3,61 | 13.136 | 57,40 | ||||
| 2026-02-11 | 13F | Nemes Rush Group LLC | 836 | 16 | ||||||
| 2025-09-29 | NP | SUNAMERICA SERIES TRUST - SA Small Cap Index Portfolio Class 1 | 24.746 | -1,09 | 155 | 87,80 | ||||
| 2026-01-29 | 13F | UBS Group AG | 781.108 | -49,84 | 15.403 | -23,80 | ||||
| 2025-11-12 | 13F | Rsm Us Wealth Management Llc | 0 | -100,00 | 0 | -100,00 | ||||
| 2026-02-06 | 13F | Covestor Ltd | 26 | -3,70 | 0 | |||||
| 2026-02-17 | 13F | Schonfeld Strategic Advisors LLC | 155.263 | 126,94 | 3.062 | 244,71 | ||||
| 2026-02-13 | 13F | SRS Capital Advisors, Inc. | 15 | -94,49 | 0 | -100,00 | ||||
| 2026-02-13 | 13F | Bank Of Nova Scotia | 844.687 | 210,77 | 16.657 | 372,14 | ||||
| 2026-02-13 | 13F | Bank Of Nova Scotia | Put | 1.000 | 20 | |||||
| 2026-01-05 | 13F | GoalVest Advisory LLC | 5.989 | 0,00 | 118 | 53,25 | ||||
| 2026-02-13 | 13F | Baird Financial Group, Inc. | 846.168 | -11,23 | 16.686 | 34,86 | ||||
| 2026-02-03 | 13F | International Assets Investment Management, Llc | 20 | 0 | ||||||
| 2026-02-17 | 13F | Voleon Capital Management Lp | 417.049 | 1.200,92 | 8.224 | 1.876,92 | ||||
| 2026-02-17 | 13F | Capital Fund Management S.a. | 823.520 | 404,56 | 16.240 | 666,71 | ||||
| 2025-10-07 | 13F | Northside Capital Management, LLC | 0 | -100,00 | 0 | -100,00 | ||||
| 2026-02-12 | 13F | New York State Common Retirement Fund | 192.483 | -4,89 | 3.796 | 44,52 | ||||
| 2026-02-17 | 13F | Frontier Capital Management Co Llc | 277.871 | -78,69 | 5.480 | -67,63 | ||||
| 2026-02-18 | 13F | GWM Advisors LLC | 525 | 10 | ||||||
| 2025-11-06 | 13F | Abich Financial Wealth Management LLC | 8.680 | 113 | ||||||
| 2026-02-06 | 13F | Legato Capital Management LLC | 111.347 | 115,22 | 2.196 | 227,12 | ||||
| 2026-02-19 | 13F | Invesco Ltd. | 3.453.226 | 0,08 | 68.098 | 52,05 | ||||
| 2026-02-17 | 13F | Cypress Point Investment Management Lp | 903.988 | 17.824 | ||||||
| 2026-02-04 | 13F | Knuff & Co LLC | 5.000 | 99 | ||||||
| 2026-02-13 | 13F | Sterling Capital Management LLC | 1.566 | 176,68 | 31 | 328,57 | ||||
| 2026-02-17 | 13F | Citadel Advisors Llc | Put | 969.000 | 105,12 | 19.109 | 211,66 | |||
| 2026-02-17 | 13F | Citadel Advisors Llc | Call | 1.498.900 | 59,00 | 29.558 | 141,57 | |||
| 2026-01-27 | 13F | Zurcher Kantonalbank (Zurich Cantonalbank) | 91.120 | -16,80 | 1.797 | 26,39 | ||||
| 2026-01-21 | 13F | Heritage Oak Wealth Advisors Llc | 0 | -100,00 | 0 | |||||
| 2026-02-13 | 13F | MAI Capital Management | 4.764 | 94 | ||||||
| 2026-02-17 | 13F | Citadel Advisors Llc | 1.042.662 | -69,04 | 20.561 | -52,97 | ||||
| 2026-02-12 | 13F | Penserra Capital Management LLC | 482.671 | -8,52 | 10 | 50,00 | ||||
| 2025-11-14 | 13F | Laird Norton Trust Company, Llc | 0 | -100,00 | 0 | -100,00 | ||||
| 2025-11-10 | 13F | Tableaux Llc | 0 | -100,00 | 0 | |||||
| 2026-02-12 | 13F | Summit Financial, LLC | 13.712 | 270 | ||||||
| 2026-02-17 | 13F | Bayesian Capital Management, LP | 0 | -100,00 | 0 | |||||
| 2026-01-05 | 13F | GAMMA Investing LLC | 2.011 | 146,45 | 40 | 290,00 | ||||
| 2026-02-17 | 13F | Gilder Gagnon Howe & Co Llc | 93.000 | 80,71 | 1.834 | 174,40 | ||||
| 2026-02-12 | 13F | Castleark Management Llc | 389.470 | 27,59 | 7.680 | 93,84 | ||||
| 2026-01-15 | 13F | Allspring Global Investments Holdings, LLC | 31.139 | -0,43 | 636 | 47,67 | ||||
| 2026-02-17 | 13F | Science & Technology Partners, L.P. | 950.202 | 18.738 | ||||||
| 2026-02-13 | 13F | McAdam, LLC | 17.710 | 349 | ||||||
| 2025-11-14 | 13F | Point72 Asia (Singapore) Pte. Ltd. | 15.422 | -55,35 | 200 | -4,76 | ||||
| 2026-01-29 | 13F | Dunhill Financial, LLC | 2 | 0 | ||||||
| 2026-01-14 | 13F | Tradewinds Capital Management, LLC | 5.600 | -12,50 | 110 | 32,53 | ||||
| 2026-02-12 | 13F | Polen Capital Management Llc | 111.538 | 2.200 | ||||||
| 2026-02-10 | 13F/A | Northwestern Mutual Wealth Management Co | 4 | 0 | ||||||
| 2026-02-17 | 13F | Ninepoint Partners LP | 21.807 | 133,30 | 430 | 255,37 | ||||
| 2026-02-11 | 13F | MCF Advisors LLC | 1.578 | -35,46 | 31 | 0,00 | ||||
| 2026-02-06 | 13F | EverSource Wealth Advisors, LLC | 863 | 5.653,33 | 17 | |||||
| 2026-02-02 | 13F | Oppenheimer & Co Inc | 1.835.695 | -8,32 | 36.200 | 39,29 | ||||
| 2026-02-03 | 13F | Mitsubishi UFJ Kokusai Asset Management Co., Ltd. | 627.902 | -45,38 | 12.815 | -14,11 | ||||
| 2026-02-13 | 13F | Neo Ivy Capital Management | 213.564 | 4.211 | ||||||
| 2026-03-03 | 13F/A | Caitong International Asset Management Co., Ltd | 61.860 | 5.433,09 | 1.220 | 8.607,14 | ||||
| 2026-01-14 | 13F | ORG Partners LLC | 325 | 62,50 | 6 | 200,00 | ||||
| 2026-02-06 | 13F | ProShare Advisors LLC | 43.646 | 9,28 | 861 | 66,02 | ||||
| 2026-02-06 | 13F | GPS Wealth Strategies Group, LLC | 0 | -100,00 | 0 | -100,00 | ||||
| 2026-02-13 | 13F | Entropy Technologies, LP | 173.315 | 315,62 | 3.418 | 531,61 | ||||
| 2026-02-17 | 13F | Farringdon Capital, Ltd. | 0 | -100,00 | 0 | |||||
| 2026-02-17 | 13F | California State Teachers Retirement System | 233.146 | 23,11 | 4.598 | 87,02 | ||||
| 2026-02-04 | 13F | BCJ Capital Management, LLC | 105.441 | 2.079 | ||||||
| 2026-02-18 | 13F/A | Virtue Capital Management, LLC | 83.296 | 1.837,57 | 1.700 | 143,90 | ||||
| 2026-02-26 | 13F | Anchor Investment Management, LLC | 62 | 0,00 | 1 | |||||
| 2026-02-02 | 13F | Wolverine Asset Management Llc | Put | 19.400 | 106,38 | 383 | 213,11 | |||
| 2025-11-14 | 13F | Point72 (DIFC) Ltd | 0 | -100,00 | 0 | -100,00 | ||||
| 2026-02-17 | 13F | Price T Rowe Associates Inc /md/ | 1.369.657 | -29,80 | 27 | 8,00 | ||||
| 2026-02-17 | 13F | Northern Trust Corp | 2.015.273 | -0,38 | 39.741 | 51,35 | ||||
| 2026-02-17 | 13F | Ionic Capital Management LLC | Put | 152.000 | 49,02 | 2.997 | 126,53 | |||
| 2026-02-17 | 13F | Private Advisor Group, LLC | 40.144 | 286,00 | 792 | 1.135,94 | ||||
| 2026-02-17 | 13F | Private Advisor Group, LLC | Call | 1.000 | 7 | |||||
| 2026-01-23 | 13F | TFC Financial Management | 170 | 0,00 | 3 | 50,00 | ||||
| 2026-02-13 | 13F | JustInvest LLC | 17.043 | 11,01 | 336 | 68,84 | ||||
| 2026-02-10 | 13F | Norges Bank | 887.127 | 17.494 | ||||||
| 2026-02-13 | 13F | Squarepoint Ops LLC | 15.216 | -90,75 | 300 | -85,94 | ||||
| 2026-01-15 | 13F | Nisa Investment Advisors, Llc | 2.758 | 9,23 | 54 | 68,75 | ||||
| 2026-02-13 | 13F | Quarry LP | 1.990 | -60,93 | 39 | -40,91 | ||||
| 2026-02-12 | 13F | State Board Of Administration Of Florida Retirement System | 54.560 | 0,00 | 1.076 | 51,84 | ||||
| 2026-02-11 | 13F | Hughes Financial Services, LLC | 149 | 0,00 | 3 | 100,00 | ||||
| 2025-11-14 | 13F | Two Sigma Securities, Llc | 0 | -100,00 | 0 | -100,00 | ||||
| 2026-02-17 | 13F | Summit Partners Public Asset Management, Llc | Put | 0 | -100,00 | 0 | ||||
| 2026-01-16 | 13F | Bangor Savings Bank | 13.400 | 264 | ||||||
| 2026-01-30 | 13F | Rachor Investment Advisory Services, LLC | 91 | 2 | ||||||
| 2026-02-02 | 13F | Principal Financial Group Inc | 277.993 | -1,48 | 5.482 | 49,70 | ||||
| 2025-11-14 | 13F | Teramo Advisors, LLC | 0 | -100,00 | 0 | -100,00 | ||||
| 2026-02-17 | 13F | Balyasny Asset Management Llc | Put | 973.200 | 85,37 | 19.192 | 181,64 | |||
| 2026-02-17 | 13F | Polymer Capital Management (US) LLC | 20.974 | 414 | ||||||
| 2026-02-02 | 13F | Conestoga Capital Advisors, LLC | 82.985 | -66,30 | 1.636 | -48,81 | ||||
| 2026-02-17 | 13F | Scarborough Advisors, LLC | 1.622 | 0,00 | 32 | 47,62 | ||||
| 2026-02-17 | 13F | Balyasny Asset Management Llc | 11.153 | 220 | ||||||
| 2026-02-10 | 13F | Intech Investment Management Llc | 115.076 | 85,44 | 2.269 | 181,86 | ||||
| 2026-01-28 | 13F | Teacher Retirement System Of Texas | 54.806 | 47,67 | 1.081 | 124,53 | ||||
| 2026-02-06 | 13F | Global Retirement Partners, LLC | 35 | -95,62 | 1 | -100,00 | ||||
| 2026-01-28 | 13F | Arizona State Retirement System | 67.153 | 7,19 | 1.324 | 62,85 | ||||
| 2026-02-11 | 13F | Franklin Resources Inc | 471.376 | -29,97 | 9.296 | 6,40 | ||||
| 2026-02-12 | 13F | DRW Securities, LLC | 0 | -100,00 | 0 | |||||
| 2026-02-17 | 13F | Susquehanna International Group, Llp | Put | 836.400 | 3,44 | 16.494 | 57,15 | |||
| 2026-02-17 | 13F | Odyssean, LLC | 31.510 | 621 | ||||||
| 2026-02-12 | 13F | Wedbush Securities Inc | 0 | -100,00 | 0 | |||||
| 2026-02-17 | 13F | Susquehanna International Group, Llp | Call | 2.600.100 | 30,57 | 51.274 | 98,37 | |||
| 2026-02-13 | 13F | Bridgefront Capital, LLC | 0 | -100,00 | 0 | |||||
| 2025-11-10 | 13F | Eleva Capital SAS | 141.249 | 9,49 | 1.833 | 133,21 | ||||
| 2025-11-14 | 13F | Raymond James Financial Inc | Put | 0 | -100,00 | 0 | -100,00 | |||
| 2026-02-17 | 13F | Millennium Management Llc | 1.232.154 | 213,43 | 24.298 | 376,24 | ||||
| 2026-01-30 | 13F | Jennison Associates Llc | 37.044 | -42,35 | 731 | -12,47 | ||||
| 2026-02-23 | 13F | Virtu Financial LLC | 19.149 | -42,67 | 0 | |||||
| 2026-02-05 | 13F | Staley Capital Advisers Inc | 30.000 | 0,00 | 592 | 51,93 | ||||
| 2026-02-17 | 13F | PharVision Advisers, LLC | 27.048 | -4,65 | 533 | 44,84 | ||||
| 2026-02-13 | 13F | Stifel Financial Corp | 18.050 | 356 | ||||||
| 2026-02-10 | 13F | Belvedere Trading LLC | Put | 0 | -100,00 | 0 | -100,00 | |||
| 2026-01-30 | 13F | Wealthfront Advisers Llc | 12.715 | 5,45 | 251 | 60,26 | ||||
| 2026-02-10 | 13F | Belvedere Trading LLC | Call | 0 | -100,00 | 0 | -100,00 | |||
| 2026-02-11 | 13F | Harvest Fund Management Co., Ltd | 4.282 | 0 | ||||||
| 2025-11-14 | 13F | Sherbrooke Park Advisers Llc | 0 | -100,00 | 0 | -100,00 | ||||
| 2026-02-17 | 13F | Two Sigma Advisers, Lp | 2.074.200 | 336,86 | 40.903 | 563,79 | ||||
| 2026-02-17 | 13F | SVB Capital Management, LLC | 0 | -100,00 | 0 | |||||
| 2026-02-05 | 13F | Cambridge Investment Research Advisors, Inc. | 114.918 | 2,35 | 2 | 100,00 | ||||
| 2026-02-04 | 13F | Arena Capital Advisors, LLC- CA | 154.431 | 0,00 | 3.045 | 51,95 | ||||
| 2026-02-17 | 13F | Rangeley Capital, LLC | 40.000 | 789 | ||||||
| 2026-02-06 | 13F | Handelsbanken Fonder AB | 60.700 | 1 | ||||||
| 2026-02-17 | 13F | Susquehanna International Group, Llp | 166.771 | 3.289 | ||||||
| 2025-10-17 | 13F | Maryland Capital Advisors Inc. | 0 | -100,00 | 0 | |||||
| 2026-01-15 | 13F | Frank, Rimerman Advisors LLC | 25.537 | 0,00 | 504 | 51,96 | ||||
| 2026-01-29 | 13F | Nbc Securities, Inc. | 14.942 | 295 | ||||||
| 2026-02-10 | 13F | Rothschild Investment Llc | 532 | 5,35 | 10 | 66,67 | ||||
| 2026-02-17 | 13F | Janus Henderson Group Plc | 112.838 | 21,28 | 2.224 | 84,11 | ||||
| 2026-02-17 | 13F | Caption Management, LLC | Call | 100.000 | -81,22 | 1.972 | -71,47 | |||
| 2026-02-13 | 13F | Aigen Investment Management, Lp | 18.234 | 360 | ||||||
| 2026-01-26 | 13F | KBC Group NV | 9.324 | 0,00 | 0 | |||||
| 2026-02-12 | 13F | Commonwealth Equity Services, Llc | 13.906 | 274 | ||||||
| 2026-02-17 | 13F | Aqr Capital Management Llc | 406.583 | 2,35 | 8.018 | 55,49 | ||||
| 2026-02-12 | 13F | Hrt Financial Lp | 222.176 | -83,37 | 4 | -76,47 | ||||
| 2026-02-11 | 13F | Syon Capital Llc | 12.342 | 243 | ||||||
| 2026-02-17 | 13F | Brevan Howard Capital Management LP | 209.717 | 438,73 | 4.250 | 741,39 | ||||
| 2026-01-09 | 13F | 180 Wealth Advisors, Llc | 148.309 | 0,87 | 2.925 | 53,25 | ||||
| 2026-02-17 | 13F | D. E. Shaw & Co., Inc. | Call | 189.400 | 85,50 | 3.735 | 181,81 | |||
| 2026-02-11 | 13F | Vermillion Wealth Management, Inc. | 46 | 1 | ||||||
| 2026-02-13 | 13F | Ranger Investment Management, L.P. | 640.069 | 209,12 | 12.622 | 369,74 | ||||
| 2026-02-17 | 13F | D. E. Shaw & Co., Inc. | Put | 129.000 | 0,00 | 2.544 | 51,91 | |||
| 2026-02-17 | 13F | D. E. Shaw & Co., Inc. | 9.886.199 | 54,08 | 194.956 | 134,09 | ||||
| 2026-02-17 | 13F/A | Intesa Sanpaolo S.p.a. | 6.000 | 118 | ||||||
| 2026-01-26 | 13F | La Banque Postale Asset Management SA | 666.927 | -23,74 | 13.152 | 15,86 | ||||
| 2026-02-10 | 13F | Close Asset Management Ltd | 8.100 | 0,00 | 0 | |||||
| 2026-01-23 | 13F | Assetmark, Inc | 262 | 0,00 | 5 | 66,67 | ||||
| 2026-02-17 | 13F | Liontrust Investment Partners LLP | 312.066 | -36,77 | 6.154 | -3,95 | ||||
| 2026-02-17 | 13F | Point72 Asset Management, L.P. | 591.799 | 1.094,52 | 11.670 | 1.714,93 | ||||
| 2026-02-17 | 13F | Mangrove Partners | 11.492 | 227 | ||||||
| 2026-01-06 | 13F | Penbrook Management LLC | 295.245 | -6,04 | 5.822 | 42,77 | ||||
| 2026-02-17 | 13F | Point72 Asset Management, L.P. | Call | 92.000 | 1.814 | |||||
| 2026-02-10 | 13F | Greenspring Advisors, LLC | 11.662 | -30,01 | 230 | 6,02 | ||||
| 2026-02-12 | 13F | Davy Global Fund Management Ltd | 110.713 | -49,77 | 2.183 | -23,67 | ||||
| 2026-02-17 | 13F | State Of Wisconsin Investment Board | 30.474 | -12,24 | 601 | 33,33 | ||||
| 2025-09-29 | NP | PRFZ - Invesco FTSE RAFI US 1500 Small-Mid ETF This fund is a listed as child fund of Invesco Ltd. and if that institution has disclosed ownership in this security, then these positions will not be double counted when calculating total shares and total value | 200.753 | 7,21 | 1.255 | 103,57 | ||||
| 2026-02-10 | 13F | Daiwa Securities Group Inc. | 5.177 | -50,17 | 0 | |||||
| 2026-02-10 | 13F | CIBC Asset Management Inc | 13.988 | 276 | ||||||
| 2026-02-12 | 13F | Federated Hermes, Inc. | 501.693 | 9.893 | ||||||
| 2026-02-10 | 13F | Axq Capital, Lp | 0 | -100,00 | 0 | |||||
| 2026-02-17 | 13F | Scientech Research LLC | 32.572 | 642 | ||||||
| 2026-02-17 | 13F | Concentric Capital Strategies, LP | 113.394 | 2.236 | ||||||
| 2026-01-28 | 13F | Klp Kapitalforvaltning As | 52.100 | 23,46 | 1.027 | 87,75 | ||||
| 2025-09-29 | NP | KCXIX - Knights of Columbus U.S. All Cap Index Fund I Shares | 967 | 10,51 | 6 | 200,00 | ||||
| 2026-02-13 | 13F | Visionary Wealth Advisors | 0 | -100,00 | 0 | |||||
| 2026-01-28 | 13F | Crown Wealth Group, LLC | 23.258 | 15,44 | 459 | 75,48 | ||||
| 2026-02-05 | 13F | Fingerlakes Wealth Management, Inc. | 10.000 | 0,00 | 197 | 52,71 | ||||
| 2026-02-17 | 13F | Amussen Hunsaker Associates Llc | 0 | -100,00 | 0 | |||||
| 2025-11-13 | 13F | Quadrature Capital Ltd | 0 | -100,00 | 0 | -100,00 | ||||
| 2026-02-06 | 13F | Orcam Financial Group | 34.691 | 0,00 | 684 | 52,00 | ||||
| 2026-01-16 | 13F | FNY Investment Advisers, LLC | 2.060 | -97,38 | 0 | -100,00 | ||||
| 2025-09-29 | NP | CFSSX - Column Small Cap Select Fund | 512.552 | 3.634 | ||||||
| 2026-02-12 | 13F | MetLife Investment Management, LLC | 132.560 | -3,01 | 2.614 | 47,43 | ||||
| 2026-02-17 | 13F | Toronto Dominion Bank | Put | 315.000 | 6.212 | |||||
| 2026-02-17 | 13F | Toronto Dominion Bank | Call | 4.500.000 | 88.740 | |||||
| 2026-01-14 | 13F | Spire Wealth Management | 4.700 | 526,67 | 93 | 922,22 | ||||
| 2026-02-05 | 13F | Allworth Financial LP | 21.752 | -27,88 | 429 | 9,46 | ||||
| 2026-02-06 | 13F | Leonteq Securities AG | 23.329 | -32,76 | 460 | 2,22 | ||||
| 2026-02-03 | 13F | BHK Investment Advisors, LLC | 70.000 | 1.380 | ||||||
| 2026-02-17 | 13F | Toronto Dominion Bank | 539.984 | 10.648 | ||||||
| 2026-02-13 | 13F | Charles Schwab Investment Management Inc | 2.072.094 | 1,53 | 40.862 | 54,25 | ||||
| 2026-01-23 | 13F | Baillie Gifford & Co | 1.637 | 32 | ||||||
| 2026-02-17 | 13F | Prelude Capital Management, Llc | 0 | -100,00 | 0 | -100,00 | ||||
| 2026-02-27 | 13F | Strategic Investment Solutions, Inc. /IL | 425 | 0,00 | 8 | 60,00 | ||||
| 2026-02-17 | 13F | Royal Bank Of Canada | 191.003 | -51,69 | 3.767 | -26,58 | ||||
| 2026-01-28 | 13F | Nvest Wealth Strategies, Inc. | 100 | 2 | ||||||
| 2026-03-16 | 13F/A | Rockefeller Capital Management L.P. | 18.986 | 0,64 | 374 | 53,28 | ||||
| 2026-01-12 | 13F | Thompson Davis & Co., Inc. | 24.050 | -3,02 | 474 | 47,66 | ||||
| 2026-02-17 | 13F | Russell Investments Group, Ltd. | 283.149 | 64,25 | 5.584 | 149,58 | ||||
| 2026-02-02 | 13F | Strs Ohio | 33.100 | -62,81 | 653 | -43,55 | ||||
| 2026-02-09 | 13F | Hantz Financial Services, Inc. | 9 | 0 | ||||||
| 2026-03-06 | 13F | Hsbc Holdings Plc | 422.185 | 8.457 | ||||||
| 2025-11-13 | 13F | Jump Financial, LLC | 0 | -100,00 | 0 | -100,00 | ||||
| 2026-02-13 | 13F | Kestra Advisory Services, LLC | 0 | -100,00 | 0 | |||||
| 2025-09-29 | NP | UFO - Procure Space ETF | 626.473 | 6,11 | 3.915 | 101,60 | ||||
| 2026-01-29 | 13F | Concord Wealth Partners | 28 | 1 | ||||||
| 2026-02-12 | 13F | Cibc World Markets Corp | 15.765 | -40,27 | 311 | 92,55 | ||||
| 2026-02-17 | 13F | Boothbay Fund Management, Llc | 0 | -100,00 | 0 | |||||
| 2026-02-06 | 13F | Vestmark Advisory Solutions, Inc. | 39.329 | 776 | ||||||
| 2026-01-23 | 13F | Optima Capital Llc | 29 | 1 | ||||||
| 2026-02-13 | 13F | Rice Hall James & Associates, Llc | 224.987 | -33,50 | 4.437 | 1,02 | ||||
| 2026-02-13 | 13F | Parkside Financial Bank & Trust | 1.550 | 92,55 | 31 | 200,00 | ||||
| 2026-02-12 | 13F | EAM Investors, LLC | 266.163 | -37,60 | 5.249 | -3,65 | ||||
| 2026-01-29 | 13F | Comerica Bank | 247 | -15,41 | 5 | 33,33 | ||||
| 2026-01-23 | 13F | DHJJ Financial Advisors, Ltd. | 100 | 0,00 | 2 | 0,00 | ||||
| 2026-02-11 | 13F | Deutsche Bank Ag\ | 540.700 | 209,35 | 10.663 | 370,11 | ||||
| 2026-02-13 | 13F | Smartleaf Asset Management LLC | 6.927 | 137 | ||||||
| 2026-01-30 | 13F | State of New Jersey Common Pension Fund D | 188.372 | 3.715 | ||||||
| 2026-02-13 | 13F | American Century Companies Inc | 80.364 | -78,05 | 1.585 | -66,67 | ||||
| 2026-02-12 | 13F | Brinker Capital Investments, LLC | 93.961 | 1.853 | ||||||
| 2026-02-17 | 13F | Occudo Quantitative Strategies Lp | 165.114 | 118,22 | 3.256 | 231,57 | ||||
| 2026-02-17 | 13F | Graham Capital Management, L.P. | 0 | -100,00 | 0 | |||||
| 2026-02-17 | 13F | Creative Planning | 70.102 | 93,92 | 1.382 | 194,67 | ||||
| 2026-02-13 | 13F | Arrowstreet Capital, Limited Partnership | 1.071.075 | 7,92 | 21.122 | 63,96 | ||||
| 2025-09-29 | NP | RSSL - Global X Russell 2000 ETF | 109.639 | -18,05 | 685 | 55,68 | ||||
| 2026-01-23 | 13F | Farther Finance Advisors, LLC | 8.399 | 588,44 | 166 | 1.000,00 | ||||
| 2026-02-06 | 13F | Gsa Capital Partners Llp | 58.470 | -40,01 | 1 | 0,00 | ||||
| 2026-02-17 | 13F | Css Llc/il | Put | 32.700 | -35,50 | 645 | -2,13 | |||
| 2026-02-17 | 13F | London & Capital Asset Management Ltd | 70.000 | -12,50 | 1.380 | 32,85 | ||||
| 2026-02-17 | 13F | Css Llc/il | 11.818 | 0,00 | 233 | 52,29 | ||||
| 2026-02-10 | 13F | State of Wyoming | 8.968 | -28,85 | 177 | 7,98 | ||||
| 2026-02-09 | 13F | Jefferies Financial Group Inc. | 0 | -100,00 | 0 | |||||
| 2026-02-17 | 13F | Harvest Investment Services, LLC | 37.239 | 734 | ||||||
| 2026-02-17 | 13F | XTX Topco Ltd | 0 | -100,00 | 0 | |||||
| 2026-02-10 | 13F | Intellectus Partners, LLC | 0 | -100,00 | 0 | |||||
| 2026-02-17 | 13F | Clough Capital Partners L P | 0 | -100,00 | 0 | |||||
| 2026-02-06 | 13F | Larson Financial Group LLC | 1.647 | -45,10 | 32 | -15,79 | ||||
| 2026-02-17 | 13F | Raymond James Financial Inc | 111.536 | -30,20 | 2.199 | 6,03 | ||||
| 2026-02-11 | 13F | Zions Bancorporation, National Association /ut/ | 57 | 1 | ||||||
| 2026-02-12 | 13F | Nuveen, LLC | 3.021.366 | 48,55 | 59.581 | 125,69 | ||||
| 2026-02-11 | 13F | RWC Asset Management LLP | 34.700 | -18,01 | 684 | 24,59 | ||||
| 2026-02-17 | 13F | Quantinno Capital Management LP | 21.601 | 51,84 | 426 | 130,98 | ||||
| 2026-02-17 | 13F | Alliancebernstein L.p. | 240.500 | 3,52 | 4.743 | 57,28 | ||||
| 2026-02-06 | 13F | IFP Advisors, Inc | 381 | 2.141,18 | 8 | |||||
| 2026-02-17 | 13F | Millennium Management Llc | Put | 0 | -100,00 | 0 | ||||
| 2025-11-14 | 13F | Ionic Capital Management LLC | Call | 0 | -100,00 | 0 | -100,00 | |||
| 2025-11-12 | 13F | Simplex Trading, Llc | 0 | -100,00 | 0 | |||||
| 2026-02-13 | 13F | Morgan Stanley | 1.247.317 | -30,80 | 24.597 | 5,14 | ||||
| 2025-11-12 | 13F | HAP Trading, LLC | Call | 50.000 | 450 | |||||
| 2026-02-17 | 13F | RiverPark Advisors, LLC | 5.102 | -26,83 | 101 | 11,11 | ||||
| 2026-02-17 | 13F | Driehaus Capital Management Llc | 8.511.620 | -40,78 | 167.849 | -10,03 | ||||
| 2026-02-03 | 13F | Orion Capital Management LLC | 559 | 13,16 | 11 | 83,33 | ||||
| 2026-02-10 | 13F | Florida Financial Advisors, Llc | 54.518 | 1.074 | ||||||
| 2026-02-12 | 13F | Alphabet Inc. | 31.942.641 | 0,00 | 629.909 | 51,93 | ||||
| 2026-02-12 | 13F | Dimensional Fund Advisors Lp | 3.942.201 | -0,82 | 77.741 | 50,69 | ||||
| 2026-01-12 | 13F | Connective Portfolio Management, LLC | 80.000 | 1.578 | ||||||
| 2026-01-23 | 13F | Westside Investment Management, Inc. | 2.000 | 0,00 | 41 | 48,15 | ||||
| 2026-01-28 | 13F | Universal- Beteiligungs- und Servicegesellschaft mbH | 597.124 | -43,48 | 11.775 | -14,13 | ||||
| 2026-02-05 | 13F | Amalgamated Bank | 7.487 | 0,17 | 0 | |||||
| 2026-02-13 | 13F | Barclays Plc | 1.354.421 | -63,67 | 26.709 | -44,80 | ||||
| 2026-02-10 | 13F | Root Financial Partners, LLC | 157 | 0,00 | 3 | 50,00 | ||||
| 2026-02-09 | 13F | King Luther Capital Management Corp | 705.273 | -18,02 | 13.908 | 24,55 | ||||
| 2026-02-11 | 13F | Jpmorgan Chase & Co | 316.273 | 8,44 | 6.237 | 64,76 | ||||
| 2026-02-09 | 13F | Wellington Shields & Co., LLC | 15.776 | 2,84 | 311 | 56,28 | ||||
| 2026-02-17 | 13F | Trexquant Investment LP | 741.279 | -66,94 | 14.618 | -49,77 | ||||
| 2025-10-20 | 13F | Virginia Retirement Systems Et Al | 0 | -100,00 | 0 | -100,00 | ||||
| 2026-02-10 | 13F | Once Capital Management, LLC | 0 | -100,00 | 0 | |||||
| 2025-11-14 | 13F | Capstone Investment Advisors, Llc | 78.333 | 1.017 | ||||||
| 2026-02-03 | 13F | SBI Securities Co., Ltd. | 39.338 | 55,32 | 776 | 136,28 | ||||
| 2026-02-13 | 13F | Ubs Asset Management Americas Inc | 705.554 | 53,85 | 13.914 | 133,75 | ||||
| 2025-11-14 | 13F | Cubist Systematic Strategies, LLC | 875.995 | 44,16 | 11.370 | 206,80 | ||||
| 2026-02-17 | 13F | Amundi | 15.515 | 306 | ||||||
| 2025-11-14 | 13F | Cubist Systematic Strategies, LLC | Call | 87.800 | 1.140 | |||||
| 2026-02-13 | 13F | Pingora Partners LLC | 0 | -100,00 | 0 | |||||
| 2026-02-09 | 13F | Lisanti Capital Growth, LLC | 105.030 | 2.071 | ||||||
| 2026-02-13 | 13F | Public Employees Retirement Association Of Colorado | 32.018 | 1 | ||||||
| 2026-02-13 | 13F | First Trust Advisors Lp | 620.518 | -39,92 | 12.237 | -8,73 | ||||
| 2026-02-13 | 13F | Mirova | 302.140 | -5,72 | 5.958 | 43,26 | ||||
| 2026-02-17 | 13F | LMR Partners LLP | Put | 600.000 | 11.832 | |||||
| 2026-01-09 | 13F | SG Americas Securities, LLC | 23.839 | -0,64 | 0 | |||||
| 2026-02-17 | 13F | Ameriprise Financial Inc | Put | 0 | -100,00 | 0 | ||||
| 2026-02-13 | 13F | State Street Corp | 5.990.996 | -4,80 | 118.142 | 44,63 | ||||
| 2025-11-14 | 13F | Ardsley Advisory Partners Lp | Call | 0 | -100,00 | 0 | ||||
| 2026-02-17 | 13F | Fmr Llc | 2.695.643 | 52,15 | 53.158 | 131,16 | ||||
| 2025-11-14 | 13F | Ardsley Advisory Partners Lp | 0 | -100,00 | 0 | |||||
| 2026-02-12 | 13F | Jane Street Group, Llc | Call | 5.562.700 | 799,39 | 109.696 | 1.266,42 | |||
| 2026-02-17 | 13F | MIRAE ASSET GLOBAL ETFS HOLDINGS Ltd. | 110.687 | 2,00 | 2.183 | 54,97 | ||||
| 2026-02-09 | 13F | Fedenia Advisers LLC | 0 | -100,00 | 0 | |||||
| 2026-01-29 | 13F | Sanctuary Advisors, LLC | 22.704 | 60,74 | 448 | 144,26 | ||||
| 2026-02-12 | 13F | Jane Street Group, Llc | 1.824.023 | -31,16 | 35.970 | 4,58 | ||||
| 2026-02-17 | 13F | ExodusPoint Capital Management, LP | 0 | -100,00 | 0 | -100,00 | ||||
| 2026-02-17 | 13F | ArrowMark Colorado Holdings LLC | 313.000 | -56,83 | 6.172 | -34,40 | ||||
| 2026-02-17 | 13F | Mirabella Financial Services Llp | 15.731 | 310 | ||||||
| 2026-02-12 | 13F | Jane Street Group, Llc | Put | 444.200 | 56,57 | 8.760 | 137,89 | |||
| 2026-01-16 | 13F | Ronald Blue Trust, Inc. | 1.000 | 20 | ||||||
| 2026-02-13 | 13F | Marshall Wace, Llp | 0 | -100,00 | 0 | |||||
| 2026-02-17 | 13F | Canada Pension Plan Investment Board | 7.905.400 | 0,97 | 155.894 | 53,40 | ||||
| 2026-02-09 | 13F | Legal & General Group Plc | 265.768 | 1,70 | 5.241 | 54,53 | ||||
| 2025-10-21 | 13F | Munro Partners | 0 | 0 | ||||||
| 2026-02-10 | 13F | Hillsdale Investment Management Inc. | 550 | -38,89 | 11 | -9,09 | ||||
| 2026-02-18 | 13F | Mackenzie Financial Corp | 14.631 | 9,48 | 288 | 66,47 | ||||
| 2026-01-14 | 13F | Acropolis Investment Management, LLC | 20.000 | 0,00 | 394 | 222,95 | ||||
| 2026-02-17 | 13F | Engineers Gate Manager LP | 483.357 | 63,81 | 9.532 | 148,85 | ||||
| 2026-02-12 | 13F | Groupe la Francaise | 12.500 | 246 | ||||||
| 2026-02-12 | 13F | Ensign Peak Advisors, Inc | 18.600 | -67,62 | 367 | -50,87 | ||||
| 2026-01-28 | 13F | Financial Perspectives, Inc | 165 | 0,00 | 3 | 50,00 | ||||
| 2026-01-29 | 13F | Vanguard Group Inc | 19.358.515 | 4,35 | 381.750 | 58,53 | ||||
| 2026-02-11 | 13F | O'shaughnessy Asset Management, Llc | 11.961 | 18,81 | 236 | 80,77 | ||||
| 2026-01-23 | 13F | Avion Wealth | 147 | 0,00 | 0 | |||||
| 2026-02-17 | 13F | Jones Financial Companies Lllp | 6.546 | 82,29 | 129 | 200,00 | ||||
| 2026-01-16 | 13F | Perigon Wealth Management, LLC | 141.003 | -0,12 | 2.781 | 51,75 | ||||
| 2026-01-29 | 13F | IMC-Chicago, LLC | 44.676 | -59,99 | 881 | -39,20 | ||||
| 2025-11-14 | 13F | Natixis | 0 | -100,00 | 0 | -100,00 | ||||
| 2026-02-12 | 13F | Laffer Investments | 16.272 | 321 | ||||||
| 2026-02-13 | 13F | Archon Capital Management LLC | 13.700 | -97,48 | 270 | -96,17 | ||||
| 2026-01-30 | 13F | Us Bancorp \de\ | 435 | -51,67 | 9 | -27,27 | ||||
| 2026-02-13 | 13F | Wells Fargo & Company/mn | 366.105 | 146,94 | 7.220 | 275,21 |
Other Listings
| US:PL | 32,40 $ |