Grundlæggende statistik
| Institutionelle aktier (lange) | 76.228.552 - 38,76% (ex 13D/G) - change of 10,89MM shares 16,67% MRQ |
| Institutionel værdi (lang) | $ 817.040 USD ($1000) |
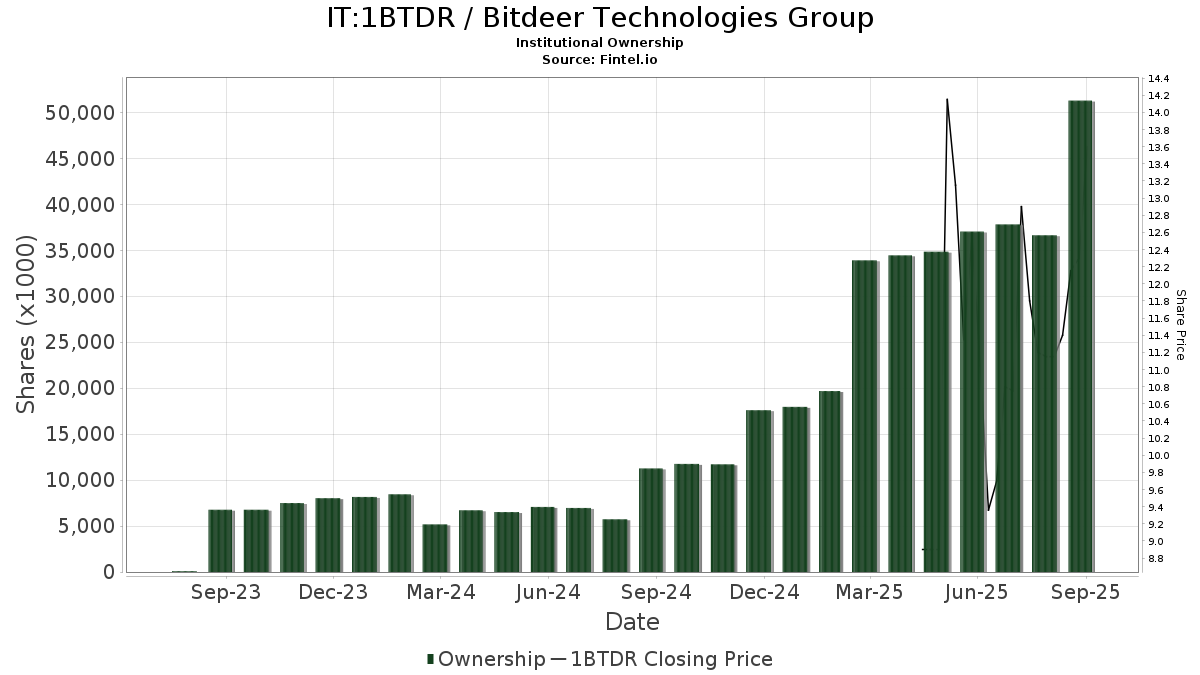
Institutionelt ejerskab og aktionærer
Bitdeer Technologies Group (IT:1BTDR) har 181 institutionelle ejere og aktionærer, der har indsendt 13D/G- eller 13F-formularer til Securities Exchange Commission (SEC). Disse institutioner har i alt 76,228,552 aktier. Største aktionærer omfatter Fund Resources Investment Holding Group Co Ltd, Barclays Plc, BlackRock, Inc., Value Aligned Research Advisors, LLC, State Street Corp, Paloma Partners Management Co, Wolverine Asset Management Llc, UBS Group AG, CastleKnight Management LP, and Susquehanna International Group, Llp .
Bitdeer Technologies Group (BIT:1BTDR) institutionel ejerskabsstruktur viser aktuelle positioner i virksomheden efter institutioner og fonde, samt seneste ændringer i positionsstørrelse. Større aktionærer kan omfatte individuelle investorer, investeringsforeninger, hedgefonde eller institutioner. Skema 13D angiver, at investoren besidder (eller besidder) mere end 5 % af virksomheden og har til hensigt (eller har til hensigt at) aktivt at forfølge en ændring i forretningsstrategi. Skema 13G indikerer en passiv investering på over 5%.
The share price as of April 28, 2026 is 10,79 / share. Previously, on April 29, 2025, the share price was 8,90 / share. This represents an increase of 21,28% over that period.
Fondens stemningsscore
Fund Sentiment Score (fka Ownership Accumulation Score) finder de aktier, der bliver mest købt af fonde. Det er resultatet af en sofistikeret, multi-faktor kvantitativ model, der identificerer virksomheder med de højeste niveauer af institutionel akkumulering. Scoringsmodellen bruger en kombination af den samlede stigning i oplyste ejere, ændringerne i porteføljeallokeringer i disse ejere og andre målinger. Tallet går fra 0 til 100, hvor højere tal indikerer et højere niveau af akkumulering for sine jævnaldrende, og 50 er gennemsnittet.
Opdateringsfrekvens: Dagligt
Se Ownership Explorer, som giver en liste over højest rangerende virksomheder.
AI+ Ask Fintel’s AI assistant about Bitdeer Technologies Group.
Select a question to share a public post with an AI-crafted answer.
Thinking of good questions…
13F og NPORT arkivering
Detaljer om 13F-arkivering er gratis. Detaljer om NP-ansøgninger kræver et premium-medlemskab. Grønne rækker angiver nye positioner. Røde rækker angiver lukkede positioner. Klik på linket ikon for at se den fulde transaktionshistorik.
Opgrader
for at låse premium-data op og eksportere til Excel ![]() .
.
| Fil dato | Kilde | Investor | Type | Gennemsnitlig pris (Øst) |
Aktier | Δ Aktier (%) |
Rapporteret Værdi ($1000) |
Δ Værdi (%) |
Port Alloc (%) |
|
|---|---|---|---|---|---|---|---|---|---|---|
| 2026-02-06 | 13F | Global Retirement Partners, LLC | 384 | 4 | ||||||
| 2026-02-17 | 13F | Two Sigma Investments, Lp | 612.150 | 116,09 | 6.862 | 41,75 | ||||
| 2026-04-15 | 13F | Activest Wealth Management | 2.000 | 17 | ||||||
| 2026-01-29 | 13F | Comerica Bank | 15.000 | -40,07 | 168 | -60,66 | ||||
| 2026-02-17 | 13F | BlueCrest Capital Management Ltd | Put | 50.000 | 560 | |||||
| 2026-02-17 | 13F | Elequin Capital Lp | 1.047 | 12 | ||||||
| 2026-02-06 | 13F | Harvest Portfolios Group Inc. | 110.238 | -19,97 | 1.236 | -47,54 | ||||
| 2026-01-28 | 13F | Teacher Retirement System Of Texas | 63.245 | 15,78 | 709 | -24,12 | ||||
| 2026-04-13 | 13F | IFP Advisors, Inc | 4 | -76,47 | 0 | |||||
| 2026-02-11 | 13F | Simplex Trading, Llc | 0 | -100,00 | 0 | |||||
| 2026-02-17 | 13F | Graham Capital Management, L.P. | 0 | -100,00 | 0 | -100,00 | ||||
| 2026-02-17 | 13F | Two Sigma Investments, Lp | Put | 645.100 | 1,90 | 7.232 | -33,16 | |||
| 2026-02-17 | 13F | Two Sigma Investments, Lp | Call | 19.300 | 216 | |||||
| 2025-11-14 | 13F | Main Management ETF Advisors, LLC | 0 | -100,00 | 0 | |||||
| 2026-02-13 | 13F | Kilter Group LLC | 0 | -100,00 | 0 | |||||
| 2026-02-13 | 13F | Walleye Capital LLC | Put | 283.200 | 853,54 | 3.175 | 526,04 | |||
| 2026-02-13 | 13F | Walleye Capital LLC | Call | 289.900 | 110,22 | 3.250 | 37,90 | |||
| 2025-11-13 | 13F | Chesapeake Capital Corp /il/ | 0 | -100,00 | 0 | |||||
| 2026-02-17 | 13F | Shay Capital LLC | Call | 0 | -100,00 | 0 | ||||
| 2026-02-13 | 13F | Vontobel Holding Ltd. | 11.478 | -64,86 | 129 | -77,06 | ||||
| 2026-02-13 | 13F | Citigroup Inc | 913.078 | 38,37 | 10.236 | -9,24 | ||||
| 2026-02-13 | 13F | Mariner, LLC | 10.474 | 117 | ||||||
| 2026-02-13 | 13F | Citigroup Inc | Put | 25.000 | 0,00 | 280 | -34,43 | |||
| 2025-11-14 | 13F | Wolverine Trading, Llc | 122.056 | 43,82 | 2.113 | 124,44 | ||||
| 2026-02-11 | 13F | Havemeyer Place LP | 19.556 | 219 | ||||||
| 2026-02-13 | 13F | Lord, Abbett & Co. Llc | Call | 447.500 | 0 | |||||
| 2025-11-14 | 13F | Wolverine Trading, Llc | Call | 237.500 | 40,53 | 4.111 | 119,37 | |||
| 2025-11-14 | 13F | Wolverine Trading, Llc | Put | 217.900 | 552,40 | 3.772 | 919,19 | |||
| 2026-02-12 | 13F | Cibc World Markets Corp | 0 | -100,00 | 0 | |||||
| 2026-02-13 | 13F | DLD Asset Management, LP | Put | 1.663.500 | 426,42 | 18.673 | 245,91 | |||
| 2026-02-17 | 13F | Price T Rowe Associates Inc /md/ | 53.977 | 10,45 | 1 | |||||
| 2026-02-17 | 13F | Beryl Capital Management LLC | 0 | -100,00 | 0 | |||||
| 2026-02-13 | 13F | Cornerstone Financial Management LLC | 127 | 1 | ||||||
| 2026-02-17 | 13F | Susquehanna International Group, Llp | Call | 1.933.000 | -12,36 | 21.669 | -42,51 | |||
| 2026-02-17 | 13F | Susquehanna International Group, Llp | 768.303 | 82,86 | 8.613 | 19,94 | ||||
| 2026-04-15 | 13F | Exchange Traded Concepts, Llc | 1.011.786 | 145,15 | 8.752 | 89,17 | ||||
| 2026-02-17 | 13F | Susquehanna International Group, Llp | Put | 1.320.500 | 5,30 | 14.803 | -30,93 | |||
| 2026-02-10 | 13F | 1492 Capital Management LLC | 0 | -100,00 | 0 | |||||
| 2026-02-17 | 13F | Lazard Asset Management Llc | 167.690 | 1.880 | ||||||
| 2026-02-17 | 13F | Citadel Advisors Llc | Put | 487.000 | -31,70 | 5.459 | -55,20 | |||
| 2026-02-17 | 13F | Citadel Advisors Llc | 1.901.943 | 364,40 | 21.321 | 204,61 | ||||
| 2026-02-17 | 13F | Citadel Advisors Llc | Call | 1.523.700 | -7,79 | 17.081 | -39,52 | |||
| 2026-02-17 | 13F | ExodusPoint Capital Management, LP | Call | 0 | -100,00 | 0 | -100,00 | |||
| 2026-02-13 | 13F | Keystone Investors Pte Ltd | 0 | -100,00 | 0 | |||||
| 2026-02-17 | 13F | ExodusPoint Capital Management, LP | 0 | -100,00 | 0 | -100,00 | ||||
| 2026-02-17 | 13F | Balyasny Asset Management Llc | Call | 0 | -100,00 | 0 | ||||
| 2026-02-13 | 13F | Neo Ivy Capital Management | 100.260 | -50,00 | 1.124 | -67,22 | ||||
| 2026-02-13 | 13F | Walleye Capital LLC | 93.219 | 83,82 | 1.045 | 20,55 | ||||
| 2026-02-13 | 13F | Quarry LP | 410 | 5 | ||||||
| 2026-02-11 | 13F | Ameritas Investment Partners, Inc. | 7.501 | 84 | ||||||
| 2026-03-23 | 13F | Galaxy Group Investments LLC | 0 | -100,00 | 0 | -100,00 | ||||
| 2026-02-17 | 13F | D. E. Shaw & Co., Inc. | 0 | -100,00 | 0 | -100,00 | ||||
| 2026-02-17 | 13F | Fmr Llc | 1.704.774 | -34,25 | 19.111 | -56,87 | ||||
| 2025-11-14 | 13F | Raymond James Financial Inc | 0 | -100,00 | 0 | -100,00 | ||||
| 2026-02-13 | 13F | Y-Intercept (Hong Kong) Ltd | 0 | -100,00 | 0 | |||||
| 2026-02-11 | 13F | MCF Advisors LLC | 200 | 2 | ||||||
| 2026-02-13 | 13F | SPX Equities Gestao de Recursos Ltda | 0 | -100,00 | 0 | |||||
| 2026-02-10 | 13F | Intech Investment Management Llc | 41.252 | 49,78 | 462 | -1,70 | ||||
| 2026-02-17 | 13F | Royal Bank Of Canada | 5.298 | -38,76 | 60 | -59,46 | ||||
| 2026-02-13 | 13F | Manufacturers Life Insurance Company, The | 0 | -100,00 | 0 | |||||
| 2026-02-12 | 13F | Steward Partners Investment Advisory, Llc | 1.425 | 103,57 | 16 | 36,36 | ||||
| 2026-02-13 | 13F | SRS Capital Advisors, Inc. | 400 | -2,44 | 4 | -42,86 | ||||
| 2026-02-13 | 13F | Sculptor Capital LP | Put | 41.800 | 2,45 | 469 | -32,86 | |||
| 2026-02-06 | 13F | EverSource Wealth Advisors, LLC | 4 | 0,00 | 0 | |||||
| 2026-02-11 | 13F | Deltroit Asset Management (UK) LLP | 750.000 | 8.408 | ||||||
| 2026-02-13 | 13F | SC CHINA HOLDING Ltd | 293.732 | 0,00 | 4.124 | -40,69 | ||||
| 2026-02-17 | 13F | Aster Capital Management (DIFC) Ltd | 0 | -100,00 | 0 | |||||
| 2026-02-11 | 13F | Deltroit Asset Management (UK) LLP | Call | 500.000 | 5.605 | |||||
| 2026-02-17 | 13F | Capital Fund Management S.a. | Put | 0 | -100,00 | 0 | ||||
| 2026-02-17 | 13F | Engineers Gate Manager LP | 53.890 | 604 | ||||||
| 2026-02-17 | 13F | Bank Of America Corp /de/ | 220.062 | -87,51 | 2.467 | -91,81 | ||||
| 2026-02-12 | 13F | Swiss National Bank | 198.700 | 11,57 | 2.227 | -26,82 | ||||
| 2026-01-15 | 13F | Nisa Investment Advisors, Llc | 849 | -1,51 | 10 | -35,71 | ||||
| 2026-02-17 | 13F | Blackstone Group Inc | 10.444 | 117 | ||||||
| 2026-02-13 | 13F | Sc Us (ttgp), Ltd. | 138.168 | 0,00 | 1.549 | -34,43 | ||||
| 2026-02-13 | 13F | Walleye Trading LLC | 0 | -100,00 | 0 | -100,00 | ||||
| 2026-01-06 | 13F | Sanctuary Advisors, LLC | 0 | -100,00 | 0 | -100,00 | ||||
| 2026-02-13 | 13F | Quinn Opportunity Partners LLC | 40.000 | 448 | ||||||
| 2026-02-11 | 13F | Group One Trading, L.p. | 164.212 | -80,37 | 1.841 | -87,13 | ||||
| 2026-02-17 | 13F | Advisor Group Holdings, Inc. | 580 | 8,41 | 7 | -33,33 | ||||
| 2026-02-13 | 13F | K2 Principal Fund, L.p. | Put | 50.000 | 560 | |||||
| 2026-02-17 | 13F | CastleKnight Management LP | 2.095.116 | 47,00 | 23.486 | -3,58 | ||||
| 2026-02-13 | 13F | DeepCurrents Investment Group LLC | Call | 2.000 | 2.242 | |||||
| 2026-02-17 | 13F | Bank Of America Corp /de/ | Put | 0 | -100,00 | 0 | -100,00 | |||
| 2026-02-17 | 13F | Boothbay Fund Management, Llc | 138.836 | 247,09 | 1.556 | 127,82 | ||||
| 2026-04-24 | 13F | UMA Financial Services, Inc. | 0 | -100,00 | 0 | |||||
| 2026-02-17 | 13F | Merewether Investment Management, LP | 0 | -100,00 | 0 | |||||
| 2026-04-07 | 13F | Farther Finance Advisors, LLC | 257 | 117,80 | 2 | 100,00 | ||||
| 2026-02-17 | 13F | SummitTX Capital, L.P. | 18.122 | -50,68 | 203 | -67,62 | ||||
| 2026-02-12 | 13F | Advisors Asset Management, Inc. | 2.562 | -0,89 | 29 | -36,36 | ||||
| 2026-02-02 | 13F | Wolverine Asset Management Llc | Put | 2.772.500 | -3,46 | 31.080 | -36,68 | |||
| 2026-02-17 | 13F | Creative Planning | 32.848 | 368 | ||||||
| 2026-02-17 | 13F | Sona Asset Management (us) Llc | Call | 500.000 | -72,22 | 5.605 | -81,78 | |||
| 2026-02-13 | 13F | Stifel Financial Corp | 10.000 | -21,26 | 112 | -48,39 | ||||
| 2026-02-17 | 13F | Sona Asset Management (us) Llc | 374.003 | -51,68 | 4.193 | -68,31 | ||||
| 2026-02-13 | 13F | Parkside Financial Bank & Trust | 55 | 10,00 | 1 | |||||
| 2026-02-17 | 13F | Lighthouse Investment Partners, LLC | 0 | -100,00 | 0 | -100,00 | ||||
| 2026-02-12 | 13F | Jane Street Group, Llc | Call | 1.382.000 | 53,49 | 15.492 | 0,68 | |||
| 2026-03-12 | 13F/A | Peak6 Llc | Call | 200 | 2 | |||||
| 2026-02-12 | 13F | Jane Street Group, Llc | 232.722 | -62,74 | 2.609 | -75,57 | ||||
| 2026-02-13 | 13F | Victory Capital Management Inc | 203.387 | -66,91 | 2.280 | -78,30 | ||||
| 2026-02-17 | 13F | Parallax Volatility Advisers, L.P. | Put | 563.000 | 245,61 | 6.311 | 126,77 | |||
| 2026-03-12 | 13F/A | Peak6 Llc | 108.358 | 1.215 | ||||||
| 2026-02-12 | 13F | Jane Street Group, Llc | Put | 744.900 | -45,67 | 8.350 | -64,36 | |||
| 2026-02-17 | 13F | Parallax Volatility Advisers, L.P. | 386.217 | 120,70 | 4.329 | 44,78 | ||||
| 2026-03-12 | 13F/A | Peak6 Llc | Put | 30.000 | 336 | |||||
| 2026-02-17 | 13F | Parallax Volatility Advisers, L.P. | Call | 981.500 | 352,51 | 11.003 | 196,87 | |||
| 2026-02-12 | 13F | New York State Common Retirement Fund | 28.400 | 0,00 | 318 | -34,43 | ||||
| 2026-02-13 | 13F | Wells Fargo & Company/mn | 477.392 | 517,58 | 5.352 | 305,07 | ||||
| 2026-02-12 | 13F | Ci Investments Inc. | 10.977 | -1,64 | 123 | |||||
| 2026-02-13 | 13F | Alkeon Capital Management Llc | 475.000 | 5.325 | ||||||
| 2026-02-17 | 13F | D. E. Shaw & Co., Inc. | Call | 140.000 | 1.569 | |||||
| 2026-02-17 | 13F | Balyasny Asset Management Llc | 39.960 | -88,49 | 448 | -92,46 | ||||
| 2026-02-12 | 13F | Great Lakes Advisors, Llc | 0 | -100,00 | 0 | |||||
| 2026-02-17 | 13F | Balyasny Asset Management Llc | Put | 319.000 | -52,98 | 3.576 | -69,17 | |||
| 2026-02-13 | 13F | Kestra Advisory Services, LLC | 3.478 | 39 | ||||||
| 2026-02-17 | 13F | Nomura Holdings Inc | Call | 0 | -100,00 | 0 | -100,00 | |||
| 2026-02-02 | 13F | Wolverine Asset Management Llc | Call | 292.500 | 3.279 | |||||
| 2026-02-10 | 13F | Daiwa Securities Group Inc. | Put | 50.000 | 1 | |||||
| 2025-11-14 | 13F | Mount Yale Investment Advisors, LLC | 0 | -100,00 | 0 | -100,00 | ||||
| 2026-02-12 | 13F | BRYN MAWR TRUST Co | 0 | -100,00 | 0 | |||||
| 2026-02-17 | 13F | Russell Investments Group, Ltd. | 49.385 | 342,24 | 554 | 191,05 | ||||
| 2026-02-10 | 13F | Daiwa Securities Group Inc. | 50.000 | 5,26 | 1 | |||||
| 2026-02-11 | 13F | Jpmorgan Chase & Co | 610.638 | 1.556,69 | 6.845 | 988,24 | ||||
| 2026-02-12 | 13F | Nuveen, LLC | 319.381 | 17,82 | 3.580 | -22,71 | ||||
| 2026-04-27 | 13F | Leonteq Securities AG | 8.336 | 72 | ||||||
| 2026-02-13 | 13F | Headlands Technologies LLC | 236.364 | 1.685,90 | 2.650 | 1.072,12 | ||||
| 2026-02-09 | 13F | Advent Capital Management /de/ | Call | 105.000 | 425,00 | 1.177 | 245,16 | |||
| 2026-02-10 | 13F | Rothschild Investment Llc | 90 | -48,57 | 1 | -50,00 | ||||
| 2026-02-11 | 13F | Highbridge Capital Management Llc | 283.500 | 0,00 | 3.178 | -34,41 | ||||
| 2026-02-17 | 13F | Paloma Partners Management Co | 24.889 | -97,16 | 279 | -98,14 | ||||
| 2025-11-14 | 13F | TENOR CAPITAL MANAGEMENT Co., L.P. | 0 | -100,00 | 0 | |||||
| 2026-02-13 | 13F | Entropy Technologies, LP | 11.195 | 125 | ||||||
| 2026-02-10 | 13F | Connor, Clark & Lunn Investment Management Ltd. | 46.893 | 215,59 | 526 | 107,51 | ||||
| 2026-02-13 | 13F | Centiva Capital, LP | 25.290 | 284 | ||||||
| 2026-02-13 | 13F | Centiva Capital, LP | Call | 450.000 | 0,00 | 5.044 | -34,41 | |||
| 2026-04-13 | 13F | Massmutual Trust Co Fsb/adv | 44 | 0 | ||||||
| 2026-02-17 | 13F | XTX Topco Ltd | 0 | -100,00 | 0 | |||||
| 2026-02-05 | 13F | Allworth Financial LP | 204 | 2 | ||||||
| 2026-02-17 | 13F | MIRAE ASSET GLOBAL ETFS HOLDINGS Ltd. | 1.184.749 | 19,05 | 13.281 | -21,90 | ||||
| 2026-02-05 | 13F | Central Asset Investments & Management Holdings (HK) Ltd | 0 | -100,00 | 0 | |||||
| 2026-02-18 | 13F | Vident Advisory, LLC | 1.186.662 | 39,26 | 13.302 | -8,65 | ||||
| 2026-02-13 | 13F | First Trust Advisors Lp | 42.768 | 6,55 | 479 | -30,07 | ||||
| 2026-02-17 | 13F | Tudor Investment Corp Et Al | Call | 10.300 | 115 | |||||
| 2026-02-17 | 13F | Sig Brokerage, Lp | 24.773 | -16,82 | 278 | -45,47 | ||||
| 2026-04-07 | 13F | Signaturefd, Llc | 1.638 | 343,90 | 14 | 250,00 | ||||
| 2026-02-03 | 13F | Mitsubishi UFJ Kokusai Asset Management Co., Ltd. | 27.427 | 47,25 | 317 | -0,63 | ||||
| 2026-02-17 | 13F | Tudor Investment Corp Et Al | Put | 102.400 | 1.148 | |||||
| 2026-02-17 | 13F | Vennlight Capital Management, LP | 91.900 | 1.030 | ||||||
| 2026-02-17 | 13F | Sig Brokerage, Lp | Put | 105.000 | 1.177 | |||||
| 2026-02-13 | 13F | Sei Investments Co | 24.795 | 59,50 | 278 | 4,53 | ||||
| 2025-11-19 | 13F | Caitong International Asset Management Co., Ltd | 0 | -100,00 | 0 | -100,00 | ||||
| 2026-01-28 | 13F | Chicago Partners Investment Group LLC | 10.019 | 146 | ||||||
| 2026-04-24 | 13F | ProShare Advisors LLC | 17.757 | -1,48 | 154 | -24,26 | ||||
| 2026-02-13 | 13F | Verition Fund Management LLC | 149.837 | 121,45 | 1.680 | 45,24 | ||||
| 2026-02-17 | 13F | Paloma Partners Management Co | Call | 3.093.500 | 145,48 | 34.678 | 61,02 | |||
| 2026-02-17 | 13F | California State Teachers Retirement System | 111.893 | 9,27 | 1.254 | -28,34 | ||||
| 2026-04-22 | 13F | Pictet Asset Management Holding SA | 27.837 | -50,07 | 241 | -61,54 | ||||
| 2026-02-17 | 13F/A | BlueCrest Capital Management Ltd | 56.700 | 969 | ||||||
| 2026-04-15 | 13F | FNY Investment Advisers, LLC | 0 | -100,00 | 0 | |||||
| 2025-11-14 | 13F | Cubist Systematic Strategies, LLC | 97.651 | 1.669 | ||||||
| 2026-02-17 | 13F | PDT Partners, LLC | 66.920 | 750 | ||||||
| 2026-02-09 | 13F | Geode Capital Management, Llc | 1.698.818 | 10,52 | 19.042 | -27,51 | ||||
| 2025-11-14 | 13F | Cubist Systematic Strategies, LLC | Put | 13.800 | 236 | |||||
| 2026-02-17 | 13F | CastleKnight Management LP | Call | 0 | -100,00 | 0 | -100,00 | |||
| 2026-02-10 | 13F | Bnp Paribas Arbitrage, Sa | 20.242 | -93,07 | 227 | -95,47 | ||||
| 2026-02-17 | 13F | Capital Fund Management S.a. | 404.574 | -28,66 | 4.535 | -53,20 | ||||
| 2026-02-04 | 13F | Atlantic Union Bankshares Corp | 2 | 0,00 | 0 | |||||
| 2026-02-10 | 13F | Quantbot Technologies LP | 0 | -100,00 | 0 | |||||
| 2026-02-17 | 13F | Susquehanna Portfolio Strategies, LLC | 0 | -100,00 | 0 | -100,00 | ||||
| 2026-02-17 | 13F | Shaolin Capital Management LLC | Put | 500.000 | 5.605 | |||||
| 2026-02-13 | 13F | Ubs Asset Management Americas Inc | 131.810 | 2,41 | 1.478 | -32,83 | ||||
| 2026-02-17 | 13F | Graham Capital Management, L.P. | Put | 0 | -100,00 | 0 | -100,00 | |||
| 2026-02-10 | 13F | Bank of New York Mellon Corp | 259.372 | 1,69 | 2.908 | -33,31 | ||||
| 2026-02-17 | 13F | Public Employees Retirement System Of Ohio | 23.900 | 14,90 | 268 | -24,79 | ||||
| 2026-02-10 | 13F | Skaana Management L.P. | Call | 0 | -100,00 | 0 | ||||
| 2026-02-17 | 13F | Aquatic Capital Management LLC | 0 | -100,00 | 0 | |||||
| 2026-04-15 | 13F | FNY Investment Advisers, LLC | Call | 0 | -100,00 | 0 | ||||
| 2026-02-11 | 13F | Capital Research Global Investors | 536.037 | 6.009 | ||||||
| 2026-04-16 | 13F | SG Americas Securities, LLC | 361.255 | 130,50 | 3 | 200,00 | ||||
| 2026-01-30 | 13F | Wealth High Governance Capital Ltda | 0 | -100,00 | 0 | -100,00 | ||||
| 2026-02-10 | 13F | State of Wyoming | 1.502 | 17 | ||||||
| 2026-02-11 | 13F | BIT Capital GmbH | Call | 0 | -100,00 | 0 | -100,00 | |||
| 2025-11-12 | 13F | HAP Trading, LLC | 101.849 | 1.741 | ||||||
| 2026-02-12 | 13F | MetLife Investment Management, LLC | 54.396 | 0,00 | 610 | -34,45 | ||||
| 2026-02-13 | 13F | State Street Corp | 3.144.782 | 34,12 | 35.253 | -12,03 | ||||
| 2026-02-17 | 13F | Algert Global Llc | 12.493 | 0 | ||||||
| 2026-02-13 | 13F | Charles Schwab Investment Management Inc | 1.603.601 | 49,63 | 17.976 | -1,85 | ||||
| 2026-02-17 | 13F | Shaolin Capital Management LLC | 823.500 | -0,00 | 9.231 | -34,41 | ||||
| 2026-02-09 | 13F | Advent Capital Management /de/ | Put | 0 | -100,00 | 0 | -100,00 | |||
| 2026-02-17 | 13F | Northern Trust Corp | 639.277 | -0,38 | 7.166 | -34,66 | ||||
| 2026-02-13 | 13F | Walleye Trading LLC | Put | 176.300 | 2,38 | 1.976 | -32,83 | |||
| 2026-02-13 | 13F | Walleye Trading LLC | Call | 254.500 | 37,72 | 2.853 | -9,69 | |||
| 2026-02-11 | 13F | Los Angeles Capital Management Llc | 26.704 | 602 | ||||||
| 2026-03-23 | 13F | Galaxy Digital Capital Management GP LLC | Put | 0 | -100,00 | 0 | ||||
| 2026-02-11 | 13F | Deutsche Bank Ag\ | 102.462 | 7,18 | 1.149 | -29,70 | ||||
| 2026-02-12 | 13F | BlackRock, Inc. | 7.966.888 | 16,11 | 89.309 | -23,84 | ||||
| 2026-02-13 | 13F | Natixis | 460 | 5 | ||||||
| 2026-02-17 | 13F | DZ BANK AG Deutsche Zentral Genossenschafts Bank, Frankfurt am Main | 162.522 | -11,27 | 1.822 | -41,82 | ||||
| 2026-02-17 | 13F | J. Goldman & Co LP | 0 | -100,00 | 0 | |||||
| 2026-02-11 | 13F | Situational Awareness LP | 1.788.000 | 92,34 | 20.043 | 26,17 | ||||
| 2026-02-11 | 13F | BIT Capital GmbH | 154.278 | -51,31 | 1.729 | -68,06 | ||||
| 2026-02-13 | 13F | Barclays Plc | Call | 0 | -100,00 | 0 | -100,00 | |||
| 2026-02-13 | 13F | Barclays Plc | Put | 87.000 | -42,00 | 975 | -61,96 | |||
| 2026-02-13 | 13F | Barclays Plc | 8.999.624 | 66,92 | 100.886 | 9,49 | ||||
| 2026-02-17 | 13F | Tudor Investment Corp Et Al | 0 | -100,00 | 0 | -100,00 | ||||
| 2026-02-12 | 13F | Voya Investment Management Llc | 497.480 | 287,65 | 5.577 | 154,26 | ||||
| 2026-02-17 | 13F | Clear Street Markets Llc | 26.000 | -18,75 | 291 | -46,70 | ||||
| 2026-02-10 | 13F | BW Gestao de Investimentos Ltda. | 0 | -100,00 | 0 | |||||
| 2026-01-27 | 13F | Zurcher Kantonalbank (Zurich Cantonalbank) | 21.263 | 0,00 | 238 | -34,44 | ||||
| 2026-02-13 | 13F | Smartleaf Asset Management LLC | 164 | 2 | ||||||
| 2025-11-12 | 13F | Accredited Wealth Management, LLC | 160 | -20,00 | 3 | 50,00 | ||||
| 2026-02-17 | 13F | Capital Fund Management S.a. | Call | 0 | -100,00 | 0 | ||||
| 2026-01-26 | 13F | Cwm, Llc | 1.068 | 5,22 | 0 | |||||
| 2026-02-11 | 13F | Empowered Funds, LLC | 3.076 | 34 | ||||||
| 2026-02-13 | 13F | Pinnacle Wealth Planning Services, Inc. | 579 | 6 | ||||||
| 2026-02-17 | 13F | Millennium Management Llc | 33.211 | -95,50 | 372 | -97,05 | ||||
| 2026-02-17 | 13F | Millennium Management Llc | Put | 400.000 | -60,00 | 4.484 | -73,76 | |||
| 2026-02-17 | 13F | Millennium Management Llc | Call | 400.000 | -50,00 | 4.484 | -67,20 | |||
| 2026-02-17 | 13F | Css Llc/il | Put | 20.200 | 0,00 | 226 | -34,49 | |||
| 2026-02-11 | 13F | Two Seas Capital LP | 0 | -100,00 | 0 | |||||
| 2026-02-11 | 13F | Parallel Advisors, LLC | 316 | -35,90 | 4 | -62,50 | ||||
| 2026-02-12 | 13F | Quadrant Capital Group Llc | 143 | 2 | ||||||
| 2026-02-13 | 13F | Squarepoint Ops LLC | Call | 55.700 | 624 | |||||
| 2026-02-13 | 13F | Squarepoint Ops LLC | Put | 28.300 | 317 | |||||
| 2026-02-13 | 13F | Blueshift Asset Management, LLC | 10.007 | 112 | ||||||
| 2026-01-29 | 13F | UBS Group AG | 2.246.381 | 2,41 | 25.182 | -32,83 | ||||
| 2026-02-13 | 13F | Tairen Capital Ltd | 0 | -100,00 | 0 | -100,00 | ||||
| 2026-02-17 | 13F | Nomura Holdings Inc | 249.023 | 231,69 | 2.792 | 117,54 | ||||
| 2026-02-17 | 13F | Quantinno Capital Management LP | 0 | -100,00 | 0 | |||||
| 2025-11-14 | 13F | Point72 Asia (Singapore) Pte. Ltd. | 258.391 | 5.581,42 | 4.416 | 8.390,38 | ||||
| 2025-11-14 | 13F | Point72 Hong Kong Ltd | 1.444.150 | 24.681 | ||||||
| 2026-04-20 | 13F | Ronald Blue Trust, Inc. | 83 | 1 | ||||||
| 2026-01-29 | 13F | IMC-Chicago, LLC | 181.291 | 48,82 | 2.032 | -2,35 | ||||
| 2026-02-09 | 13F | Legal & General Group Plc | 68.674 | 1,06 | 770 | -33,76 | ||||
| 2026-02-17 | 13F | Point72 Asset Management, L.P. | Call | 14.800 | 166 | |||||
| 2025-11-13 | 13F | Aurelius Capital Management, LP | 169.825 | -25,66 | 2.902 | 10,68 | ||||
| 2026-02-17 | 13F | Point72 Asset Management, L.P. | 1.841.367 | 94,51 | 20.642 | 27,59 | ||||
| 2026-02-11 | 13F | Franklin Resources Inc | 15.436 | 173 | ||||||
| 2026-02-17 | 13F | Point72 Asset Management, L.P. | Put | 43.700 | 490 | |||||
| 2026-04-28 | 13F | SBI Securities Co., Ltd. | 2.214 | -14,94 | 19 | -34,48 | ||||
| 2026-02-10 | 13F | Goldman Sachs Group Inc | 1.258.924 | 65,03 | 14.113 | 8,25 | ||||
| 2026-04-06 | 13F | GAMMA Investing LLC | 1.574 | 66,38 | 14 | 30,00 | ||||
| 2026-02-10 | 13F | Goldman Sachs Group Inc | Put | 150.000 | 1.682 | |||||
| 2026-02-02 | 13F | Wolverine Asset Management Llc | 216.670 | 2.429 | ||||||
| 2026-02-17 | 13F | Cape Investment Advisory, Inc. | 500 | 6 | ||||||
| 2026-02-17 | 13F | Tower Research Capital LLC (TRC) | 1.884 | -36,20 | 21 | -58,00 | ||||
| 2025-11-06 | 13F | Ameritas Advisory Services, LLC | 0 | -100,00 | 0 | |||||
| 2026-02-13 | 13F | Bank Of Nova Scotia | 718.573 | 8.057 | ||||||
| 2026-02-13 | 13F | Bank Of Nova Scotia | Put | 2.000 | 22 | |||||
| 2026-02-17 | 13F | Value Aligned Research Advisors, LLC | 3.267.614 | 136,99 | 36.630 | 55,45 | ||||
| 2026-02-14 | 13F | Rockefeller Capital Management L.P. | 324 | 4 | ||||||
| 2026-02-17 | 13F | Azora Capital LP | 782.038 | -43,88 | 8.767 | -63,19 | ||||
| 2026-02-17 | 13F | Schonfeld Strategic Advisors LLC | 82.694 | -83,40 | 927 | -89,12 | ||||
| 2026-02-17 | 13F | Caption Management, LLC | Call | 319.500 | 33,12 | 3.582 | -12,68 | |||
| 2026-02-17 | 13F | Caption Management, LLC | 170.000 | -33,70 | 1.906 | -56,53 | ||||
| 2026-02-17 | 13F | Caption Management, LLC | Put | 400.000 | -6,98 | 4.484 | -38,98 | |||
| 2026-04-06 | 13F | Versant Capital Management, Inc | 0 | -100,00 | 0 | -100,00 | ||||
| 2026-02-06 | 13F | Larson Financial Group LLC | 26 | 0 | ||||||
| 2026-02-13 | 13F | IDG China Venture Capital Fund IV Associates L.P. | 91.308 | 0,00 | 1.024 | -34,42 | ||||
| 2026-04-22 | 13F | Fund Resources Investment Holding Group Co Ltd | 9.440.418 | 3,01 | 81.660 | -20,51 | ||||
| 2026-02-05 | 13F | Phoenix Holdings Ltd. | 20.238 | 227 | ||||||
| 2026-02-13 | 13F | Marshall Wace, Llp | 425.578 | 4.771 | ||||||
| 2026-01-29 | 13F | Vanguard Group Inc | 824.073 | 19,11 | 9.238 | -21,88 | ||||
| 2026-02-13 | 13F | Toroso Investments, LLC | Call | 321.700 | -44,83 | 3.606 | -63,81 | |||
| 2026-02-13 | 13F | Neuberger Berman Group LLC | 0 | -100,00 | 0 | |||||
| 2026-02-13 | 13F | Toroso Investments, LLC | 735.882 | -23,38 | 8.249 | -49,74 | ||||
| 2026-02-13 | 13F | Rhumbline Advisers | 112.538 | -10,56 | 1.262 | -41,35 | ||||
| 2026-04-22 | 13F | Sterling Capital Management LLC | 795 | 25,20 | 7 | -14,29 | ||||
| 2026-02-17 | 13F | Alliancebernstein L.p. | 104.787 | 0,00 | 1.175 | -34,41 | ||||
| 2026-04-08 | 13F | E Fund Management (Hong Kong) Co., Ltd. | 502 | 4 | ||||||
| 2026-02-26 | 13F/A | Sculptor Capital LP | 0 | -100,00 | 0 | -100,00 | ||||
| 2026-02-13 | 13F | Van Eck Associates Corp | 1.694.193 | 100,09 | 19 | 28,57 | ||||
| 2026-02-17 | 13F | Jump Financial, LLC | 0 | -100,00 | 0 | |||||
| 2026-04-28 | 13F | Handelsbanken Fonder AB | 23.400 | 0,00 | 0 | |||||
| 2026-01-28 | 13F | Klp Kapitalforvaltning As | 21.100 | 0,00 | 237 | -34,44 | ||||
| 2026-02-13 | 13F | Police & Firemen's Retirement System of New Jersey | 64.681 | 16,63 | 725 | -23,44 | ||||
| 2026-02-05 | 13F | Amalgamated Bank | 3.098 | 1,04 | 0 | |||||
| 2026-02-17 | 13F | Scientech Research LLC | 28.894 | 34,96 | 324 | -11,51 | ||||
| 2026-02-13 | 13F | Morgan Stanley | 912.096 | 107,30 | 10.225 | 35,98 | ||||
| 2026-02-19 | 13F | Invesco Ltd. | 71.930 | 3,75 | 806 | -31,93 | ||||
| 2026-02-13 | 13F | Public Employees Retirement Association Of Colorado | 25.200 | -2,33 | 0 | |||||
| 2026-01-13 | 13F | Stonehage Fleming Financial Services Holdings Ltd | 1.229 | 14 |
Other Listings
| US:BTDR | 11,30 $ |