Grundlæggende statistik
| Institutionelle aktier (lange) | 35.666.011 - 73,61% (ex 13D/G) - change of 0,20MM shares 0,57% MRQ |
| Institutionel værdi (lang) | $ 273.861 USD ($1000) |
Institutionelt ejerskab og aktionærer
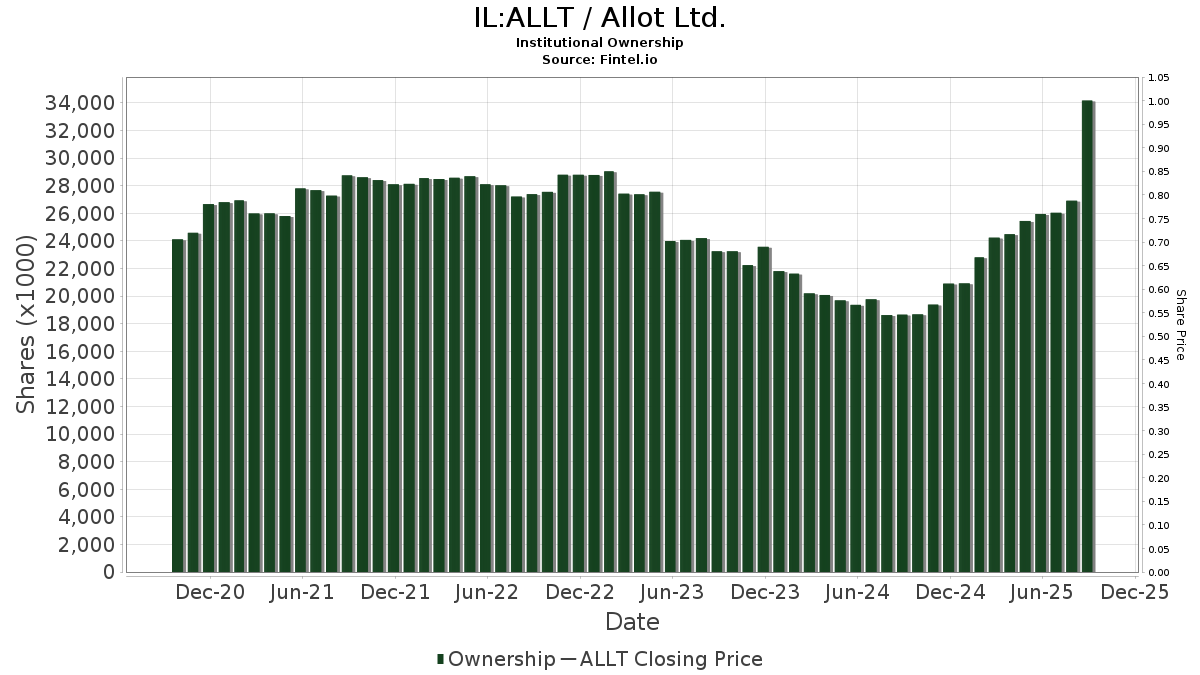
Allot Ltd. (IL:ALLT) har 115 institutionelle ejere og aktionærer, der har indsendt 13D/G- eller 13F-formularer til Securities Exchange Commission (SEC). Disse institutioner har i alt 35,666,011 aktier. Største aktionærer omfatter Lynrock Lake LP, QVT Financial LP, Kanen Wealth Management LLC, Clal Insurance Enterprises Holdings Ltd, Acadian Asset Management Llc, Renaissance Technologies Llc, G2 Investment Partners Management LLC, Greenhaven Road Investment Management, L.P., P.a.w. Capital Corp, and Morgan Stanley .
Allot Ltd. (TASE:ALLT) institutionel ejerskabsstruktur viser aktuelle positioner i virksomheden efter institutioner og fonde, samt seneste ændringer i positionsstørrelse. Større aktionærer kan omfatte individuelle investorer, investeringsforeninger, hedgefonde eller institutioner. Skema 13D angiver, at investoren besidder (eller besidder) mere end 5 % af virksomheden og har til hensigt (eller har til hensigt at) aktivt at forfølge en ændring i forretningsstrategi. Skema 13G indikerer en passiv investering på over 5%.
Fondens stemningsscore
Fund Sentiment Score (fka Ownership Accumulation Score) finder de aktier, der bliver mest købt af fonde. Det er resultatet af en sofistikeret, multi-faktor kvantitativ model, der identificerer virksomheder med de højeste niveauer af institutionel akkumulering. Scoringsmodellen bruger en kombination af den samlede stigning i oplyste ejere, ændringerne i porteføljeallokeringer i disse ejere og andre målinger. Tallet går fra 0 til 100, hvor højere tal indikerer et højere niveau af akkumulering for sine jævnaldrende, og 50 er gennemsnittet.
Opdateringsfrekvens: Dagligt
Se Ownership Explorer, som giver en liste over højest rangerende virksomheder.
AI+ Ask Fintel’s AI assistant about Allot Ltd..
Select a question to share a public post with an AI-crafted answer.
Thinking of good questions…
13F og NPORT arkivering
Detaljer om 13F-arkivering er gratis. Detaljer om NP-ansøgninger kræver et premium-medlemskab. Grønne rækker angiver nye positioner. Røde rækker angiver lukkede positioner. Klik på linket ikon for at se den fulde transaktionshistorik.
Opgrader
for at låse premium-data op og eksportere til Excel ![]() .
.
| Fil dato | Kilde | Investor | Type | Gennemsnitlig pris (Øst) |
Aktier | Δ Aktier (%) |
Rapporteret Værdi ($1000) |
Δ Værdi (%) |
Port Alloc (%) |
|
|---|---|---|---|---|---|---|---|---|---|---|
| 2025-11-14 | 13F | Federation des caisses Desjardins du Quebec | 0 | -100,00 | 0 | |||||
| 2026-02-17 | 13F | Magnetar Financial LLC | 63.278 | 182,44 | 622 | 162,45 | ||||
| 2026-02-09 | 13F | Blue Bell Private Wealth Management, Llc | 0 | -100,00 | 0 | |||||
| 2026-01-16 | 13F | FNY Investment Advisers, LLC | 16.146 | 53,77 | 0 | |||||
| 2025-09-25 | NP | DFAI - Dimensional International Core Equity Market ETF | 3.092 | 0,00 | 24 | 41,18 | ||||
| 2025-09-25 | NP | DFIEX - International Core Equity Portfolio - Institutional Class This fund is a listed as child fund of Dimensional Fund Advisors Lp and if that institution has disclosed ownership in this security, then these positions will not be double counted when calculating total shares and total value | 48.893 | 0,00 | 382 | 32,29 | ||||
| 2026-02-17 | 13F | PharVision Advisers, LLC | 35.604 | 76,37 | 350 | 63,85 | ||||
| 2026-02-17 | 13F | Susquehanna International Group, Llp | 263.539 | -48,47 | 2.591 | -52,13 | ||||
| 2026-02-17 | 13F | Susquehanna International Group, Llp | Call | 39.800 | -61,77 | 391 | -64,49 | |||
| 2026-01-23 | 13F | Farther Finance Advisors, LLC | 76 | 1 | ||||||
| 2026-01-27 | 13F | Acuitas Investments, LLC | 0 | -100,00 | 0 | |||||
| 2026-02-18 | 13F | Kanen Wealth Management LLC | 4.602.668 | -0,07 | 45 | -99,91 | ||||
| 2026-02-13 | 13F | Squarepoint Ops LLC | 54.094 | 151,68 | 532 | 133,92 | ||||
| 2025-09-25 | NP | Dfa Investment Trust Co - The Continental Small Company Series This fund is a listed as child fund of Dimensional Fund Advisors Lp and if that institution has disclosed ownership in this security, then these positions will not be double counted when calculating total shares and total value | 171.830 | 0,00 | 1.342 | 32,22 | ||||
| 2025-09-24 | NP | BlackRock ETF Trust - iShares Defense Industrials Active ETF | 2.157 | 17 | ||||||
| 2026-02-12 | 13F | Jane Street Group, Llc | Call | 0 | -100,00 | 0 | -100,00 | |||
| 2026-01-30 | 13F | State of New Jersey Common Pension Fund D | 23.014 | 226 | ||||||
| 2026-01-07 | 13F | Massmutual Trust Co Fsb/adv | 2.155 | 21 | ||||||
| 2025-11-14 | 13F | Ghisallo Capital Management LLC | 0 | -100,00 | 0 | -100,00 | ||||
| 2025-09-25 | NP | Dfa Investment Dimensions Group Inc - Va International Small Portfolio This fund is a listed as child fund of Dimensional Fund Advisors Lp and if that institution has disclosed ownership in this security, then these positions will not be double counted when calculating total shares and total value | 4.540 | 0,00 | 35 | 34,62 | ||||
| 2026-02-11 | 13F | Group One Trading, L.p. | Call | 12.200 | -57,93 | 120 | -61,11 | |||
| 2026-02-11 | 13F | Group One Trading, L.p. | Put | 5.000 | -97,70 | 49 | -97,87 | |||
| 2026-02-13 | 13F | QVT Financial LP | 5.062.523 | 12,36 | 49.765 | 4,39 | ||||
| 2026-02-11 | 13F | Group One Trading, L.p. | 7.362 | -93,20 | 72 | -93,71 | ||||
| 2026-02-17 | 13F | Point72 Asset Management, L.P. | 93.194 | 916 | ||||||
| 2026-02-12 | 13F | Jane Street Group, Llc | 298.521 | 18,83 | 2.934 | 10,43 | ||||
| 2026-02-13 | 13F | Citigroup Inc | 71.437 | -1,78 | 702 | -8,71 | ||||
| 2026-01-20 | 13F | Signaturefd, Llc | 536 | -58,58 | 5 | -61,54 | ||||
| 2025-11-14 | 13F | OMERS ADMINISTRATION Corp | 0 | -100,00 | 0 | |||||
| 2026-02-12 | 13F | New York State Common Retirement Fund | 20.750 | 204 | ||||||
| 2026-02-17 | 13F | Russell Investments Group, Ltd. | 104.120 | 27,37 | 1.023 | 18,40 | ||||
| 2026-02-17 | 13F | Windward Management LP | Call | 300.200 | 2.951 | |||||
| 2026-02-17 | 13F | Windward Management LP | 216.333 | 2.127 | ||||||
| 2026-02-13 | 13F | Sei Investments Co | 61.987 | 609 | ||||||
| 2026-02-17 | 13F | G2 Investment Partners Management LLC | 1.040.000 | -25,71 | 10.223 | -30,97 | ||||
| 2025-09-25 | NP | DFA INVESTMENT DIMENSIONS GROUP INC - World ex U.S. Core Equity Portfolio Institutional Class Shares | 4.114 | 0,00 | 32 | 33,33 | ||||
| 2025-11-14 | 13F | Point72 Europe (London) LLP | 60 | 1 | ||||||
| 2025-10-15 | 13F | Cwm, Llc | 0 | -100,00 | 0 | |||||
| 2026-02-06 | 13F | Gsa Capital Partners Llp | 16.114 | 0 | ||||||
| 2026-02-17 | 13F | Quadrature Capital Ltd | 13.481 | 133 | ||||||
| 2026-02-13 | 13F | Caitong International Asset Management Co., Ltd | 1.182 | 12 | ||||||
| 2026-02-05 | 13F | Allworth Financial LP | 519 | 21,83 | 5 | 25,00 | ||||
| 2026-02-10 | 13F | Acadian Asset Management Llc | 1.374.235 | 74,49 | 13 | 62,50 | ||||
| 2026-02-17 | 13F | Engineers Gate Manager LP | 35.828 | -9,09 | 352 | -15,38 | ||||
| 2026-02-12 | 13F | Quadrant Capital Group Llc | 1.539 | 17,84 | 15 | 15,38 | ||||
| 2025-11-14 | 13F | Tower Research Capital LLC (TRC) | 0 | -100,00 | 0 | |||||
| 2026-02-17 | 13F | Royal Bank Of Canada | 188 | -70,85 | 2 | -71,43 | ||||
| 2026-02-17 | 13F | Caption Management, LLC | Put | 0 | -100,00 | 0 | ||||
| 2025-09-25 | NP | DFIS - Dimensional International Small Cap ETF | 14.156 | 0,00 | 111 | 34,15 | ||||
| 2026-02-10 | 13F | State of Wyoming | 6.723 | 66 | ||||||
| 2025-09-23 | NP | IZRL - ARK Israel Innovative Technology ETF | 230.548 | -18,21 | 1.802 | 10,02 | ||||
| 2026-02-10 | 13F | Quantbot Technologies LP | 6.871 | 68 | ||||||
| 2026-02-17 | 13F | Susquehanna Portfolio Strategies, LLC | 18.753 | -28,57 | 184 | -33,57 | ||||
| 2026-02-17 | 13F | Caption Management, LLC | Call | 0 | -100,00 | 0 | ||||
| 2026-02-13 | 13F | Barclays Plc | 657 | 0,00 | 6 | 0,00 | ||||
| 2026-02-17 | 13F | Graham Capital Management, L.P. | 18.157 | 178 | ||||||
| 2026-02-19 | 13F | Invesco Ltd. | 11.351 | 112 | ||||||
| 2025-11-14 | 13F | Wolverine Trading, Llc | 39.885 | 53,14 | 390 | 87,50 | ||||
| 2025-11-14 | 13F | Wolverine Trading, Llc | Call | 22.000 | 215 | |||||
| 2026-02-05 | 13F | Yelin Lapidot Holdings Management Ltd. | 225.943 | 0,00 | 2.221 | -7,07 | ||||
| 2025-11-14 | 13F | Wolverine Trading, Llc | Put | 76.600 | 1,32 | 750 | 24,01 | |||
| 2026-02-13 | 13F | MYDA Advisors LLC | 0 | -100,00 | 0 | |||||
| 2026-02-13 | 13F | Toroso Investments, LLC | 35.129 | 345 | ||||||
| 2026-02-17 | 13F | Advisory Services Network, LLC | 0 | -100,00 | 0 | |||||
| 2026-02-11 | 13F | Gwn Securities Inc. | 34.871 | 81,23 | 343 | 68,47 | ||||
| 2026-02-17 | 13F | Boothbay Fund Management, Llc | 316.566 | -10,26 | 3.112 | -16,64 | ||||
| 2026-02-13 | 13F | Kestra Advisory Services, LLC | 6.309 | 62 | ||||||
| 2026-02-12 | 13F | Cloud Capital Management, LLC | 76.553 | 0,74 | 1 | |||||
| 2026-02-13 | 13F | Quarry LP | 2.627 | -24,27 | 26 | -30,56 | ||||
| 2026-02-17 | 13F | Jones Financial Companies Lllp | 300 | 0,00 | 3 | 0,00 | ||||
| 2025-09-25 | NP | DFIC - Dimensional International Core Equity 2 ETF | 2.852 | 0,00 | 22 | 37,50 | ||||
| 2026-02-11 | 13F | Jpmorgan Chase & Co | 133.252 | -52,66 | 1.310 | -56,04 | ||||
| 2026-02-17 | 13F | Pinnacle Financial Partners, Inc. | 14.000 | 138 | ||||||
| 2026-02-17 | 13F | XTX Topco Ltd | 34.536 | 8,54 | 339 | 0,89 | ||||
| 2026-02-12 | 13F | BlackRock, Inc. | 455.108 | 446,44 | 4.474 | 407,72 | ||||
| 2026-02-17 | 13F | Sig Brokerage, Lp | 10.070 | -32,29 | 99 | -37,58 | ||||
| 2025-11-14 | 13F | Prosperity Wealth Management, Inc. | 26.400 | -25,21 | 279 | -7,31 | ||||
| 2025-11-13 | 13F/A | Peak6 Llc | 0 | -100,00 | 0 | |||||
| 2026-02-13 | 13F | Verition Fund Management LLC | 50.005 | 24,67 | 492 | 15,80 | ||||
| 2025-09-29 | NP | CTSIX - Calamos Timpani Small Cap Growth Fund Class I | 277.070 | 2.145 | ||||||
| 2025-11-14 | 13F | Hbk Investments L P | 0 | -100,00 | 0 | |||||
| 2026-02-17 | 13F | Lynrock Lake LP | 10.011.295 | 0,00 | 98.411 | -7,09 | ||||
| 2026-02-17 | 13F | Advisor Group Holdings, Inc. | 35.557 | 24,83 | 350 | 25,99 | ||||
| 2025-11-07 | 13F | Synovus Financial Corp | 15.000 | -3,23 | 159 | 19,70 | ||||
| 2025-11-14 | 13F | Virtu Financial LLC | 0 | -100,00 | 0 | |||||
| 2026-02-12 | 13F | Hrt Financial Lp | 0 | -100,00 | 0 | |||||
| 2026-02-12 | 13F | Renaissance Technologies Llc | 1.119.939 | 10,53 | 11.009 | 2,71 | ||||
| 2026-01-29 | 13F | UBS Group AG | 127.106 | -15,48 | 1.249 | -21,50 | ||||
| 2026-02-17 | 13F | Northern Trust Corp | 243.260 | 15,45 | 2.391 | 7,27 | ||||
| 2026-02-10 | 13F | Meitav Dash Investments Ltd | 0 | -100,00 | 0 | |||||
| 2026-02-17 | 13F | Trexquant Investment LP | 259.325 | 10,53 | 2.549 | 2,70 | ||||
| 2026-02-18 | 13F | GWM Advisors LLC | 0 | -100,00 | 0 | |||||
| 2026-02-12 | 13F | Raiffeisen Bank International AG | 300.000 | 0,00 | 2.922 | -0,51 | ||||
| 2026-02-17 | 13F | Citadel Advisors Llc | 516.048 | 6,58 | 5.073 | -0,98 | ||||
| 2026-01-22 | 13F | Pinnacle Bancorp, Inc. | 528 | 0,00 | 5 | 0,00 | ||||
| 2026-02-17 | 13F/A | RBF Capital, LLC | 10.360 | 0,00 | 102 | -7,34 | ||||
| 2026-02-17 | 13F | Two Sigma Investments, Lp | 38.992 | -56,01 | 383 | -59,12 | ||||
| 2026-02-17 | 13F | Citadel Advisors Llc | Call | 18.100 | -71,67 | 178 | -73,82 | |||
| 2026-02-13 | 13F | Morgan Stanley | 603.888 | 47,86 | 5.936 | 37,38 | ||||
| 2026-02-17 | 13F | Caption Management, LLC | 95.394 | 7,83 | 938 | 0,21 | ||||
| 2026-02-10 | 13F/A | Northwestern Mutual Wealth Management Co | 21 | 0 | ||||||
| 2026-02-11 | 13F | LPL Financial LLC | 50.087 | 51,19 | 492 | 40,57 | ||||
| 2025-11-17 | 13F | Alyeska Investment Group, L.P. | 0 | -100,00 | 0 | -100,00 | ||||
| 2025-11-20 | 13F | Maven Securities LTD | 0 | -100,00 | 0 | |||||
| 2026-02-10 | 13F | Commonwealth Of Pennsylvania Public School Empls Retrmt Sys | 15.023 | 148 | ||||||
| 2026-02-03 | 13F | SBI Securities Co., Ltd. | 54 | -16,92 | 1 | |||||
| 2026-02-10 | 13F | Catalyst Capital Advisors LLC | 9.700 | 0,00 | 95 | -6,86 | ||||
| 2026-01-12 | 13F | Silverberg Bernstein Capital Management LLC | 165.428 | 2,67 | 1.626 | -4,58 | ||||
| 2025-09-25 | NP | DFA INVESTMENT DIMENSIONS GROUP INC - International Sustainability Core 1 Portfolio Shares | 5.136 | 0,00 | 40 | 33,33 | ||||
| 2026-02-11 | 13F | Fox Run Management, L.l.c. | 45.819 | 67,87 | 450 | 56,25 | ||||
| 2026-02-13 | 13F | Y-Intercept (Hong Kong) Ltd | 0 | -100,00 | 0 | |||||
| 2025-09-26 | NP | REBYX - U.S. Small Cap Equity Fund Class Y | 19.875 | -80,59 | 154 | -42,91 | ||||
| 2026-02-06 | 13F | Global Retirement Partners, LLC | 1.928 | 0,00 | 19 | -10,00 | ||||
| 2026-02-12 | 13F | EAM Global Investors LLC | 11.311 | -9,78 | 111 | -15,91 | ||||
| 2026-02-13 | 13F | AWM Investment Company, Inc. | 498.700 | 0,00 | 4.902 | -7,09 | ||||
| 2026-02-11 | 13F | Simplex Trading, Llc | Put | 400 | -98,25 | 4 | ||||
| 2026-02-11 | 13F | Simplex Trading, Llc | 1.937 | -93,12 | 19 | |||||
| 2026-02-11 | 13F | Simplex Trading, Llc | Call | 9.600 | -73,84 | 94 | ||||
| 2026-02-17 | 13F | Two Sigma Advisers, Lp | 27.300 | -57,01 | 268 | -60,06 | ||||
| 2025-09-23 | NP | NTKLX - Voya Multi-Manager International Small Cap Fund Class A | 6.008 | 10,02 | 47 | -30,30 | ||||
| 2026-02-10 | 13F | Goldman Sachs Group Inc | 434.824 | -10,47 | 4.274 | -16,82 | ||||
| 2026-02-13 | 13F | National Bank Of Canada /fi/ | 5.734 | 56 | ||||||
| 2025-11-18 | 13F/A | Heights Capital Management, Inc | 0 | -100,00 | 0 | -100,00 | ||||
| 2026-02-11 | 13F | Parallel Advisors, LLC | 328 | 69,07 | 3 | 50,00 | ||||
| 2026-02-17 | 13F | Millennium Management Llc | 425.335 | -43,54 | 4.181 | -47,54 | ||||
| 2025-11-14 | 13F | Cubist Systematic Strategies, LLC | 166.823 | 13,43 | 1.765 | 40,33 | ||||
| 2026-02-10 | 13F | P.a.w. Capital Corp | 630.000 | -16,00 | 6.193 | -21,97 | ||||
| 2026-02-09 | 13F | Geode Capital Management, Llc | 25.818 | 0,00 | 254 | -7,33 | ||||
| 2026-02-17 | 13F | Susquehanna International Group, Llp | Put | 0 | -100,00 | 0 | ||||
| 2026-01-14 | 13F | Hennion & Walsh Asset Management, Inc. | 55.829 | 549 | ||||||
| 2026-02-17 | 13F | Bank Of America Corp /de/ | 80.837 | -21,45 | 795 | -27,02 | ||||
| 2025-10-27 | 13F | Stone House Investment Management, LLC | 0 | -100,00 | 0 | |||||
| 2026-02-13 | 13F | Fifth Lane Capital, Lp | 0 | -100,00 | 0 | |||||
| 2026-02-13 | 13F | Clal Insurance Enterprises Holdings Ltd | 1.564.990 | 0,00 | 15 | -6,25 | ||||
| 2026-02-17 | 13F | Qube Research & Technologies Ltd | 292.736 | 14,99 | 2.878 | 6,83 | ||||
| 2026-02-06 | 13F | Advisory Alpha, LLC | 15.530 | 153 | ||||||
| 2026-02-13 | 13F | Greenhaven Road Investment Management, L.P. | 856.991 | 12,81 | 8.424 | 4,82 | ||||
| 2026-02-13 | 13F | Walleye Capital LLC | 18.873 | 186 | ||||||
| 2026-02-13 | 13F | Wells Fargo & Company/mn | 9.000 | 200,00 | 88 | 183,87 | ||||
| 2026-02-17 | 13F | Worth Venture Partners, LLC | 0 | -100,00 | 0 | |||||
| 2026-02-17 | 13F | Citadel Advisors Llc | Put | 0 | -100,00 | 0 | -100,00 | |||
| 2025-09-26 | NP | PCSGX - PACE Small/Medium Co Growth Equity Investments Class P | 31.893 | 247 | ||||||
| 2026-02-11 | 13F | DCF Advisers, LLC | 72.000 | 708 | ||||||
| 2026-02-11 | 13F | ARK Investment Management LLC | 202.178 | -10,72 | 1.991 | -15,10 | ||||
| 2026-02-11 | 13F | Potomac Capital Management, Inc. | 354.288 | -64,08 | 3.483 | 114,01 | ||||
| 2026-02-13 | 13F | State Street Corp | 127.352 | 376,97 | 1.252 | 343,62 | ||||
| 2026-01-30 | 13F | Us Bancorp \de\ | 70.067 | 2,48 | 689 | -4,84 | ||||
| 2026-02-12 | 13F | Riverwater Partners LLC | 168.689 | 1.658 | ||||||
| 2026-01-29 | 13F | Calamos Advisors LLC | 44.719 | 46,51 | 440 | 36,34 | ||||
| 2025-11-14 | 13F | Jane Street Group, Llc | Put | 0 | -100,00 | 0 | -100,00 | |||
| 2026-01-15 | 13F | LeConte Wealth Management, LLC | 12.357 | 1,86 | 121 | -5,47 | ||||
| 2025-11-13 | 13F | Marshall Wace, Llp | 0 | -100,00 | 0 | |||||
| 2025-11-12 | 13F | HAP Trading, LLC | Put | 165.100 | 9 | |||||
| 2025-11-13 | 13F | Arrowstreet Capital, Limited Partnership | 0 | -100,00 | 0 |