Grundlæggende statistik
| Institutionelle aktier (lange) | 13.995.345 - 48,54% (ex 13D/G) - change of -2,58MM shares -15,57% MRQ |
| Institutionel værdi (lang) | $ 151.806 USD ($1000) |
Institutionelt ejerskab og aktionærer
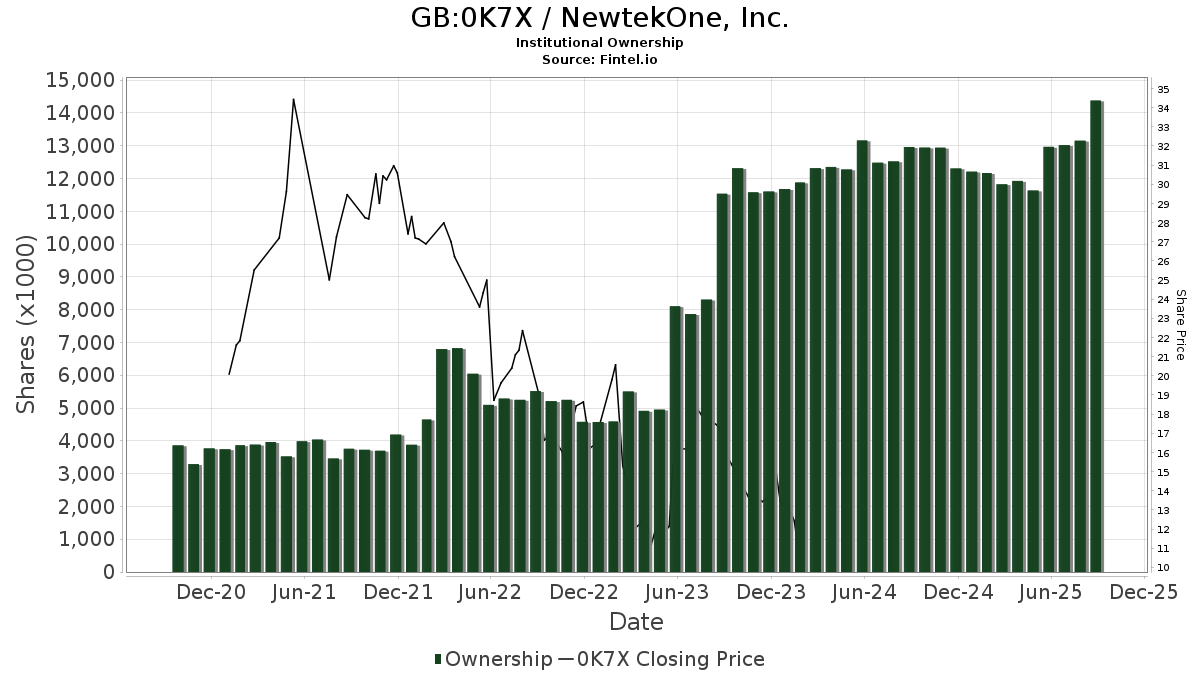
NewtekOne, Inc. (GB:0K7X) har 134 institutionelle ejere og aktionærer, der har indsendt 13D/G- eller 13F-formularer til Securities Exchange Commission (SEC). Disse institutioner har i alt 13,995,345 aktier. Største aktionærer omfatter Patriot Financial Partners GP II, L.P., BlackRock, Inc., Vanguard Group Inc, Geode Capital Management, Llc, Goldman Sachs Group Inc, Aqr Capital Management Llc, State Street Corp, North Reef Capital Management LP, Price T Rowe Associates Inc /md/, and Royce & Associates Lp .
NewtekOne, Inc. (LSE:0K7X) institutionel ejerskabsstruktur viser aktuelle positioner i virksomheden efter institutioner og fonde, samt seneste ændringer i positionsstørrelse. Større aktionærer kan omfatte individuelle investorer, investeringsforeninger, hedgefonde eller institutioner. Skema 13D angiver, at investoren besidder (eller besidder) mere end 5 % af virksomheden og har til hensigt (eller har til hensigt at) aktivt at forfølge en ændring i forretningsstrategi. Skema 13G indikerer en passiv investering på over 5%.
The share price as of April 24, 2026 is 12,90 / share. Previously, on April 30, 2025, the share price was 10,36 / share. This represents an increase of 24,54% over that period.
Fondens stemningsscore
Fund Sentiment Score (fka Ownership Accumulation Score) finder de aktier, der bliver mest købt af fonde. Det er resultatet af en sofistikeret, multi-faktor kvantitativ model, der identificerer virksomheder med de højeste niveauer af institutionel akkumulering. Scoringsmodellen bruger en kombination af den samlede stigning i oplyste ejere, ændringerne i porteføljeallokeringer i disse ejere og andre målinger. Tallet går fra 0 til 100, hvor højere tal indikerer et højere niveau af akkumulering for sine jævnaldrende, og 50 er gennemsnittet.
Opdateringsfrekvens: Dagligt
Se Ownership Explorer, som giver en liste over højest rangerende virksomheder.
AI+ Ask Fintel’s AI assistant about NewtekOne, Inc..
Select a question to share a public post with an AI-crafted answer.
Thinking of good questions…
13F og NPORT arkivering
Detaljer om 13F-arkivering er gratis. Detaljer om NP-ansøgninger kræver et premium-medlemskab. Grønne rækker angiver nye positioner. Røde rækker angiver lukkede positioner. Klik på linket ikon for at se den fulde transaktionshistorik.
Opgrader
for at låse premium-data op og eksportere til Excel ![]() .
.
| Fil dato | Kilde | Investor | Type | Gennemsnitlig pris (Øst) |
Aktier | Δ Aktier (%) |
Rapporteret Værdi ($1000) |
Δ Værdi (%) |
Port Alloc (%) |
|
|---|---|---|---|---|---|---|---|---|---|---|
| 2026-02-17 | 13F | Citadel Advisors Llc | 66.379 | -41,91 | 753 | -42,43 | ||||
| 2026-01-30 | 13F | R Squared Ltd | 0 | -100,00 | 0 | -100,00 | ||||
| 2026-02-09 | 13F | Royce & Associates Lp | 337.544 | 0,00 | 3.831 | -0,85 | ||||
| 2026-02-11 | 13F | Deutsche Bank Ag\ | 17.897 | -1,39 | 203 | -1,93 | ||||
| 2026-02-12 | 13F | Campbell & CO Investment Adviser LLC | 0 | -100,00 | 0 | |||||
| 2026-02-13 | 13F | Glen Eagle Advisors, LLC | 4.083 | 0,00 | 46 | 0,00 | ||||
| 2026-01-21 | 13F | Newbridge Financial Services Group, Inc. | 0 | -100,00 | 0 | |||||
| 2026-01-23 | 13F | Avion Wealth | 1.000 | 66,67 | 0 | |||||
| 2026-02-06 | 13F | Covestor Ltd | 154 | -35,29 | 0 | |||||
| 2026-02-05 | 13F | 1620 Investment Advisors, Inc. | 24.637 | -26,65 | 280 | -27,34 | ||||
| 2026-02-13 | 13F | Stifel Financial Corp | 0 | -100,00 | 0 | |||||
| 2026-01-21 | 13F | Flagship Harbor Advisors, Llc | 673 | 8 | ||||||
| 2026-02-17 | 13F | Price T Rowe Associates Inc /md/ | 357.106 | 1.987,61 | 4 | |||||
| 2026-04-03 | 13F | Ridgewood Investments LLC | 62.485 | 19,05 | 684 | 14,00 | ||||
| 2026-01-29 | 13F | Vanguard Group Inc | 1.516.091 | 3,91 | 17.208 | 3,00 | ||||
| 2026-02-17 | 13F | Creative Planning | 43.447 | -3,55 | 493 | -4,27 | ||||
| 2026-02-12 | 13F | BlackRock, Inc. | 2.162.835 | 2,60 | 24.548 | 1,71 | ||||
| 2026-02-13 | 13F | Prudential Financial Inc | 134.095 | -21,82 | 1.522 | -22,56 | ||||
| 2026-02-13 | 13F | Verition Fund Management LLC | 15.200 | -59,71 | 173 | -60,19 | ||||
| 2026-02-13 | 13F | American Century Companies Inc | 63.620 | -0,13 | 722 | -0,96 | ||||
| 2026-02-13 | 13F | Arkadios Wealth Advisors | 16.827 | -8,41 | 191 | -9,52 | ||||
| 2026-02-05 | 13F | Amalgamated Bank | 704 | -10,43 | 0 | |||||
| 2026-02-17 | 13F | Trexquant Investment LP | 145.253 | 11,50 | 1.649 | 10,53 | ||||
| 2025-11-14 | 13F | Wood Tarver Financial Group, LLC | 0 | -100,00 | 0 | |||||
| 2026-01-28 | 13F | Barrett & Company, Inc. | 106.020 | -18,05 | 1.203 | -18,77 | ||||
| 2026-02-10 | 13F/A | Northwestern Mutual Wealth Management Co | 500 | 6 | ||||||
| 2025-11-14 | 13F | Corton Capital Inc. | 0 | -100,00 | 0 | |||||
| 2026-04-23 | 13F | SJS Investment Consulting Inc. | 12 | 9,09 | 0 | |||||
| 2026-02-17 | 13F | Tudor Investment Corp Et Al | 15.254 | 173 | ||||||
| 2026-02-10 | 13F | Patriot Financial Partners GP II, L.P. | 2.307.692 | 0,00 | 26.192 | -0,87 | ||||
| 2026-04-07 | 13F | Signaturefd, Llc | 1.197 | 5,74 | 13 | 8,33 | ||||
| 2026-02-13 | 13F | Avenir Corp | 0 | -100,00 | 0 | |||||
| 2026-02-06 | 13F | Pnc Financial Services Group, Inc. | 1.936 | 11.288,24 | 22 | |||||
| 2026-02-12 | 13F | Quadrant Capital Group Llc | 1.206 | 1.156,25 | 14 | 1.200,00 | ||||
| 2026-01-27 | 13F | WealthCollab, LLC | 203 | 2 | ||||||
| 2026-02-10 | 13F | Intech Investment Management Llc | 10.334 | 0,00 | 117 | -0,85 | ||||
| 2026-02-13 | 13F | Police & Firemen's Retirement System of New Jersey | 5.933 | 0,00 | 67 | 0,00 | ||||
| 2026-01-30 | 13F | Torren Management, LLC | 2 | 0 | ||||||
| 2026-02-17 | 13F | Fmr Llc | 4.114 | 62,10 | 47 | 58,62 | ||||
| 2026-02-04 | 13F | Bailard, Inc. | 0 | -100,00 | 0 | |||||
| 2026-02-10 | 13F | Rothschild Investment Llc | 266 | 65,22 | 3 | 200,00 | ||||
| 2026-02-17 | 13F | Bridgeway Capital Management Inc | 29.700 | 337 | ||||||
| 2026-02-13 | 13F | Kestra Advisory Services, LLC | 0 | -100,00 | 0 | |||||
| 2026-02-17 | 13F | Two Sigma Investments, Lp | 257.781 | 15,28 | 2.926 | 14,26 | ||||
| 2026-02-13 | 13F | Barclays Plc | 46.818 | 8,43 | 531 | 7,49 | ||||
| 2026-02-17 | 13F | Mercer Global Advisors Inc /adv | 0 | -100,00 | 0 | -100,00 | ||||
| 2026-02-17 | 13F | Millennium Management Llc | 61.895 | -30,63 | 703 | -31,24 | ||||
| 2026-02-17 | 13F | Two Sigma Advisers, Lp | 42.300 | -20,04 | 480 | -20,66 | ||||
| 2025-10-31 | 13F | Y-Intercept (Hong Kong) Ltd | 0 | -100,00 | 0 | |||||
| 2026-02-13 | 13F | Marshall Wace, Llp | 0 | -100,00 | 0 | |||||
| 2026-02-13 | 13F | State Street Corp | 501.904 | -1,99 | 5.791 | -1,25 | ||||
| 2026-02-06 | 13F | Lsv Asset Management | 131.800 | 0,00 | 1 | 0,00 | ||||
| 2026-02-04 | 13F | Atlantic Union Bankshares Corp | 1.100 | -8,33 | 12 | -7,69 | ||||
| 2026-02-17 | 13F | Northern Trust Corp | 171.888 | -12,20 | 1.951 | -12,99 | ||||
| 2026-02-17 | 13F | Alliancebernstein L.p. | 25.670 | 0,00 | 291 | -0,68 | ||||
| 2026-02-17 | 13F | Russell Investments Group, Ltd. | 25.720 | -46,67 | 292 | -47,28 | ||||
| 2026-02-13 | 13F | Citigroup Inc | 57.256 | 10,14 | 650 | 9,08 | ||||
| 2026-02-17 | 13F | Quantinno Capital Management LP | 40.553 | -8,73 | 460 | -9,45 | ||||
| 2026-02-17 | 13F | Jump Financial, LLC | 88.084 | 21,83 | 1.000 | 20,80 | ||||
| 2026-01-15 | 13F | Nisa Investment Advisors, Llc | 840 | 1.948,78 | 10 | |||||
| 2026-02-17 | 13F | North Reef Capital Management LP | 386.923 | -0,00 | 4.392 | -0,88 | ||||
| 2026-02-13 | 13F | Segall Bryant & Hamill, Llc | 28.064 | -89,64 | 319 | -89,74 | ||||
| 2026-02-18 | 13F | Vermillion & White Wealth Management Group, LLC | 0 | -100,00 | 0 | |||||
| 2025-11-14 | 13F | Point72 Europe (London) LLP | 21 | 0 | ||||||
| 2026-02-13 | 13F | Squarepoint Ops LLC | 131.707 | 1.495 | ||||||
| 2026-02-11 | 13F | LPL Financial LLC | 21.220 | 3,79 | 241 | 2,56 | ||||
| 2026-02-17 | 13F | Tower Research Capital LLC (TRC) | 3.253 | 92,49 | 37 | 89,47 | ||||
| 2026-02-10 | 13F | Bnp Paribas Arbitrage, Sa | 15.142 | -29,52 | 172 | -30,20 | ||||
| 2026-02-17 | 13F | California State Teachers Retirement System | 1.380 | -11,08 | 16 | -11,76 | ||||
| 2026-02-17 | 13F | Susquehanna International Group, Llp | Put | 11.000 | 125 | |||||
| 2026-01-29 | 13F | UBS Group AG | 124.439 | 170,09 | 1.412 | 167,93 | ||||
| 2026-02-17 | 13F | Susquehanna International Group, Llp | Call | 71.600 | 116,97 | 813 | 115,38 | |||
| 2026-02-17 | 13F | Advisory Services Network, LLC | 0 | -100,00 | 0 | |||||
| 2026-04-07 | 13F | Farther Finance Advisors, LLC | 1.712 | 2,03 | 19 | -5,26 | ||||
| 2026-02-05 | 13F | Cambridge Investment Research Advisors, Inc. | 10.355 | -16,19 | 0 | |||||
| 2026-02-17 | 13F | Royal Bank Of Canada | 1.688 | 130,29 | 18 | 100,00 | ||||
| 2026-02-11 | 13F | Los Angeles Capital Management Llc | 7.059 | -78,25 | 72 | -80,59 | ||||
| 2026-01-05 | 13F | Commons Capital, Llc | 0 | -100,00 | 0 | |||||
| 2026-02-13 | 13F | Huber Capital Management LLC | 86.207 | 978 | ||||||
| 2026-02-09 | 13F | Hartland & Co., LLC | 0 | -100,00 | 0 | |||||
| 2026-02-17 | 13F | Qube Research & Technologies Ltd | 63.903 | 725 | ||||||
| 2026-02-20 | 13F | Kovitz Investment Group Partners, LLC | 0 | -100,00 | 0 | |||||
| 2026-02-05 | 13F | Allworth Financial LP | 2.421 | 1,34 | 27 | 0,00 | ||||
| 2026-01-13 | 13F | CoreCap Advisors, LLC | 0 | -100,00 | 0 | |||||
| 2026-02-02 | 13F | Fifth Third Bancorp | 45 | 0,00 | 1 | |||||
| 2025-11-05 | 13F | Alps Advisors Inc | 0 | -100,00 | 0 | |||||
| 2026-04-07 | 13F/A | Round Rock Advisors, LLC | 13.000 | 0,00 | 148 | -0,68 | ||||
| 2026-02-12 | 13F | Front Row Advisors LLC | 32 | 0,00 | 0 | |||||
| 2026-02-13 | 13F | Colony Group, LLC | 12.535 | 142 | ||||||
| 2026-02-13 | 13F | First Trust Advisors Lp | 97.214 | 7,05 | 1.103 | 6,16 | ||||
| 2026-02-17 | 13F | Graham Capital Management, L.P. | 33.034 | 54,03 | 375 | 52,65 | ||||
| 2025-11-14 | 13F | Algert Global Llc | 0 | -100,00 | 0 | |||||
| 2026-04-13 | 13F | IFP Advisors, Inc | 2.130 | -0,65 | 23 | -4,17 | ||||
| 2026-02-13 | 13F | Boston Partners | 79.789 | -1,88 | 906 | -2,79 | ||||
| 2026-04-08 | 13F | Wealth Enhancement Advisory Services, Llc | 14.677 | 23,33 | 162 | 14,08 | ||||
| 2026-02-17 | 13F | Ancora Advisors, LLC | 63.200 | -54,64 | 717 | -55,05 | ||||
| 2026-02-17 | 13F | Aquatic Capital Management LLC | 8.370 | 12,48 | 95 | 11,76 | ||||
| 2025-11-14 | 13F | Petrus Trust Company, LTA | 0 | -100,00 | 0 | |||||
| 2026-02-02 | 13F | Cornerstone Planning Group LLC | 50 | 2.400,00 | 1 | |||||
| 2026-02-17 | 13F | Beacon Investment Advisors Llc | 16.499 | 1,94 | 187 | 1,08 | ||||
| 2026-02-06 | 13F | EverSource Wealth Advisors, LLC | 1.063 | -11,05 | 12 | -7,69 | ||||
| 2026-04-24 | 13F | Vision Financial Markets Llc | 1.931 | 1,10 | 21 | 0,00 | ||||
| 2026-02-14 | 13F | Rockefeller Capital Management L.P. | 79 | 0,00 | 1 | |||||
| 2026-02-17 | 13F | Citadel Advisors Llc | Call | 0 | -100,00 | 0 | ||||
| 2026-02-17 | 13F | Almitas Capital LLC | 53.570 | 608 | ||||||
| 2026-02-12 | 13F | New York State Common Retirement Fund | 7.597 | 0,00 | 86 | 0,00 | ||||
| 2026-02-17 | 13F | State Of Wisconsin Investment Board | 0 | -100,00 | 0 | |||||
| 2026-02-17 | 13F | ExodusPoint Capital Management, LP | 0 | -100,00 | 0 | -100,00 | ||||
| 2026-02-11 | 13F | Ameritas Investment Partners, Inc. | 1.925 | 0,00 | 22 | -4,55 | ||||
| 2026-02-17 | 13F | Advisor Group Holdings, Inc. | 3.479 | -52,45 | 39 | -56,67 | ||||
| 2026-02-11 | 13F | Jpmorgan Chase & Co | 108.765 | -45,43 | 1.234 | -45,90 | ||||
| 2026-02-13 | 13F | Ieq Capital, Llc | 45.942 | -24,94 | 521 | -25,57 | ||||
| 2026-01-26 | 13F | Cwm, Llc | 21.793 | 2,37 | 0 | |||||
| 2026-02-12 | 13F | Founders Financial Alliance, LLC | 30.401 | 0,83 | 345 | 0,00 | ||||
| 2026-02-10 | 13F | Goldman Sachs Group Inc | 549.239 | 119,34 | 6.234 | 117,40 | ||||
| 2026-04-15 | 13F | FNY Investment Advisers, LLC | Put | 35 | -23,91 | 0 | ||||
| 2026-02-12 | 13F | Nuveen, LLC | 272.791 | 99,23 | 3.096 | 97,57 | ||||
| 2025-11-14 | 13F | Cubist Systematic Strategies, LLC | 90.768 | -27,39 | 1.039 | -26,31 | ||||
| 2026-04-15 | 13F | FNY Investment Advisers, LLC | 800 | 0,00 | 0 | |||||
| 2026-04-22 | 13F | Sterling Capital Management LLC | 815 | -36,87 | 9 | -42,86 | ||||
| 2026-02-10 | 13F | Quantbot Technologies LP | 0 | -100,00 | 0 | |||||
| 2026-04-13 | 13F | True Wealth Design, LLC | 43 | 4,88 | 0 | |||||
| 2026-02-03 | 13F | International Assets Investment Management, Llc | 1.875 | 21 | ||||||
| 2026-02-05 | 13F | Td Private Client Wealth Llc | 13 | 0 | ||||||
| 2026-02-10 | 13F | Bank of New York Mellon Corp | 101.775 | -62,73 | 1.155 | -63,05 | ||||
| 2026-02-13 | 13F | Ubs Asset Management Americas Inc | 50 | 1 | ||||||
| 2026-02-17 | 13F | Man Group plc | 45.906 | 6,40 | 521 | 5,47 | ||||
| 2026-02-11 | 13F | Cerity Partners LLC | 13.714 | 18,03 | 156 | 16,54 | ||||
| 2026-02-13 | 13F | Mariner, LLC | 10.708 | -15,43 | 122 | -15,97 | ||||
| 2026-02-17 | 13F | Optiver Holding B.V. | 450 | 0,00 | 5 | 0,00 | ||||
| 2026-02-09 | 13F | Geode Capital Management, Llc | 617.989 | -1,55 | 7.016 | -2,42 | ||||
| 2026-01-16 | 13F | Crewe Advisors LLC | 2.000 | 23 | ||||||
| 2026-02-13 | 13F | Rhumbline Advisers | 29.188 | -17,33 | 331 | -18,07 | ||||
| 2026-02-17 | 13F | Ameriprise Financial Inc | 138.491 | -1,31 | 1.572 | -2,18 | ||||
| 2026-02-13 | 13F | MAI Capital Management | 19 | 0 | ||||||
| 2026-02-10 | 13F | Connor, Clark & Lunn Investment Management Ltd. | 268.676 | 17,12 | 3.049 | 16,11 | ||||
| 2026-02-12 | 13F | Steward Partners Investment Advisory, Llc | 12 | 0 | ||||||
| 2026-02-17 | 13F | Point72 Asset Management, L.P. | 41.142 | 467 | ||||||
| 2026-01-22 | 13F | Jackson Thornton Asset Management, Llc | 26.048 | -1,14 | 312 | 5,42 | ||||
| 2026-02-17 | 13F | MIRAE ASSET GLOBAL ETFS HOLDINGS Ltd. | 10.433 | -10,58 | 118 | -11,28 | ||||
| 2026-04-24 | 13F | Root Financial Partners, LLC | 47 | 1 | ||||||
| 2026-02-12 | 13F | MetLife Investment Management, LLC | 22.446 | 0,00 | 255 | -1,17 | ||||
| 2026-02-17 | 13F | Aqr Capital Management Llc | 535.523 | -7,18 | 6.078 | -7,99 | ||||
| 2026-02-12 | 13F | Jane Street Group, Llc | 94.502 | 131,51 | 1.073 | 129,55 | ||||
| 2026-02-17 | 13F | Raymond James Financial Inc | 21.221 | 4,09 | 241 | 3,00 | ||||
| 2026-04-06 | 13F | Versant Capital Management, Inc | 1.459 | 70,44 | 16 | 66,67 | ||||
| 2026-02-19 | 13F | Invesco Ltd. | 44.519 | -6,80 | 505 | -7,51 | ||||
| 2026-02-13 | 13F | SRS Capital Advisors, Inc. | 145 | -99,26 | 2 | -99,55 | ||||
| 2026-02-09 | 13F | Quest Partners LLC | 22.161 | 1,88 | 252 | 0,80 | ||||
| 2026-02-06 | 13F | Gsa Capital Partners Llp | 99.170 | 1 | ||||||
| 2026-02-13 | 13F | Bard Associates Inc | 0 | -100,00 | 0 | |||||
| 2026-02-11 | 13F | Franklin Resources Inc | 0 | -100,00 | 0 | |||||
| 2026-02-13 | 13F | Morgan Stanley | 158.064 | -0,62 | 1.794 | -1,48 | ||||
| 2026-02-06 | 13F | Bare Financial Services, Inc | 98 | 1 | ||||||
| 2026-02-13 | 13F | Wells Fargo & Company/mn | 39.082 | 21,49 | 444 | 20,38 | ||||
| 2025-11-13 | 13F | Magnetar Financial LLC | 0 | -100,00 | 0 | |||||
| 2026-02-17 | 13F | D. E. Shaw & Co., Inc. | 233.344 | -18,68 | 2.648 | -19,39 | ||||
| 2026-02-17 | 13F | Jones Financial Companies Lllp | 181 | 0,00 | 2 | 0,00 | ||||
| 2026-02-12 | 13F | Principal Securities, Inc. | 0 | -100,00 | 0 | -100,00 | ||||
| 2026-01-30 | 13F | Us Bancorp \de\ | 101 | 248,28 | 1 | |||||
| 2026-02-09 | 13F | Jefferies Financial Group Inc. | 35.000 | 397 | ||||||
| 2025-11-13 | 13F | Dynamic Technology Lab Private Ltd | 0 | -100,00 | 0 | -100,00 | ||||
| 2026-02-09 | 13F | Legal & General Group Plc | 1.888 | -14,88 | 21 | -16,00 | ||||
| 2026-02-17 | 13F | Boothbay Fund Management, Llc | 0 | -100,00 | 0 | |||||
| 2026-04-06 | 13F | GAMMA Investing LLC | 1.125 | 15,98 | 12 | 9,09 | ||||
| 2026-02-13 | 13F | Transamerica Financial Advisors, Inc. | 21 | 0 | ||||||
| 2025-11-14 | 13F | Susquehanna International Group, Llp | 0 | -100,00 | 0 | -100,00 | ||||
| 2026-02-17 | 13F | Bank Of America Corp /de/ | 51.681 | -51,65 | 587 | -52,09 |