Grundlæggende statistik
| Institutionelle aktier (lange) | 35.278.205 - 21,54% (ex 13D/G) - change of -5,06MM shares -12,54% MRQ |
| Institutionel værdi (lang) | $ 139.749 USD ($1000) |
Institutionelt ejerskab og aktionærer
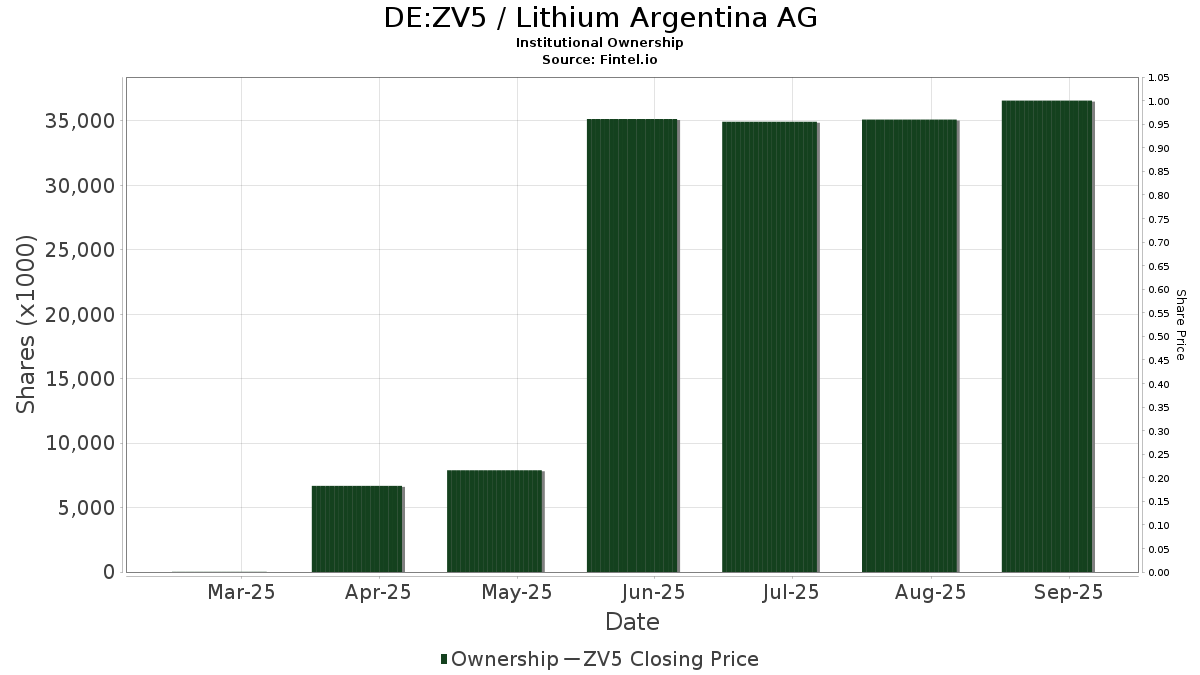
Lithium Argentina AG (DE:ZV5) har 147 institutionelle ejere og aktionærer, der har indsendt 13D/G- eller 13F-formularer til Securities Exchange Commission (SEC). Disse institutioner har i alt 35,278,205 aktier. Største aktionærer omfatter Van Eck Associates Corp, MIRAE ASSET GLOBAL ETFS HOLDINGS Ltd., Millennium Management Llc, Seldon Capital Lp, Invesco Ltd., Connor, Clark & Lunn Investment Management Ltd., M&G Plc, CenterBook Partners LP, Morgan Stanley, and Goldman Sachs Group Inc .
Lithium Argentina AG (DB:ZV5) institutionel ejerskabsstruktur viser aktuelle positioner i virksomheden efter institutioner og fonde, samt seneste ændringer i positionsstørrelse. Større aktionærer kan omfatte individuelle investorer, investeringsforeninger, hedgefonde eller institutioner. Skema 13D angiver, at investoren besidder (eller besidder) mere end 5 % af virksomheden og har til hensigt (eller har til hensigt at) aktivt at forfølge en ændring i forretningsstrategi. Skema 13G indikerer en passiv investering på over 5%.
The share price as of April 30, 2026 is 8,84 / share. Previously, on May 2, 2025, the share price was 1,78 / share. This represents an increase of 396,63% over that period.
Fondens stemningsscore
Fund Sentiment Score (fka Ownership Accumulation Score) finder de aktier, der bliver mest købt af fonde. Det er resultatet af en sofistikeret, multi-faktor kvantitativ model, der identificerer virksomheder med de højeste niveauer af institutionel akkumulering. Scoringsmodellen bruger en kombination af den samlede stigning i oplyste ejere, ændringerne i porteføljeallokeringer i disse ejere og andre målinger. Tallet går fra 0 til 100, hvor højere tal indikerer et højere niveau af akkumulering for sine jævnaldrende, og 50 er gennemsnittet.
Opdateringsfrekvens: Dagligt
Se Ownership Explorer, som giver en liste over højest rangerende virksomheder.
AI+ Ask Fintel’s AI assistant about Lithium Argentina AG.
Select a question to share a public post with an AI-crafted answer.
Thinking of good questions…
13F og NPORT arkivering
Detaljer om 13F-arkivering er gratis. Detaljer om NP-ansøgninger kræver et premium-medlemskab. Grønne rækker angiver nye positioner. Røde rækker angiver lukkede positioner. Klik på linket ikon for at se den fulde transaktionshistorik.
Opgrader
for at låse premium-data op og eksportere til Excel ![]() .
.
| Fil dato | Kilde | Investor | Type | Gennemsnitlig pris (Øst) |
Aktier | Δ Aktier (%) |
Rapporteret Værdi ($1000) |
Δ Værdi (%) |
Port Alloc (%) |
|
|---|---|---|---|---|---|---|---|---|---|---|
| 2026-01-23 | 13F | Optima Capital Llc | 1.705 | 10 | ||||||
| 2026-02-17 | 13F | Balyasny Asset Management Llc | 971.950 | 5.423 | ||||||
| 2026-04-14 | 13F | Nbc Securities, Inc. | 222 | -12,94 | 1 | 0,00 | ||||
| 2026-02-13 | 13F | OMERS ADMINISTRATION Corp | 0 | -100,00 | 0 | |||||
| 2026-04-15 | 13F | Gf Fund Management Co. Ltd. | 0 | -100,00 | 0 | |||||
| 2026-02-10 | 13F/A | Northwestern Mutual Wealth Management Co | 43.474 | -10,68 | 243 | 49,38 | ||||
| 2026-02-17 | 13F | SageView Advisory Group, LLC | 330 | 2 | ||||||
| 2026-02-17 | 13F | Citadel Advisors Llc | 0 | -100,00 | 0 | -100,00 | ||||
| 2026-02-11 | 13F | CenterBook Partners LP | 1.231.844 | 6.874 | ||||||
| 2026-02-10 | 13F | Goldman Sachs Group Inc | 1.036.354 | 58,55 | 5.783 | 164,86 | ||||
| 2026-02-12 | 13F | Groupe la Francaise | 0 | -100,00 | 0 | |||||
| 2026-02-10 | 13F | Bnp Paribas Arbitrage, Sa | 7.836 | -31,19 | 44 | 13,16 | ||||
| 2026-02-17 | 13F | Black Maple Capital Management LP | 20.191 | -33,12 | 113 | 12,00 | ||||
| 2026-02-17 | 13F | State Of Wisconsin Investment Board | 118.000 | 659 | ||||||
| 2026-04-23 | 13F | Kohmann Bosshard Financial Services, LLC | 100 | 0,00 | 1 | |||||
| 2026-01-26 | 13F | Cwm, Llc | 627 | 0,00 | 0 | |||||
| 2026-02-13 | 13F | Morgan Stanley | 1.059.980 | 60,90 | 5.915 | 168,82 | ||||
| 2026-02-17 | 13F | Mirabella Financial Services Llp | 59.952 | 5,72 | 335 | 76,72 | ||||
| 2026-02-12 | 13F | M&G Plc | 1.401.219 | 12,16 | 8.407 | 124,37 | ||||
| 2026-02-03 | 13F | Credit Industriel Et Commercial | 0 | -100,00 | 0 | |||||
| 2026-04-17 | 13F | AdvisorNet Financial, Inc | 4.652 | 0,00 | 31 | 24,00 | ||||
| 2026-02-03 | 13F | McCarthy Asset Management, Inc. | 0 | -100,00 | 0 | |||||
| 2026-02-12 | 13F | Jane Street Group, Llc | Put | 0 | -100,00 | 0 | -100,00 | |||
| 2026-02-06 | 13F | EverSource Wealth Advisors, LLC | 109 | 6,86 | 1 | |||||
| 2026-02-12 | 13F | Jane Street Group, Llc | Call | 0 | -100,00 | 0 | -100,00 | |||
| 2026-02-11 | 13F | Winton Capital Group Ltd | 90.461 | 301,34 | 505 | 572,00 | ||||
| 2026-02-13 | 13F | Toroso Investments, LLC | 145.977 | -0,15 | 815 | 66,80 | ||||
| 2025-11-10 | 13F/A | Flaharty Asset Management, LLC | 0 | -100,00 | 0 | |||||
| 2026-02-06 | 13F | HighTower Advisors, LLC | 18.338 | -0,10 | 102 | 67,21 | ||||
| 2026-02-12 | 13F | Alps Advisors Inc | 459.929 | 2.566 | ||||||
| 2026-04-27 | 13F | Counterpoint Mutual Funds LLC | 81.261 | 543 | ||||||
| 2026-02-17 | 13F | Quadrature Capital Ltd | 133.841 | 747 | ||||||
| 2026-02-17 | 13F | Advisor Group Holdings, Inc. | 31.117 | -1,90 | 174 | 61,68 | ||||
| 2026-02-17 | 13F | Ameriprise Financial Inc | 46.022 | -3,51 | 257 | 61,01 | ||||
| 2026-02-17 | 13F | Tower Research Capital LLC (TRC) | 3.271 | -71,76 | 18 | -52,63 | ||||
| 2026-04-16 | 13F | Sterling Investment Counsel, LLC | 28.197 | 0,00 | 188 | 19,75 | ||||
| 2026-02-13 | 13F | National Bank Of Canada /fi/ | 99.446 | -6,23 | 552 | 61,40 | ||||
| 2026-05-01 | 13F | Fifth Third Bancorp | 14.000 | 0,00 | 94 | 19,23 | ||||
| 2026-02-17 | 13F | Citadel Advisors Llc | Call | 299.100 | 226,53 | 1.669 | 446,89 | |||
| 2026-01-29 | 13F | D.a. Davidson & Co. | 22.550 | 0,00 | 126 | 66,67 | ||||
| 2026-02-17 | 13F | XTX Topco Ltd | 88.086 | 33,34 | 492 | 123,18 | ||||
| 2026-01-08 | 13F | Chesapeake Asset Management Llc | 1.375 | 0,00 | 8 | 75,00 | ||||
| 2025-11-12 | 13F | Creative Financial Designs Inc /adv | 0 | -100,00 | 0 | -100,00 | ||||
| 2026-02-10 | 13F | Connor, Clark & Lunn Investment Management Ltd. | 2.008.800 | 11.211 | ||||||
| 2026-02-20 | 13F | Sunbelt Securities, Inc. | 600 | 0,00 | 3 | 50,00 | ||||
| 2025-11-06 | 13F | Claudia M.p. Batlle, Crp (r) Llc | 0 | -100,00 | 0 | -100,00 | ||||
| 2025-11-13 | 13F | Boston Partners | 0 | -100,00 | 0 | -100,00 | ||||
| 2026-02-17 | 13F | Polygon Management Ltd. | 0 | -100,00 | 0 | |||||
| 2026-02-13 | 13F | Manufacturers Life Insurance Company, The | 0 | -100,00 | 0 | |||||
| 2026-02-17 | 13F | Citadel Advisors Llc | Put | 48.400 | 19,51 | 270 | 100,00 | |||
| 2026-04-30 | 13F | Cedar Mountain Advisors, LLC | 1 | 0,00 | 0 | |||||
| 2026-02-13 | 13F | Squarepoint Ops LLC | 59.002 | 329 | ||||||
| 2026-02-17 | 13F | Fairscale Capital, LLC | 785 | 0,00 | 4 | 100,00 | ||||
| 2026-04-13 | 13F | True Wealth Design, LLC | 600 | 0,00 | 4 | 33,33 | ||||
| 2026-02-09 | 13F | Harbour Investments, Inc. | 150 | 0,00 | 1 | |||||
| 2025-11-13 | 13F | Diversify Advisory Services, LLC | 0 | -100,00 | 0 | |||||
| 2026-02-17 | 13F | Riverview Capital Advisers, LLC | 60.786 | 0,00 | 339 | 67,00 | ||||
| 2026-02-17 | 13F | Cetera Investment Advisers | 16.593 | -22,36 | 93 | 29,58 | ||||
| 2026-02-17 | 13F | Susquehanna International Group, Llp | 400.576 | 52,84 | 2.235 | 155,43 | ||||
| 2026-02-13 | 13F | First Trust Advisors Lp | 45.985 | 257 | ||||||
| 2026-02-04 | 13F | Clark Wealth Partners | 376 | 0,00 | 2 | 0,00 | ||||
| 2026-02-17 | 13F | Susquehanna International Group, Llp | Put | 244.000 | 129,76 | 1.362 | 284,46 | |||
| 2026-02-17 | 13F | Susquehanna International Group, Llp | Call | 345.000 | 1.504,65 | 1.925 | 2.611,27 | |||
| 2026-02-12 | 13F | CIBC Private Wealth Group, LLC | 2.970 | 0,00 | 17 | 77,78 | ||||
| 2026-02-13 | 13F | SRS Capital Advisors, Inc. | 2.150 | 0,00 | 12 | 57,14 | ||||
| 2026-02-17 | 13F | Jones Financial Companies Lllp | 63.017 | 6,01 | 352 | 67,14 | ||||
| 2026-04-28 | 13F | SBI Securities Co., Ltd. | 3.827 | 1,03 | 26 | 19,05 | ||||
| 2026-02-09 | 13F | Hartland & Co., LLC | 50 | 0,00 | 0 | |||||
| 2026-02-17 | 13F | Mercer Global Advisors Inc /adv | 92.340 | -3,88 | 515 | 60,94 | ||||
| 2026-04-29 | 13F | Garner Asset Management Corp | 0 | -100,00 | 0 | |||||
| 2026-03-19 | 13F | Painted Porch Advisors LLC | 0 | -100,00 | 0 | -100,00 | ||||
| 2026-02-17 | 13F | Susquehanna Advisors Group, Inc. | 0 | -100,00 | 0 | |||||
| 2026-02-09 | 13F | Huntington National Bank | 1.000 | 0,00 | 6 | 66,67 | ||||
| 2026-02-13 | 13F | Barclays Plc | 40.215 | -49,20 | 224 | -15,15 | ||||
| 2025-11-14 | 13F | Toronto Dominion Bank | 0 | -100,00 | 0 | |||||
| 2026-04-16 | 13F | Balboa Wealth Partners | 34.588 | -0,69 | 231 | 19,07 | ||||
| 2026-05-01 | 13F | Concord Wealth Partners | 0 | -100,00 | 0 | |||||
| 2026-02-13 | 13F | Ingalls & Snyder Llc | 25.200 | 0,00 | 0 | |||||
| 2026-02-17 | 13F | Schonfeld Strategic Advisors LLC | 31.977 | 178 | ||||||
| 2026-02-06 | 13F | Tortoise Investment Management, LLC | 0 | -100,00 | 0 | |||||
| 2026-02-12 | 13F | Commonwealth Equity Services, Llc | 20.263 | -21,50 | 113 | |||||
| 2026-02-13 | 13F | Caitong International Asset Management Co., Ltd | 1.501 | 1.401,00 | 8 | |||||
| 2025-11-14 | 13F | Point72 Asset Management, L.P. | 0 | -100,00 | 0 | |||||
| 2026-02-17 | 13F | Royal Bank Of Canada | 117.844 | -86,11 | 658 | -76,78 | ||||
| 2026-03-12 | 13F/A | Peak6 Llc | Call | 692.300 | 3.863 | |||||
| 2026-02-17 | 13F | Northern Trust Corp | 17.137 | 0,00 | 96 | 66,67 | ||||
| 2026-02-13 | 13F | Banco Santander, S.A. | 11.628 | -75,45 | 65 | -59,49 | ||||
| 2026-01-23 | 13F | Sage Investment Counsel LLC | 0 | -100,00 | 0 | |||||
| 2026-02-18 | 13F | GWM Advisors LLC | 5.584 | 0,00 | 31 | 72,22 | ||||
| 2026-02-13 | 13F | Parkside Financial Bank & Trust | 10 | 0,00 | 0 | |||||
| 2026-02-12 | 13F | Edgewood Management Llc | 50.000 | 0,00 | 279 | 67,07 | ||||
| 2026-01-30 | 13F | Us Bancorp \de\ | 398 | -15,50 | 2 | 100,00 | ||||
| 2026-02-18 | 13F/A | Empowered Funds, LLC | 24.766 | 138 | ||||||
| 2026-04-10 | 13F | Quaker Wealth Management, LLC | 17 | 0,00 | 0 | |||||
| 2026-01-29 | 13F | UBS Group AG | 289.244 | -69,77 | 1.614 | -49,53 | ||||
| 2026-02-17 | 13F | Bank Of America Corp /de/ | 460.679 | 24,33 | 2.571 | 107,76 | ||||
| 2025-11-03 | 13F | Hollencrest Capital Management | 0 | -100,00 | 0 | |||||
| 2026-04-30 | 13F | Hsbc Holdings Plc | 17.947 | -5,74 | 121 | 13,21 | ||||
| 2026-02-12 | 13F | Insigneo Advisory Services, Llc | 0 | -100,00 | 0 | |||||
| 2026-02-11 | 13F | Parallel Advisors, LLC | 100 | -81,82 | 1 | -100,00 | ||||
| 2026-04-28 | 13F | Golden State Equity Partners | 80 | 1 | ||||||
| 2026-04-27 | 13F | New England Capital Financial Advisors LLC | 50 | 0,00 | 0 | |||||
| 2026-02-13 | 13F | Evelyn Partners Investment Management LLP | 300 | 0,00 | 2 | 0,00 | ||||
| 2025-11-13 | 13F | VGI Partners Ltd | 0 | -100,00 | 0 | -100,00 | ||||
| 2026-02-17 | 13F | Orion Resource Partners LP | 0 | -100,00 | 0 | |||||
| 2026-02-18 | 13F | Caitlin John, LLC | 190 | 1 | ||||||
| 2025-11-13 | 13F | Total Investment Management Inc | 0 | -100,00 | 0 | |||||
| 2026-02-12 | 13F | Hrt Financial Lp | 243.644 | 1 | ||||||
| 2026-02-17 | 13F | Nomura Holdings Inc | 0 | -100,00 | 0 | |||||
| 2026-02-17 | 13F | J. Goldman & Co LP | Call | 30.000 | 167 | |||||
| 2026-02-17 | 13F | Tudor Investment Corp Et Al | 54.500 | 304 | ||||||
| 2026-02-12 | 13F | Renaissance Technologies Llc | 0 | -100,00 | 0 | |||||
| 2026-04-07 | 13F | Signaturefd, Llc | 137 | 0,00 | 1 | |||||
| 2026-04-22 | 13F | Formidable Asset Management, LLC | 268.926 | -14,74 | 1.584 | 10,08 | ||||
| 2026-02-11 | 13F | Group One Trading, L.p. | 89.349 | 504,40 | 499 | 916,33 | ||||
| 2025-11-14 | 13F | Larson Financial Group LLC | 0 | -100,00 | 0 | |||||
| 2026-02-13 | 13F | Citigroup Inc | 750 | 0,00 | 4 | 100,00 | ||||
| 2026-02-17 | 13F | Two Sigma Investments, Lp | 497.604 | 155,80 | 2.777 | 327,73 | ||||
| 2026-04-30 | 13F | Cambridge Investment Research Advisors, Inc. | 22.844 | 0,36 | 0 | |||||
| 2026-02-10 | 13F | Lido Advisors, LLC | 10.583 | 0,00 | 37 | 2,86 | ||||
| 2026-04-13 | 13F | St Germain D J Co Inc | 324 | 0,00 | 2 | 100,00 | ||||
| 2026-02-13 | 13F | JustInvest LLC | 13.204 | 1,82 | 74 | 69,77 | ||||
| 2026-04-28 | 13F | Core Wealth Advisors, Llc | 0 | -100,00 | 0 | |||||
| 2026-01-16 | 13F | Legacy Capital Wealth Partners, LLC | 11.279 | 0,00 | 63 | 67,57 | ||||
| 2026-04-22 | 13F | Portus Wealth Advisors, LLC | 1 | 0 | ||||||
| 2026-04-30 | 13F | Millstone Evans Group, LLC | 20 | 0,00 | 0 | |||||
| 2026-02-13 | 13F | Verition Fund Management LLC | 17.178 | 14,87 | 96 | 93,88 | ||||
| 2026-01-21 | 13F | Newbridge Financial Services Group, Inc. | 1.029 | 0,00 | 6 | 66,67 | ||||
| 2025-11-06 | 13F | Financial Advocates Investment Management | 0 | -100,00 | 0 | |||||
| 2026-02-13 | 13F | Pinpoint Asset Management (Singapore) Pte. Ltd. | 3.166 | 18 | ||||||
| 2026-02-17 | 13F | Strive Financial Group ,LLC | 23 | 0 | ||||||
| 2026-04-07 | 13F | CoreCap Advisors, LLC | 0 | -100,00 | 0 | |||||
| 2026-02-06 | 13F | GPS Wealth Strategies Group, LLC | 0 | -100,00 | 0 | |||||
| 2026-02-19 | 13F | Invesco Ltd. | 2.028.903 | -13,01 | 11.321 | 45,35 | ||||
| 2026-04-08 | 13F | Wealth Enhancement Advisory Services, Llc | 293.087 | -15,19 | 2.204 | -8,62 | ||||
| 2025-11-13 | 13F | Sandhill Capital Partners LLC | 0 | -100,00 | 0 | -100,00 | ||||
| 2026-04-17 | 13F | IFC & Insurance Marketing, Inc. | 0 | -100,00 | 0 | |||||
| 2025-11-14 | 13F | Two Sigma Securities, Llc | 0 | -100,00 | 0 | |||||
| 2026-02-13 | 13F | Brown Advisory Inc | 90.656 | -3,20 | 506 | 61,86 | ||||
| 2026-02-13 | 13F | Missouri Trust & Investment Co | 75 | 0,00 | 0 | |||||
| 2026-02-10 | 13F | CIBC World Markets Inc. | 69.856 | -45,45 | 390 | -8,90 | ||||
| 2026-02-10 | 13F | Quantbot Technologies LP | 62.034 | -68,39 | 346 | -47,18 | ||||
| 2026-04-13 | 13F | Hm Payson & Co | 1.980 | 0,00 | 13 | 18,18 | ||||
| 2026-02-10 | 13F | Envestnet Asset Management Inc | 28.883 | -25,94 | 161 | 23,85 | ||||
| 2025-11-14 | 13F | Scotia Capital Inc. | 0 | -100,00 | 0 | |||||
| 2026-02-17 | 13F | Old West Investment Management, LLC | 33.089 | 185 | ||||||
| 2026-04-27 | 13F | Ping Capital Management, Inc. | 133.000 | 30,39 | 888 | 56,06 | ||||
| 2026-02-06 | 13F | Global Retirement Partners, LLC | 1.107 | 0,00 | 6 | 100,00 | ||||
| 2026-02-17 | 13F | D. E. Shaw & Co., Inc. | 611.500 | 49,51 | 3.413 | 150,40 | ||||
| 2026-02-17 | 13F | Elequin Capital Lp | 13 | 0 | ||||||
| 2026-02-05 | 13F | 1620 Investment Advisors, Inc. | 88 | 0,00 | 0 | |||||
| 2026-02-12 | 13F | Federation des caisses Desjardins du Quebec | 24.620 | -23,08 | 137 | 31,73 | ||||
| 2026-03-16 | 13F/A | Rockefeller Capital Management L.P. | 518 | -11,75 | 3 | 100,00 | ||||
| 2026-02-13 | 13F | Mariner, LLC | 11.388 | 8,43 | 63 | 80,00 | ||||
| 2025-11-12 | 13F | Transce3nd, LLC | 0 | -100,00 | 0 | |||||
| 2026-02-02 | 13F | Mutual Advisors, LLC | 48.592 | 0,00 | 271 | 36,18 | ||||
| 2026-02-04 | 13F | Ameritas Advisory Services, LLC | 0 | -100,00 | 0 | |||||
| 2026-02-05 | 13F | Tucker Asset Management Llc | 724 | 4 | ||||||
| 2025-11-17 | 13F | Hancock Prospecting Pty Ltd | 0 | -100,00 | 0 | -100,00 | ||||
| 2026-04-27 | 13F | Leonteq Securities AG | 0 | -100,00 | 0 | |||||
| 2026-02-10 | 13F | Koss-Olinger Consulting, LLC | 20.999 | -35,97 | 117 | 72,06 | ||||
| 2026-01-26 | 13F | Main Street Group, LTD | 0 | -100,00 | 0 | |||||
| 2026-02-12 | 13F | BlackRock, Inc. | 127.633 | 52,01 | 712 | 154,29 | ||||
| 2026-02-17 | 13F | Seldon Capital Lp | 2.148.931 | 18,09 | 11.992 | 97,38 | ||||
| 2026-04-28 | 13F | Robertson Stephens Wealth Management, LLC | 14.475 | 97 | ||||||
| 2026-01-27 | 13F | TD Waterhouse Canada Inc. | 6.995 | 538,81 | 39 | 1.166,67 | ||||
| 2026-02-17 | 13F | Advisory Services Network, LLC | 0 | -100,00 | 0 | |||||
| 2026-02-17 | 13F | Cambria Investment Management, L.P. | 24.766 | 138 | ||||||
| 2026-02-06 | 13F | Bare Financial Services, Inc | 190 | 1 | ||||||
| 2026-03-04 | 13F | SHP Wealth Management | 25 | 0 | ||||||
| 2026-04-13 | 13F | IFP Advisors, Inc | 16 | 0,00 | 0 | |||||
| 2026-02-11 | 13F | LPL Financial LLC | 113.960 | -0,84 | 636 | 65,80 | ||||
| 2025-11-07 | 13F | Atticus Wealth Management, Llc | 0 | -100,00 | 0 | |||||
| 2026-02-06 | 13F | VSM Wealth Advisory, LLC | 1.000 | 0,00 | 6 | 66,67 | ||||
| 2026-02-05 | 13F | Allworth Financial LP | 3.430 | 0,00 | 19 | 72,73 | ||||
| 2026-02-13 | 13F | Wells Fargo & Company/mn | 83.597 | -34,62 | 466 | 9,13 | ||||
| 2026-02-10 | 13F | Bruce G. Allen Investments, LLC | 185 | 0,00 | 1 | |||||
| 2026-02-17 | 13F | Jain Global LLC | 36.101 | 201 | ||||||
| 2026-02-11 | 13F | Jpmorgan Chase & Co | 611.594 | 2.105,69 | 3.413 | 3.608,70 | ||||
| 2026-02-12 | 13F | Jane Street Group, Llc | 440.959 | 12,83 | 2.461 | 88,51 | ||||
| 2026-04-07 | 13F | Farther Finance Advisors, LLC | 362 | 123,46 | 3 | |||||
| 2026-02-17 | 13F | Two Sigma Advisers, Lp | 0 | -100,00 | 0 | |||||
| 2026-04-27 | 13F | Sound Income Strategies, LLC | 50 | 0,00 | 0 | |||||
| 2026-04-28 | 13F | Stratos Wealth Advisors, LLC | 10.864 | -20,34 | 73 | -5,26 | ||||
| 2026-02-13 | 13F | Van Eck Associates Corp | 10.251.244 | 6,85 | 57 | 78,13 | ||||
| 2026-01-16 | 13F | Ronald Blue Trust, Inc. | 0 | -100,00 | 0 | |||||
| 2026-04-24 | 13F | Medallion Wealth Advisors, LLC | 600 | 0,00 | 4 | 33,33 | ||||
| 2026-04-28 | 13F | Bogart Wealth, LLC | 100 | 1 | ||||||
| 2026-02-12 | 13F | Wealthspire Advisors, LLC | 0 | -100,00 | 0 | |||||
| 2026-04-20 | 13F | Banque Cantonale Vaudoise | 87.481 | 12,91 | 584 | 35,19 | ||||
| 2026-02-12 | 13F | Steward Partners Investment Advisory, Llc | 400 | 2 | ||||||
| 2026-02-17 | 13F | MIRAE ASSET GLOBAL ETFS HOLDINGS Ltd. | 3.239.522 | -13,69 | 18.083 | 44,32 | ||||
| 2026-02-13 | 13F | Truvestments Capital Llc | 200 | 0,00 | 1 | |||||
| 2026-04-16 | 13F | Quotient Wealth Partners, LLC | 24.350 | 3,62 | 163 | 23,66 | ||||
| 2026-02-13 | 13F | Quinn Opportunity Partners LLC | 0 | -100,00 | 0 | |||||
| 2026-02-17 | 13F | Millennium Management Llc | 2.200.722 | 441,08 | 12.281 | 804,94 | ||||
| 2026-02-17 | 13F | SIH Partners, LLLP | 0 | -100,00 | 0 | -100,00 | ||||
| 2026-04-08 | 13F | Thompson Investment Management, Inc. | 500 | 0,00 | 3 | 50,00 | ||||
| 2026-01-07 | 13F | Aventura Private Wealth, LLC | 0 | -100,00 | 0 | |||||
| 2026-02-13 | 13F | MAI Capital Management | 1.875 | 0,00 | 10 | 66,67 | ||||
| 2026-02-23 | 13F | Virtu Financial LLC | 0 | -100,00 | 0 | |||||
| 2026-02-17 | 13F | Raymond James Financial Inc | 16.829 | -18,35 | 94 | 36,76 | ||||
| 2026-02-11 | 13F | Simplex Trading, Llc | 0 | -100,00 | 0 | |||||
| 2026-04-15 | 13F | FNY Investment Advisers, LLC | 0 | -100,00 | 0 | |||||
| 2026-02-03 | 13F | McIlrath & Eck, LLC | 1.834 | 0,00 | 10 | 66,67 |