Grundlæggende statistik
| Institutionelle aktier (lange) | 27.539.254 - 30,00% (ex 13D/G) - change of 11,49MM shares 71,59% MRQ |
| Institutionel værdi (lang) | $ 111.409 USD ($1000) |
Institutionelt ejerskab og aktionærer
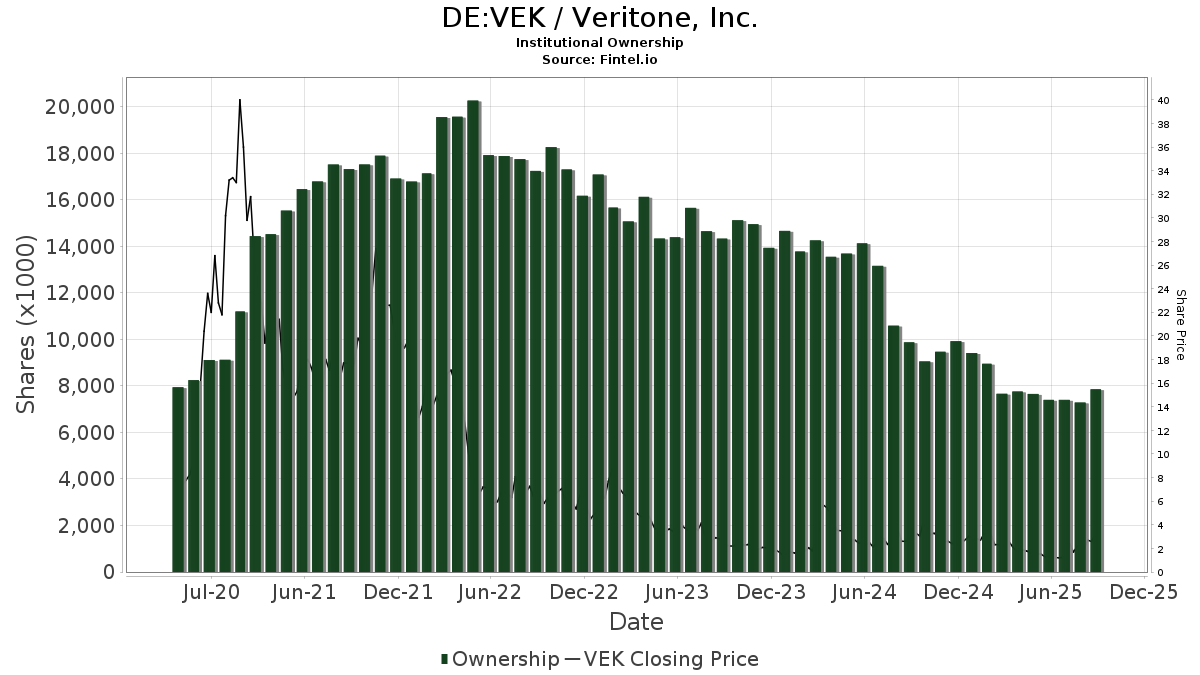
Veritone, Inc. (DE:VEK) har 101 institutionelle ejere og aktionærer, der har indsendt 13D/G- eller 13F-formularer til Securities Exchange Commission (SEC). Disse institutioner har i alt 27,539,254 aktier. Største aktionærer omfatter Vanguard Group Inc, Banta Asset Management Lp, Cooper Creek Partners Management Llc, BlackRock, Inc., Jane Street Group, Llc, Citadel Advisors Llc, Silvercrest Asset Management Group Llc, Thompson Siegel & Walmsley Llc, Millennium Management Llc, and Geode Capital Management, Llc .
Veritone, Inc. (DB:VEK) institutionel ejerskabsstruktur viser aktuelle positioner i virksomheden efter institutioner og fonde, samt seneste ændringer i positionsstørrelse. Større aktionærer kan omfatte individuelle investorer, investeringsforeninger, hedgefonde eller institutioner. Skema 13D angiver, at investoren besidder (eller besidder) mere end 5 % af virksomheden og har til hensigt (eller har til hensigt at) aktivt at forfølge en ændring i forretningsstrategi. Skema 13G indikerer en passiv investering på over 5%.
The share price as of March 31, 2026 is 1,51 / share. Previously, on April 1, 2025, the share price was 2,19 / share. This represents a decline of 31,14% over that period.
Fondens stemningsscore
Fund Sentiment Score (fka Ownership Accumulation Score) finder de aktier, der bliver mest købt af fonde. Det er resultatet af en sofistikeret, multi-faktor kvantitativ model, der identificerer virksomheder med de højeste niveauer af institutionel akkumulering. Scoringsmodellen bruger en kombination af den samlede stigning i oplyste ejere, ændringerne i porteføljeallokeringer i disse ejere og andre målinger. Tallet går fra 0 til 100, hvor højere tal indikerer et højere niveau af akkumulering for sine jævnaldrende, og 50 er gennemsnittet.
Opdateringsfrekvens: Dagligt
Se Ownership Explorer, som giver en liste over højest rangerende virksomheder.
AI+ Ask Fintel’s AI assistant about Veritone, Inc..
Select a question to share a public post with an AI-crafted answer.
Thinking of good questions…
13F og NPORT arkivering
Detaljer om 13F-arkivering er gratis. Detaljer om NP-ansøgninger kræver et premium-medlemskab. Grønne rækker angiver nye positioner. Røde rækker angiver lukkede positioner. Klik på linket ikon for at se den fulde transaktionshistorik.
Opgrader
for at låse premium-data op og eksportere til Excel ![]() .
.
| Fil dato | Kilde | Investor | Type | Gennemsnitlig pris (Øst) |
Aktier | Δ Aktier (%) |
Rapporteret Værdi ($1000) |
Δ Værdi (%) |
Port Alloc (%) |
|
|---|---|---|---|---|---|---|---|---|---|---|
| 2026-02-12 | 13F | Jane Street Group, Llc | Call | 76.800 | -60,98 | 357 | -62,34 | |||
| 2026-02-12 | 13F | Jane Street Group, Llc | 1.536.914 | 891,99 | 7.147 | 857,91 | ||||
| 2026-02-13 | 13F | SRS Capital Advisors, Inc. | 5 | 0,00 | 0 | |||||
| 2026-02-17 | 13F | Ameriprise Financial Inc | 24.680 | 0,00 | 115 | -3,39 | ||||
| 2026-02-13 | 13F | Marshall Wace, Llp | 0 | -100,00 | 0 | |||||
| 2026-02-12 | 13F | Commonwealth Equity Services, Llc | 11.527 | -17,89 | 54 | |||||
| 2026-02-13 | 13F | Motiv8 Investments LLC | 300 | 0 | ||||||
| 2026-02-13 | 13F | Squarepoint Ops LLC | 149.356 | 695 | ||||||
| 2026-02-17 | 13F | Quadrature Capital Ltd | 12.342 | -91,69 | 57 | -92,03 | ||||
| 2026-02-09 | 13F | Geode Capital Management, Llc | 984.749 | 81,40 | 4.581 | 75,05 | ||||
| 2026-02-17 | 13F | Raymond James Financial Inc | 28.978 | 135 | ||||||
| 2025-11-06 | 13F | Ground Swell Capital, LLC | 0 | -100,00 | 0 | -100,00 | ||||
| 2026-01-23 | 13F | DHJJ Financial Advisors, Ltd. | 100 | 0,00 | 0 | |||||
| 2026-02-17 | 13F | Jones Financial Companies Lllp | 1.170 | 0,00 | 5 | 0,00 | ||||
| 2026-02-17 | 13F | Royal Bank Of Canada | 15.399 | -93,94 | 72 | -94,12 | ||||
| 2026-02-12 | 13F | Renaissance Technologies Llc | 148.200 | 243,85 | 689 | 232,85 | ||||
| 2026-02-17 | 13F | Northern Trust Corp | 235.407 | 67,30 | 1.095 | 61,36 | ||||
| 2026-02-03 | 13F | Total Investment Management Inc | 22.500 | 0,00 | 105 | -3,70 | ||||
| 2026-02-06 | 13F | Gsa Capital Partners Llp | 137.577 | 1 | ||||||
| 2026-02-17 | 13F | Point72 Asset Management, L.P. | 303.106 | 1.409 | ||||||
| 2026-02-17 | 13F | Balyasny Asset Management Llc | 135.404 | 630 | ||||||
| 2025-10-27 | 13F | Kiker Wealth Management, LLC | 0 | -100,00 | 0 | -100,00 | ||||
| 2026-02-17 | 13F | Lighthouse Investment Partners, LLC | 18.660 | 87 | ||||||
| 2026-02-11 | 13F | Jpmorgan Chase & Co | 35 | -94,49 | 0 | -100,00 | ||||
| 2026-02-17 | 13F | XTX Topco Ltd | 0 | -100,00 | 0 | |||||
| 2026-01-14 | 13F | Tradewinds Capital Management, LLC | 5.025 | 390,24 | 23 | 475,00 | ||||
| 2026-02-02 | 13F | Benjamin Edwards Inc | 18.000 | 0,00 | 84 | -3,49 | ||||
| 2025-11-07 | 13F | Skandinaviska Enskilda Banken AB (publ) | 0 | -100,00 | 0 | -100,00 | ||||
| 2026-02-05 | 13F | Cambridge Investment Research Advisors, Inc. | 11.193 | 0 | ||||||
| 2026-01-30 | 13F | NJ State Employees Deferred Compensation Plan | 0 | -100,00 | 0 | -100,00 | ||||
| 2025-11-14 | 13F | Wolverine Trading, Llc | Put | 21.200 | 101 | |||||
| 2026-01-27 | 13F | Proffitt & Goodson Inc | 3.000 | 14 | ||||||
| 2026-02-13 | 13F | OMERS ADMINISTRATION Corp | 35.600 | 166 | ||||||
| 2026-02-13 | 13F | Walleye Capital LLC | Call | 32.700 | 152 | |||||
| 2026-02-13 | 13F | Walleye Capital LLC | Put | 5.600 | -70,68 | 26 | -71,74 | |||
| 2026-02-13 | 13F | Walleye Capital LLC | 1 | -99,99 | 0 | -100,00 | ||||
| 2026-02-11 | 13F | Franklin Resources Inc | 18.325 | 78,26 | 85 | 73,47 | ||||
| 2026-02-13 | 13F | Landscape Capital Management, L.l.c. | 30.455 | 142 | ||||||
| 2026-01-21 | 13F | Newbridge Financial Services Group, Inc. | 3.000 | 14 | ||||||
| 2026-01-29 | 13F | IMC-Chicago, LLC | 92.545 | 430 | ||||||
| 2026-01-29 | 13F | IMC-Chicago, LLC | Put | 55.900 | 260 | |||||
| 2026-01-29 | 13F | IMC-Chicago, LLC | Call | 62.700 | 14,21 | 292 | 10,23 | |||
| 2025-10-22 | 13F | North Star Investment Management Corp. | 0 | -100,00 | 0 | |||||
| 2026-02-11 | 13F | Group One Trading, L.p. | Put | 41.800 | -43,44 | 194 | -45,51 | |||
| 2026-02-11 | 13F | Group One Trading, L.p. | 176.042 | 67,77 | 819 | 61,98 | ||||
| 2026-02-11 | 13F | Group One Trading, L.p. | Call | 191.700 | -9,15 | 891 | -12,39 | |||
| 2026-02-17 | 13F | Tower Research Capital LLC (TRC) | 19.569 | 91 | ||||||
| 2026-02-17 | 13F | Silvercrest Asset Management Group Llc | 1.226.898 | 0,29 | 5.705 | -3,24 | ||||
| 2026-02-09 | 13F | Jefferies Financial Group Inc. | 25.130 | 47,82 | 117 | 43,21 | ||||
| 2026-01-27 | 13F | GHP Investment Advisors, Inc. | 344 | 0,00 | 2 | 0,00 | ||||
| 2026-02-13 | 13F | Citigroup Inc | 40.249 | 118,47 | 187 | 112,50 | ||||
| 2026-02-17 | 13F | Cooper Creek Partners Management Llc | 2.316.968 | -4,69 | 11 | -9,09 | ||||
| 2026-02-17 | 13F | Two Sigma Advisers, Lp | 110.667 | 401,44 | 515 | 384,91 | ||||
| 2026-02-13 | 13F | Charles Schwab Investment Management Inc | 50.947 | 154,23 | 237 | 145,83 | ||||
| 2026-02-05 | 13F | Allworth Financial LP | 3.500 | 0,00 | 16 | 0,00 | ||||
| 2026-02-09 | 13F | Royce & Associates Lp | 866.000 | 60,37 | 4.027 | 54,73 | ||||
| 2026-02-09 | 13F | Themes Management Co LLC | 591.429 | 2.750 | ||||||
| 2026-01-30 | 13F | Citizens Financial Group Inc/ri | 27.711 | 1,72 | 129 | -2,29 | ||||
| 2026-02-17 | 13F | 683 Capital Management, LLC | 191.517 | 891 | ||||||
| 2026-02-13 | 13F | Hurley Capital, LLC | 100 | 0,00 | 0 | |||||
| 2026-01-29 | 13F | Vanguard Group Inc | 4.401.041 | 59,80 | 20.465 | 54,15 | ||||
| 2026-02-10 | 13F | Thompson Siegel & Walmsley Llc | 1.063.370 | -3,26 | 5 | -20,00 | ||||
| 2026-02-17 | 13F | Bank Of America Corp /de/ | 286.703 | 654,84 | 1.333 | 628,42 | ||||
| 2026-02-05 | 13F | Northwestern Mutual Wealth Management Co | 2.300 | 76.566,67 | 75 | |||||
| 2026-02-17 | 13F | Price T Rowe Associates Inc /md/ | 59.674 | 0,00 | 0 | |||||
| 2026-02-17 | 13F | Shay Capital LLC | Call | 60.000 | 279 | |||||
| 2026-02-13 | 13F | Caitong International Asset Management Co., Ltd | 0 | -100,00 | 0 | |||||
| 2026-02-17 | 13F | Schonfeld Strategic Advisors LLC | 154.107 | 717 | ||||||
| 2026-01-29 | 13F | UBS Group AG | Call | 372.000 | -50,05 | 1.730 | -51,83 | |||
| 2026-02-09 | 13F | Hantz Financial Services, Inc. | 0 | -100,00 | 0 | |||||
| 2026-01-29 | 13F | UBS Group AG | 622.373 | 41,71 | 2.894 | 36,77 | ||||
| 2025-11-17 | 13F | Connective Capital Management, LLC | 0 | -100,00 | 0 | -100,00 | ||||
| 2026-01-23 | 13F | Farther Finance Advisors, LLC | 44.090 | 17,29 | 205 | 13,26 | ||||
| 2026-02-10 | 13F | Goldman Sachs Group Inc | 669.515 | 106,43 | 3.113 | 99,17 | ||||
| 2026-02-17 | 13F | Two Sigma Investments, Lp | 937.197 | 102,30 | 4.358 | 95,21 | ||||
| 2026-02-10 | 13F | State of Wyoming | 5.327 | 25 | ||||||
| 2026-01-16 | 13F | Vanguard Capital Wealth Advisors This fund is a listed as child fund of Vanguard Group Inc and if that institution has disclosed ownership in this security, then these positions will not be double counted when calculating total shares and total value | 71.450 | 11,03 | 332 | 7,10 | ||||
| 2026-02-17 | 13F | Citadel Advisors Llc | Call | 235.400 | 9,34 | 1.095 | 5,50 | |||
| 2026-02-17 | 13F | Citadel Advisors Llc | 1.289.695 | 444,69 | 5.997 | 425,59 | ||||
| 2026-02-03 | 13F | SBI Securities Co., Ltd. | 6.493 | 0,62 | 30 | -3,23 | ||||
| 2026-02-12 | 13F | EntryPoint Capital, LLC | 18.041 | 84 | ||||||
| 2026-02-13 | 13F | Wells Fargo & Company/mn | 20.460 | 450,00 | 95 | 458,82 | ||||
| 2026-02-17 | 13F | Citadel Advisors Llc | Put | 248.800 | 549,61 | 1.157 | 528,26 | |||
| 2026-02-17 | 13F | Millennium Management Llc | 1.010.755 | 2.069,56 | 4.700 | 1.998,21 | ||||
| 2026-02-17 | 13F | Susquehanna International Group, Llp | 812.545 | 1.507,28 | 3.778 | 1.454,73 | ||||
| 2026-02-13 | 13F | State Street Corp | 417.481 | 91,62 | 1.941 | 84,86 | ||||
| 2026-02-11 | 13F | Winton Capital Group Ltd | 25.900 | 120 | ||||||
| 2026-02-17 | 13F | Susquehanna International Group, Llp | Put | 393.800 | 49,62 | 1.831 | 44,40 | |||
| 2026-02-17 | 13F | Susquehanna International Group, Llp | Call | 273.000 | -67,77 | 1.269 | -68,91 | |||
| 2025-10-07 | 13F | Salem Investment Counselors Inc | 0 | -100,00 | 0 | |||||
| 2026-02-03 | 13F | Wesbanco Bank Inc | 0 | -100,00 | 0 | -100,00 | ||||
| 2026-02-12 | 13F | BlackRock, Inc. | 1.586.624 | 71,13 | 7.378 | 65,11 | ||||
| 2026-02-06 | 13F | Global Retirement Partners, LLC | 0 | -100,00 | 0 | |||||
| 2026-02-17 | 13F | Bridgeway Capital Management Inc | 71.200 | 0,00 | 331 | -3,50 | ||||
| 2026-02-11 | 13F | Simplex Trading, Llc | Put | 11.700 | -77,19 | 54 | ||||
| 2026-01-15 | 13F | Fortitude Family Office, LLC | 329 | 0,00 | 2 | 0,00 | ||||
| 2026-02-12 | 13F | Hrt Financial Lp | 0 | -100,00 | 0 | |||||
| 2026-02-13 | 13F | Jacobs Levy Equity Management, Inc | 109.005 | 507 | ||||||
| 2026-02-11 | 13F | Simplex Trading, Llc | 33.564 | -60,25 | 156 | |||||
| 2026-01-13 | 13F | CoreCap Advisors, LLC | 34 | 0,00 | 0 | |||||
| 2026-02-10 | 13F | Bnp Paribas Arbitrage, Sa | 100.476 | 13.296,80 | 467 | 15.466,67 | ||||
| 2026-02-11 | 13F | Simplex Trading, Llc | Call | 306.500 | 295,48 | 1.425 | ||||
| 2026-01-21 | 13F | Signature Resources Capital Management, LLC | 1.319 | 0,00 | 6 | 0,00 | ||||
| 2026-02-12 | 13F | Front Row Advisors LLC | 150 | 0,00 | 1 | |||||
| 2026-02-04 | 13F | Perkins Capital Management Inc | 175.600 | 817 | ||||||
| 2026-02-13 | 13F | Quarry LP | 185 | 1 | ||||||
| 2026-02-10 | 13F | KERR FINANCIAL PLANNING Corp | 500 | 0,00 | 2 | -50,00 | ||||
| 2025-11-14 | 13F | Wolverine Trading, Llc | 30.577 | 146 | ||||||
| 2025-11-14 | 13F | Wolverine Trading, Llc | Call | 60.200 | 288 | |||||
| 2026-01-12 | 13F | Thompson Davis & Co., Inc. | 20.400 | 95 | ||||||
| 2026-02-13 | 13F | Barclays Plc | 266.042 | 4.252,07 | 1.237 | 5.790,48 | ||||
| 2026-02-13 | 13F | Hudson Bay Capital Management LP | 117.842 | 548 | ||||||
| 2026-02-09 | 13F | Huntington National Bank | 1 | 0,00 | 0 | |||||
| 2026-02-12 | 13F | Bank Of Montreal /can/ | 20.596 | 13,19 | 96 | 9,20 | ||||
| 2026-02-17 | 13F | Sherbrooke Park Advisers Llc | 0 | -100,00 | 0 | |||||
| 2025-11-14 | 13F | Strategic Wealth Partners, Ltd. | 975 | 0,00 | 5 | 300,00 | ||||
| 2026-02-13 | 13F | Morgan Stanley | 193.496 | 294,30 | 900 | 280,93 | ||||
| 2026-02-17 | 13F | Fmr Llc | 2.343 | 163,85 | 11 | 150,00 | ||||
| 2025-11-13 | 13F | Silverback Asset Management Llc | 0 | -100,00 | 0 | |||||
| 2026-02-17 | 13F | CWM Advisors, LLC | 101.536 | 472 | ||||||
| 2026-01-29 | 13F | UMA Financial Services, Inc. | 441 | 0,00 | 2 | 0,00 | ||||
| 2026-02-17 | 13F | Jain Global LLC | 26.300 | 122 | ||||||
| 2025-11-14 | 13F | Eqis Capital Management, Inc. | 0 | -100,00 | 0 | -100,00 | ||||
| 2026-02-17 | 13F | Qube Research & Technologies Ltd | 187.179 | 870 | ||||||
| 2026-01-09 | 13F | Zrc Wealth Management, Llc | 61 | 0,00 | 0 | |||||
| 2026-02-17 | 13F | Advisor Group Holdings, Inc. | 5.240 | 31,33 | 24 | 50,00 | ||||
| 2026-02-17 | 13F | Davidson Kempner Capital Management Lp | 200.000 | -42,86 | 930 | -44,87 | ||||
| 2025-10-29 | 13F | Bfsg, Llc | 0 | -100,00 | 0 | -100,00 | ||||
| 2025-10-08 | 13F/A | New York State Common Retirement Fund | 0 | -100,00 | 0 | |||||
| 2026-02-17 | 13F | Jump Financial, LLC | 100.891 | 469 | ||||||
| 2026-02-11 | 13F | LPL Financial LLC | 45.938 | 55,95 | 214 | 51,06 | ||||
| 2026-02-13 | 13F | Kestra Advisory Services, LLC | 0 | -100,00 | 0 | |||||
| 2026-02-13 | 13F | Centiva Capital, LP | 12.249 | 57 | ||||||
| 2026-02-23 | 13F | Virtu Financial LLC | 0 | -100,00 | 0 | |||||
| 2025-10-23 | 13F | Spire Wealth Management | 0 | -100,00 | 0 | -100,00 | ||||
| 2026-01-29 | 13F | Comerica Bank | 4.212 | 0,00 | 20 | -5,00 | ||||
| 2026-02-12 | 13F | Federation des caisses Desjardins du Quebec | 7.900 | -22,55 | 37 | -26,53 | ||||
| 2025-11-13 | 13F | Private Management Group Inc | 0 | -100,00 | 0 | -100,00 | ||||
| 2026-02-13 | 13F | Walleye Trading LLC | Put | 21.300 | 99 | |||||
| 2026-02-13 | 13F | Walleye Trading LLC | Call | 1.200 | 6 | |||||
| 2026-02-09 | 13F | Banta Asset Management Lp | 2.638.358 | 8,05 | 12.268 | 177,62 |