Grundlæggende statistik
| Institutionelle aktier (lange) | 8.433.793 - 29,42% (ex 13D/G) - change of -1,75MM shares -17,16% MRQ |
| Institutionel værdi (lang) | $ 987.490 USD ($1000) |
Institutionelt ejerskab og aktionærer
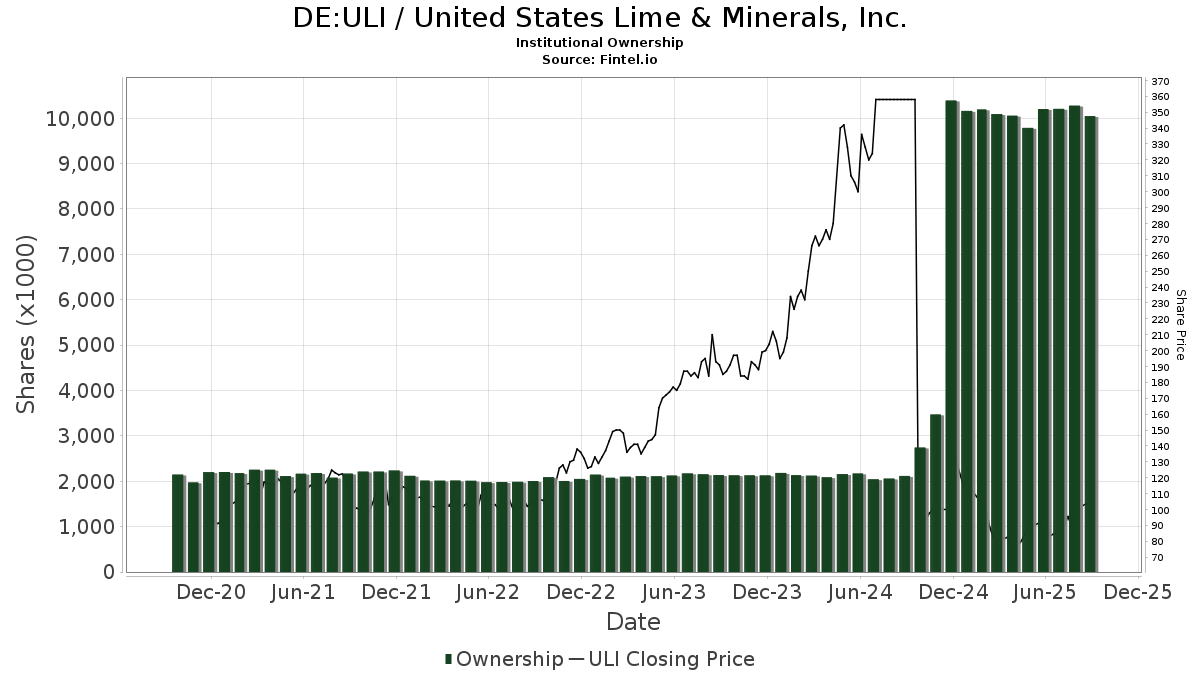
United States Lime & Minerals, Inc. (DE:ULI) har 228 institutionelle ejere og aktionærer, der har indsendt 13D/G- eller 13F-formularer til Securities Exchange Commission (SEC). Disse institutioner har i alt 8,433,793 aktier. Største aktionærer omfatter BlackRock, Inc., Vanguard Group Inc, Dimensional Fund Advisors Lp, Renaissance Technologies Llc, Select Equity Group, L.P., Geode Capital Management, Llc, Goldman Sachs Group Inc, William Blair Investment Management, Llc, MIRAE ASSET GLOBAL ETFS HOLDINGS Ltd., and First Trust Advisors Lp .
United States Lime & Minerals, Inc. (DB:ULI) institutionel ejerskabsstruktur viser aktuelle positioner i virksomheden efter institutioner og fonde, samt seneste ændringer i positionsstørrelse. Større aktionærer kan omfatte individuelle investorer, investeringsforeninger, hedgefonde eller institutioner. Skema 13D angiver, at investoren besidder (eller besidder) mere end 5 % af virksomheden og har til hensigt (eller har til hensigt at) aktivt at forfølge en ændring i forretningsstrategi. Skema 13G indikerer en passiv investering på over 5%.
The share price as of April 24, 2026 is 110,00 / share. Previously, on April 28, 2025, the share price was 79,95 / share. This represents an increase of 37,59% over that period.
Fondens stemningsscore
Fund Sentiment Score (fka Ownership Accumulation Score) finder de aktier, der bliver mest købt af fonde. Det er resultatet af en sofistikeret, multi-faktor kvantitativ model, der identificerer virksomheder med de højeste niveauer af institutionel akkumulering. Scoringsmodellen bruger en kombination af den samlede stigning i oplyste ejere, ændringerne i porteføljeallokeringer i disse ejere og andre målinger. Tallet går fra 0 til 100, hvor højere tal indikerer et højere niveau af akkumulering for sine jævnaldrende, og 50 er gennemsnittet.
Opdateringsfrekvens: Dagligt
Se Ownership Explorer, som giver en liste over højest rangerende virksomheder.
AI+ Ask Fintel’s AI assistant about United States Lime & Minerals, Inc..
Select a question to share a public post with an AI-crafted answer.
Thinking of good questions…
13F og NPORT arkivering
Detaljer om 13F-arkivering er gratis. Detaljer om NP-ansøgninger kræver et premium-medlemskab. Grønne rækker angiver nye positioner. Røde rækker angiver lukkede positioner. Klik på linket ikon for at se den fulde transaktionshistorik.
Opgrader
for at låse premium-data op og eksportere til Excel ![]() .
.
| Fil dato | Kilde | Investor | Type | Gennemsnitlig pris (Øst) |
Aktier | Δ Aktier (%) |
Rapporteret Værdi ($1000) |
Δ Værdi (%) |
Port Alloc (%) |
|
|---|---|---|---|---|---|---|---|---|---|---|
| 2026-02-06 | 13F | Global Retirement Partners, LLC | 243 | 29 | ||||||
| 2026-01-29 | 13F | Copeland Capital Management, LLC | 185.956 | 22,83 | 22.266 | 11,80 | ||||
| 2026-02-10 | 13F | Bnp Paribas Arbitrage, Sa | 5.806 | 11,72 | 695 | 1,76 | ||||
| 2026-01-13 | 13F | Cadent Capital Advisors, LLC | 0 | -100,00 | 0 | |||||
| 2026-02-17 | 13F | Tudor Investment Corp Et Al | 34.971 | 4.187 | ||||||
| 2026-04-22 | 13F | Sterling Capital Management LLC | 70 | -2,78 | 9 | 12,50 | ||||
| 2025-11-14 | 13F | Larson Financial Group LLC | 0 | -100,00 | 0 | |||||
| 2026-02-12 | 13F | Brown Brothers Harriman & Co | 103 | -10,43 | 12 | -20,00 | ||||
| 2026-02-04 | 13F | Virginia Retirement Systems Et Al | 2.800 | 0,00 | 335 | -8,97 | ||||
| 2026-02-13 | 13F | Manufacturers Life Insurance Company, The | 5.590 | -6,18 | 669 | -14,56 | ||||
| 2026-02-09 | 13F | Quest Partners LLC | 2.659 | -6,04 | 318 | -14,52 | ||||
| 2026-04-07 | 13F/A | Round Rock Advisors, LLC | 10.887 | 69,58 | 1.304 | 50,29 | ||||
| 2025-11-17 | 13F | FSA Wealth Management LLC | 49 | 0,00 | 6 | 50,00 | ||||
| 2025-11-06 | 13F | Navellier & Associates Inc | 0 | -100,00 | 0 | |||||
| 2025-11-14 | 13F | Voleon Capital Management Lp | 0 | -100,00 | 0 | |||||
| 2026-02-18 | 13F | State of Tennessee, Treasury Department | 0 | -100,00 | 0 | |||||
| 2026-02-13 | 13F | Centiva Capital, LP | 0 | -100,00 | 0 | |||||
| 2025-11-13 | 13F | EntryPoint Capital, LLC | 0 | -100,00 | 0 | |||||
| 2026-02-09 | 13F | Green Square Capital Advisors Llc | 1.752 | 210 | ||||||
| 2026-02-11 | 13F | Deutsche Bank Ag\ | 10.166 | -63,02 | 1.217 | -66,34 | ||||
| 2026-04-08 | 13F | Cardinal Capital Management | 44.539 | 0,06 | 5.817 | 9,16 | ||||
| 2026-04-23 | 13F | CBOE Vest Financial, LLC | 31.988 | 130,11 | 4.178 | 151,02 | ||||
| 2026-02-06 | 13F | ProShare Advisors LLC | 1.979 | 6,80 | 237 | -2,88 | ||||
| 2026-02-11 | 13F | Inceptionr Llc | 0 | -100,00 | 0 | |||||
| 2026-02-13 | 13F | Citigroup Inc | 6.014 | 17,60 | 720 | 7,14 | ||||
| 2026-04-24 | 13F | Root Financial Partners, LLC | 75 | 36,36 | 10 | 50,00 | ||||
| 2026-02-05 | 13F | HFM Investment Advisors, LLC | 2 | 0,00 | 0 | |||||
| 2026-02-10 | 13F | Envestnet Asset Management Inc | 27.066 | 27,92 | 3.241 | 16,42 | ||||
| 2026-02-10 | 13F | Intech Investment Management Llc | 4.713 | 0,00 | 564 | -8,89 | ||||
| 2026-02-13 | 13F | Verition Fund Management LLC | 15.631 | -37,40 | 1.872 | -43,03 | ||||
| 2026-02-10 | 13F | Bank of New York Mellon Corp | 63.874 | 11,57 | 7.648 | 1,55 | ||||
| 2026-02-13 | 13F | State Street Corp | 237.405 | -1,57 | 28.427 | -10,41 | ||||
| 2026-01-28 | 13F | Universal- Beteiligungs- und Servicegesellschaft mbH | 13.356 | 12,78 | 1.612 | 3,53 | ||||
| 2026-02-11 | 13F | Empowered Funds, LLC | 347 | 42 | ||||||
| 2026-04-20 | 13F | Contravisory Investment Management, Inc. | 538 | -18,11 | 70 | -10,26 | ||||
| 2026-02-05 | 13F | Am Investment Strategies Llc | 15.000 | 0,00 | 2 | 0,00 | ||||
| 2026-02-11 | 13F | Vestcor Inc | 3.146 | 0,00 | 0 | |||||
| 2026-02-13 | 13F | Charles Schwab Investment Management Inc | 88.364 | -3,05 | 10.581 | -11,75 | ||||
| 2026-01-23 | 13F | Avion Wealth | 5 | 0,00 | 0 | |||||
| 2025-11-14 | 13F | Point72 Asia (Singapore) Pte. Ltd. | 0 | -100,00 | 0 | |||||
| 2026-04-07 | 13F | Signaturefd, Llc | 63 | 70,27 | 8 | 100,00 | ||||
| 2026-02-17 | 13F | Susquehanna International Group, Llp | Call | 6.000 | 33,33 | 718 | 21,49 | |||
| 2026-02-03 | 13F | McIlrath & Eck, LLC | 192 | 23 | ||||||
| 2026-02-12 | 13F | Triumph Capital Management | 50 | 6 | ||||||
| 2026-02-17 | 13F | Kemnay Advisory Services Inc. | 42 | 5 | ||||||
| 2026-01-29 | 13F | Comerica Bank | 827 | 28,62 | 99 | 17,86 | ||||
| 2026-02-17 | 13F | Susquehanna International Group, Llp | 29.122 | -35,64 | 3.487 | -41,41 | ||||
| 2026-04-22 | 13F | Janney Montgomery Scott LLC | 6.337 | 0,49 | 1 | |||||
| 2026-02-17 | 13F | Susquehanna International Group, Llp | Put | 1.700 | -22,73 | 204 | -29,76 | |||
| 2026-02-11 | 13F | Parallel Advisors, LLC | 453 | -0,66 | 54 | -8,47 | ||||
| 2026-02-12 | 13F | BlackRock, Inc. | 1.014.232 | 2,11 | 121.444 | -7,05 | ||||
| 2026-01-21 | 13F | Kaizen Financial Strategies | 4.978 | -7,87 | 596 | -3,40 | ||||
| 2026-04-16 | 13F | Ellsworth Advisors, LLC | 0 | -100,00 | 0 | |||||
| 2026-04-23 | 13F | SJS Investment Consulting Inc. | 5 | 150,00 | 1 | |||||
| 2026-02-13 | 13F | Wells Fargo & Company/mn | 14.391 | 111,20 | 1.723 | 92,30 | ||||
| 2026-02-09 | 13F | Keating Financial Advisory Services, Inc. | 9 | 1 | ||||||
| 2026-04-23 | 13F | Marquette Asset Management, LLC | 5 | 1 | ||||||
| 2026-02-12 | 13F | CIBC Private Wealth Group, LLC | 820 | 0,00 | 98 | -8,41 | ||||
| 2026-04-06 | 13F | GAMMA Investing LLC | 205 | 4,06 | 27 | 13,04 | ||||
| 2026-02-02 | 13F | Principal Financial Group Inc | 19.154 | 53,96 | 2.294 | 40,16 | ||||
| 2026-02-09 | 13F | Royce & Associates Lp | 57.620 | 4,08 | 6.899 | -5,27 | ||||
| 2026-02-12 | 13F | Jane Street Group, Llc | 3.279 | -86,56 | 393 | -87,78 | ||||
| 2026-02-13 | 13F | Squarepoint Ops LLC | 0 | -100,00 | 0 | |||||
| 2026-02-05 | 13F | Td Private Client Wealth Llc | 0 | -100,00 | 0 | |||||
| 2026-02-13 | 13F | Kestra Advisory Services, LLC | 1.235 | 148 | ||||||
| 2026-02-13 | 13F | MAI Capital Management | 4 | 0 | ||||||
| 2026-02-17 | 13F | State Of Wisconsin Investment Board | 0 | -100,00 | 0 | |||||
| 2026-04-13 | 13F | True Wealth Design, LLC | 62 | 0,00 | 8 | 14,29 | ||||
| 2026-02-17 | 13F | California State Teachers Retirement System | 10.522 | -0,09 | 1.260 | -9,10 | ||||
| 2026-02-11 | 13F | LPL Financial LLC | 4.838 | -19,71 | 579 | -26,89 | ||||
| 2026-04-22 | 13F | J. Team Financial, Inc. | 1.635 | -47,80 | 213 | -43,05 | ||||
| 2026-02-17 | 13F | Janus Henderson Group Plc | 4.905 | 0,00 | 587 | -9,15 | ||||
| 2026-02-17 | 13F | Lazard Asset Management Llc | 39.119 | 4,26 | 4.684 | -5,09 | ||||
| 2026-04-24 | 13F | James Investment Research Inc | 7.966 | 0,00 | 1.040 | 9,13 | ||||
| 2026-02-13 | 13F | Rhumbline Advisers | 19.267 | -12,48 | 2.307 | -20,31 | ||||
| 2026-04-24 | 13F | Strs Ohio | 6.000 | 0,00 | 784 | 9,05 | ||||
| 2026-01-29 | 13F | UBS Group AG | 22.330 | -18,43 | 2.674 | -25,77 | ||||
| 2026-02-12 | 13F | Aviva Plc | 4.025 | 4,90 | 482 | -4,56 | ||||
| 2026-02-09 | 13F | Hartland & Co., LLC | 0 | -100,00 | 0 | |||||
| 2026-04-08 | 13F | DiNuzzo Private Wealth, Inc. | 4 | 33,33 | 1 | |||||
| 2026-02-04 | 13F | Garrett Wealth Advisory Group, LLC | 2.500 | 0,00 | 299 | -8,84 | ||||
| 2026-02-13 | 13F | Caitong International Asset Management Co., Ltd | 0 | -100,00 | 0 | |||||
| 2026-02-12 | 13F | Quadrant Capital Group Llc | 1.781 | 0,00 | 213 | -8,97 | ||||
| 2026-04-23 | 13F | North Star Investment Management Corp. | 32.550 | -15,56 | 4.251 | -7,89 | ||||
| 2026-02-05 | 13F | Bessemer Group Inc | 1.959 | 31,48 | 0 | |||||
| 2026-02-17 | 13F | Northern Trust Corp | 123.791 | 0,14 | 14.823 | -8,85 | ||||
| 2026-04-06 | 13F | Versant Capital Management, Inc | 303 | 15,65 | 40 | 25,81 | ||||
| 2026-02-17 | 13F | D. E. Shaw & Co., Inc. | 18.027 | 0,56 | 2.159 | -8,48 | ||||
| 2026-04-20 | 13F | City State Bank | 0 | -100,00 | 0 | |||||
| 2025-11-12 | 13F/A | Norges Bank | 6.600 | 32,00 | 645 | -64,62 | ||||
| 2026-04-07 | 13F | Farther Finance Advisors, LLC | 288 | 1,77 | 39 | 18,18 | ||||
| 2026-02-13 | 13F | Smartleaf Asset Management LLC | 34 | 0,00 | 4 | 0,00 | ||||
| 2026-02-17 | 13F | Price T Rowe Associates Inc /md/ | 6.482 | 9,72 | 1 | |||||
| 2026-02-17 | 13F | Optiver Holding B.V. | 0 | -100,00 | 0 | |||||
| 2026-02-13 | 13F | Entropy Technologies, LP | 1.800 | 216 | ||||||
| 2026-02-17 | 13F | Occudo Quantitative Strategies Lp | 1.769 | -73,16 | 212 | -75,64 | ||||
| 2026-04-16 | 13F | Thompson Davis & Co., Inc. | 1.575 | 206 | ||||||
| 2026-01-23 | 13F | Curbstone Financial Management Corp | 0 | -100,00 | 0 | |||||
| 2025-11-21 | 13F | Nebula Research & Development LLC | 0 | -100,00 | 0 | |||||
| 2026-02-05 | 13F | SkyOak Wealth, LLC | 2.681 | -4,56 | 321 | -13,01 | ||||
| 2026-02-12 | 13F | State Board Of Administration Of Florida Retirement System | 2.654 | 0,00 | 318 | -9,17 | ||||
| 2026-02-11 | 13F | Cerity Partners LLC | 4.284 | -19,03 | 513 | -26,44 | ||||
| 2026-02-18 | 13F | GWM Advisors LLC | 1.985 | 238 | ||||||
| 2026-02-12 | 13F | MetLife Investment Management, LLC | 6.018 | -5,87 | 721 | -14,29 | ||||
| 2026-02-12 | 13F | Renaissance Technologies Llc | 639.342 | -6,35 | 76.555 | -14,75 | ||||
| 2026-02-13 | 13F | Great West Life Assurance Co /can/ | 1.540 | 0,00 | 0 | |||||
| 2026-02-17 | 13F | Ameriprise Financial Inc | 11.331 | -8,86 | 1.357 | -17,06 | ||||
| 2026-02-17 | 13F | Jones Financial Companies Lllp | 844 | -16,77 | 101 | -22,90 | ||||
| 2026-04-15 | 13F | Exchange Traded Concepts, Llc | 24.434 | 11.936,45 | 3.191 | 13.195,83 | ||||
| 2026-02-10 | 13F | Td Asset Management Inc | 10.946 | 0,00 | 1.311 | -8,96 | ||||
| 2026-02-17 | 13F | SageView Advisory Group, LLC | 156 | 19 | ||||||
| 2025-11-14 | 13F | Binnacle Investments Inc | 52 | 7 | ||||||
| 2026-02-17 | 13F | Advisory Services Network, LLC | 0 | -100,00 | 0 | |||||
| 2026-02-13 | 13F | Quarry LP | 55 | -78,00 | 7 | -81,25 | ||||
| 2026-04-17 | 13F | Vermillion Wealth Management, Inc. | 2 | 0 | ||||||
| 2026-02-17 | 13F | Royal Bank Of Canada | 11.634 | 30,82 | 1.393 | 19,06 | ||||
| 2026-02-10 | 13F | State of Wyoming | 1.119 | 134 | ||||||
| 2026-02-05 | 13F | Allworth Financial LP | 112 | 41,77 | 13 | 30,00 | ||||
| 2026-02-17 | 13F | Dark Forest Capital Management Lp | 18.452 | 311,97 | 2.209 | 275,04 | ||||
| 2026-01-08 | 13F | Sound View Wealth Advisors Group, LLC | 4.500 | 0,00 | 539 | -8,97 | ||||
| 2026-02-12 | 13F | JT Stratford LLC | 0 | -100,00 | 0 | |||||
| 2026-01-29 | 13F | Vanguard Group Inc | 927.176 | 6,79 | 111.020 | -2,79 | ||||
| 2026-01-30 | 13F | Us Bancorp \de\ | 74 | -11,90 | 9 | -27,27 | ||||
| 2026-02-12 | 13F | Dimensional Fund Advisors Lp | 753.290 | -1,69 | 90.205 | -10,51 | ||||
| 2025-11-14 | 13F | ExodusPoint Capital Management, LP | 11.492 | -43,79 | 1.512 | 75.450,00 | ||||
| 2026-02-12 | 13F | Hrt Financial Lp | 15.613 | 2 | ||||||
| 2026-04-08 | 13F | Wealth Enhancement Advisory Services, Llc | 3.716 | -25,61 | 504 | -20,75 | ||||
| 2026-02-09 | 13F | Minerva Advisors LLC | 6.250 | 0,00 | 748 | -9,00 | ||||
| 2026-02-12 | 13F | Cloud Capital Management, LLC | 0 | -100,00 | 0 | |||||
| 2026-04-20 | 13F | Jfs Wealth Advisors, Llc | 13 | -18,75 | 2 | 0,00 | ||||
| 2026-01-26 | 13F | Cwm, Llc | 4.133 | -14,45 | 0 | |||||
| 2026-02-06 | 13F | Gsa Capital Partners Llp | 0 | -100,00 | 0 | |||||
| 2026-02-17 | 13F | Engineers Gate Manager LP | 0 | -100,00 | 0 | -100,00 | ||||
| 2025-11-14 | 13F | Axa S.a. | 0 | -100,00 | 0 | |||||
| 2026-02-17 | 13F | Quantinno Capital Management LP | 4.721 | 81,30 | 565 | 65,20 | ||||
| 2026-02-13 | 13F | American Century Companies Inc | 8.543 | 53,35 | 1.023 | 39,62 | ||||
| 2026-02-12 | 13F | Nuveen, LLC | 18.898 | 0,00 | 2.263 | -9,01 | ||||
| 2026-02-13 | 13F | Parkside Financial Bank & Trust | 5 | 0,00 | 1 | |||||
| 2026-01-28 | 13F | Arizona State Retirement System | 3.191 | -5,51 | 382 | -13,96 | ||||
| 2026-04-20 | 13F | Fiduciary Alliance LLC | 1.860 | 0,00 | 249 | 11,71 | ||||
| 2026-02-13 | 13F | Police & Firemen's Retirement System of New Jersey | 3.024 | 0,93 | 362 | -8,12 | ||||
| 2025-11-14 | 13F | Credit Agricole S A | 0 | -100,00 | 0 | -100,00 | ||||
| 2026-04-14 | 13F | Davidson Capital Management Inc. | 42.334 | 42.661,62 | 5.529 | 50.163,64 | ||||
| 2026-02-24 | 13F | MidFirst Bank | 4 | 0 | ||||||
| 2026-02-19 | 13F | Invesco Ltd. | 116.762 | -24,76 | 13.981 | -31,52 | ||||
| 2026-02-17 | 13F | Cetera Investment Advisers | 3.108 | 13,14 | 372 | 3,05 | ||||
| 2026-02-12 | 13F | Voya Investment Management Llc | 2.001 | 0,00 | 240 | -9,13 | ||||
| 2025-11-17 | 13F | Kestra Investment Management, LLC | 0 | -100,00 | 0 | |||||
| 2026-02-13 | 13F | Ubs Asset Management Americas Inc | 30.908 | 96,83 | 3.701 | 79,18 | ||||
| 2026-04-14 | 13F | Bay Harbor Wealth Management, LLC | 1 | 0,00 | 0 | |||||
| 2026-04-23 | 13F | Oppenheimer & Co Inc | 6.127 | 800 | ||||||
| 2026-02-13 | 13F | Pathstone Holdings, LLC | 3.632 | -3,15 | 435 | -11,97 | ||||
| 2026-04-16 | 13F | SG Americas Securities, LLC | 7.438 | 2,42 | 1 | |||||
| 2026-02-17 | 13F | Brevan Howard Capital Management LP | 2.766 | -40,54 | 331 | -45,83 | ||||
| 2026-01-28 | 13F | Klp Kapitalforvaltning As | 2.500 | 13,64 | 299 | 3,46 | ||||
| 2026-02-17 | 13F | DZ BANK AG Deutsche Zentral Genossenschafts Bank, Frankfurt am Main | 0 | -100,00 | 0 | |||||
| 2026-02-13 | 13F | Cynosure Management, Llc | 3.550 | -57,98 | 425 | -61,75 | ||||
| 2026-04-20 | 13F | Yorktown Management & Research Co Inc | 6.225 | 0,00 | 813 | 9,13 | ||||
| 2026-04-20 | 13F | Ronald Blue Trust, Inc. | 72 | -29,41 | 9 | -25,00 | ||||
| 2026-02-09 | 13F | CBIZ Investment Advisory Services, LLC | 140 | 32,08 | 17 | 23,08 | ||||
| 2026-02-13 | 13F | Morgan Stanley | 70.922 | 11,96 | 8.492 | 1,92 | ||||
| 2026-02-17 | 13F | Alliancebernstein L.p. | 29.560 | 0,00 | 3.540 | -8,98 | ||||
| 2026-01-28 | 13F | Teacher Retirement System Of Texas | 3.684 | -30,32 | 441 | -36,55 | ||||
| 2026-02-09 | 13F | William Blair Investment Management, Llc | 272.857 | -18,09 | 32.672 | -25,44 | ||||
| 2026-02-17 | 13F | Citadel Advisors Llc | 39.426 | 124,04 | 4.721 | 103,89 | ||||
| 2026-02-17 | 13F | T. Rowe Price Investment Management, Inc. | 10.902 | -96,54 | 1 | -97,56 | ||||
| 2026-02-06 | 13F | Handelsbanken Fonder AB | 3.100 | 3,33 | 0 | |||||
| 2026-04-13 | 13F | Trust Co | 3 | 0,00 | 0 | |||||
| 2026-02-17 | 13F | Citadel Advisors Llc | Put | 3.600 | 50,00 | 431 | 36,83 | |||
| 2025-11-07 | 13F | Amica Retiree Medical Trust | 334 | 413,85 | 0 | |||||
| 2025-10-30 | 13F | Twin Peaks Wealth Advisors, LLC | 0 | -100,00 | 0 | |||||
| 2026-02-06 | 13F | Covestor Ltd | 1.993 | -11,97 | 0 | |||||
| 2026-01-23 | 13F | Optima Capital Llc | 5 | 1 | ||||||
| 2026-02-09 | 13F | Legal & General Group Plc | 10.620 | -0,67 | 1.272 | -9,60 | ||||
| 2026-02-13 | 13F | Healthcare Of Ontario Pension Plan Trust Fund | 9.112 | 1.091 | ||||||
| 2025-11-14 | 13F | Cubist Systematic Strategies, LLC | 0 | -100,00 | 0 | |||||
| 2026-04-23 | 13F | TFC Financial Management | 1 | 0,00 | 0 | |||||
| 2026-01-27 | 13F | Cannon Global Investment Management, LLC | 0 | -100,00 | 0 | |||||
| 2026-04-14 | 13F | Thurston, Springer, Miller, Herd & Titak, Inc. | 3.621 | -6,94 | 473 | 1,51 | ||||
| 2026-02-17 | 13F | Millennium Management Llc | 41.223 | -20,41 | 4.936 | -27,55 | ||||
| 2026-01-27 | 13F | TD Waterhouse Canada Inc. | 250 | 0,00 | 30 | -9,37 | ||||
| 2026-02-05 | 13F | Amalgamated Bank | 340 | -5,82 | 0 | |||||
| 2026-02-13 | 13F | Y-Intercept (Hong Kong) Ltd | 10.389 | 1.244 | ||||||
| 2026-02-17 | 13F | MIRAE ASSET GLOBAL ETFS HOLDINGS Ltd. | 250.062 | 2,46 | 29.944 | -6,73 | ||||
| 2025-11-14 | 13F | DRW Securities, LLC | 0 | -100,00 | 0 | -100,00 | ||||
| 2026-02-12 | 13F | New York State Common Retirement Fund | 4.025 | 0,00 | 482 | -9,07 | ||||
| 2026-02-17 | 13F | Man Group plc | 10.508 | 419,17 | 1.258 | 372,93 | ||||
| 2026-02-17 | 13F | Snowden Capital Advisors LLC | 1.816 | 217 | ||||||
| 2026-02-17 | 13F | Jump Financial, LLC | 11.080 | -52,94 | 1.327 | -57,18 | ||||
| 2026-02-17 | 13F | Canada Pension Plan Investment Board | 18.300 | 38,64 | 2.191 | 26,21 | ||||
| 2026-02-17 | 13F | Bank Of America Corp /de/ | 79.133 | 15,26 | 9.475 | 4,92 | ||||
| 2026-03-06 | 13F | Hsbc Holdings Plc | 8.472 | 17,26 | 1.017 | 8,08 | ||||
| 2026-02-13 | 13F | SRS Capital Advisors, Inc. | 155 | -94,93 | 19 | -95,52 | ||||
| 2026-02-13 | 13F | Barclays Plc | 24.497 | 6,49 | 2.933 | -3,07 | ||||
| 2026-04-21 | 13F | Old National Bancorp /in/ | 2.500 | 0,00 | 327 | 9,03 | ||||
| 2026-01-12 | 13F | Rialto Wealth Management, LLC | 2 | 0,00 | 0 | |||||
| 2026-02-13 | 13F | Neuberger Berman Group LLC | 2.189 | 34,38 | 262 | 22,43 | ||||
| 2026-02-09 | 13F | Annis Gardner Whiting Capital Advisors, LLC | 0 | -100,00 | 0 | |||||
| 2025-11-13 | 13F | Connor, Clark & Lunn Investment Management Ltd. | 0 | -100,00 | 0 | |||||
| 2026-02-12 | 13F | Wealthspire Advisors, LLC | 0 | -100,00 | 0 | |||||
| 2026-01-27 | 13F | First Horizon Corp | 171 | 151,47 | 20 | 150,00 | ||||
| 2026-02-17 | 13F | Select Equity Group, L.P. | 367.305 | -12,28 | 43.981 | -20,16 | ||||
| 2026-02-17 | 13F | Estuary Capital Management LP | 42.691 | 5.112 | ||||||
| 2025-11-14 | 13F | Skopos Labs, Inc. | 0 | -100,00 | 0 | |||||
| 2026-02-13 | 13F | Congruence Capital, LLC | 55.931 | 6.697 | ||||||
| 2026-02-06 | 13F | Diamond Hill Capital Management Inc | 70.935 | 7,67 | 8.494 | -2,01 | ||||
| 2026-02-17 | 13F | Qube Research & Technologies Ltd | 97.895 | 0,77 | 11.722 | -8,28 | ||||
| 2026-02-17 | 13F | Balyasny Asset Management Llc | 14.595 | 1.748 | ||||||
| 2026-02-13 | 13F | Stifel Financial Corp | 13.975 | 26,70 | 1.673 | 15,38 | ||||
| 2026-02-20 | 13F | Sunbelt Securities, Inc. | 8 | 0,00 | 1 | -100,00 | ||||
| 2026-02-11 | 13F | Ameritas Investment Partners, Inc. | 905 | 108 | ||||||
| 2026-02-03 | 13F | Sequoia Financial Advisors, LLC | 2.504 | -13,12 | 300 | -21,11 | ||||
| 2026-02-10 | 13F | Amica Mutual Insurance Co | 3.427 | 0,00 | 0 | |||||
| 2026-01-15 | 13F | Nisa Investment Advisors, Llc | 128 | -21,95 | 15 | -28,57 | ||||
| 2026-02-17 | 13F | Citadel Advisors Llc | Call | 0 | -100,00 | 0 | ||||
| 2026-02-12 | 13F | Principal Securities, Inc. | 0 | -100,00 | 0 | -100,00 | ||||
| 2026-04-15 | 13F | Fortitude Family Office, LLC | 12 | 300,00 | 2 | |||||
| 2026-02-10 | 13F | Axq Capital, Lp | 0 | -100,00 | 0 | |||||
| 2026-02-14 | 13F | Rockefeller Capital Management L.P. | 29 | 3 | ||||||
| 2026-02-13 | 13F | Segall Bryant & Hamill, Llc | 63.137 | 4,65 | 7.560 | -4,74 | ||||
| 2026-02-17 | 13F | Creative Planning | 6.935 | 3,55 | 830 | -5,68 | ||||
| 2026-02-17 | 13F | Fmr Llc | 64.083 | 26,04 | 7.673 | 14,73 | ||||
| 2026-02-17 | 13F | Advisor Group Holdings, Inc. | 1.606 | 25,76 | 192 | 17,79 | ||||
| 2025-11-12 | 13F | CIBC Bancorp USA Inc. | 1.975 | 260 | ||||||
| 2026-02-13 | 13F | BNP Paribas Asset Management Holding S.A. | 111 | 56,34 | 0 | |||||
| 2026-02-13 | 13F | Aptus Capital Advisors, LLC | 47.381 | 0,42 | 5.673 | -8,60 | ||||
| 2026-02-17 | 13F | ArrowMark Colorado Holdings LLC | 192.636 | -5,11 | 23.066 | -13,63 | ||||
| 2026-02-13 | 13F | First Trust Advisors Lp | 238.921 | 14,45 | 28.608 | 4,18 | ||||
| 2026-02-12 | 13F | Swiss National Bank | 22.600 | 1,80 | 2.706 | -7,33 | ||||
| 2026-02-13 | 13F | Victory Capital Management Inc | 7.134 | -58,77 | 854 | -62,48 | ||||
| 2026-01-07 | 13F | Massmutual Trust Co Fsb/adv | 0 | -100,00 | 0 | |||||
| 2026-02-10 | 13F | Goldman Sachs Group Inc | 325.922 | 10,31 | 39.026 | 0,41 | ||||
| 2026-01-21 | 13F | Stone House Investment Management, LLC | 0 | -100,00 | 0 | |||||
| 2025-11-14 | 13F | AXA Investment Managers S.A. | 2.319 | 305 | ||||||
| 2026-02-09 | 13F | Geode Capital Management, Llc | 341.752 | -0,17 | 40.927 | -9,14 | ||||
| 2026-02-17 | 13F | Russell Investments Group, Ltd. | 13.179 | 7,71 | 1.578 | -1,93 | ||||
| 2026-02-10 | 13F | Rothschild Investment Llc | 17 | 13,33 | 2 | 100,00 | ||||
| 2026-02-11 | 13F | Meeder Asset Management Inc | 1.612 | 310,18 | 193 | 278,43 | ||||
| 2026-02-17 | 13F | Tower Research Capital LLC (TRC) | 184 | -71,74 | 22 | -74,12 | ||||
| 2026-02-12 | 13F | Advisors Asset Management, Inc. | 68.281 | -0,70 | 8.176 | -9,62 | ||||
| 2026-02-06 | 13F | Pnc Financial Services Group, Inc. | 627 | 14,00 | 75 | 4,17 | ||||
| 2026-04-20 | 13F | State of Alaska, Department of Revenue | 2.802 | 0,00 | 0 | |||||
| 2026-02-06 | 13F | EverSource Wealth Advisors, LLC | 126 | -0,79 | 15 | -6,25 | ||||
| 2026-02-17 | 13F | Gotham Asset Management, LLC | 6.065 | -1,41 | 726 | -10,26 | ||||
| 2026-04-22 | 13F | Spire Wealth Management | 0 | -100,00 | 0 | |||||
| 2025-11-14 | 13F | Trexquant Investment LP | 0 | -100,00 | 0 | |||||
| 2026-04-24 | 13F | Heritage Investors Management Corp | 30.979 | -0,84 | 4 | 33,33 | ||||
| 2026-01-14 | 13F | Moisand Fitzgerald Tamayo, LLC | 0 | -100,00 | 0 | |||||
| 2025-11-03 | 13F | Stonegate Investment Group, LLC | 1.965 | 258 | ||||||
| 2026-02-17 | 13F | Prelude Capital Management, Llc | 1.713 | 205 | ||||||
| 2026-02-12 | 13F | Steward Partners Investment Advisory, Llc | 375 | 0,00 | 45 | -10,20 | ||||
| 2026-02-17 | 13F | Two Sigma Investments, Lp | 2.066 | -0,48 | 247 | -9,52 | ||||
| 2026-04-10 | 13F | Linden Thomas Advisory Services, LLC | 40.306 | 0,56 | 5.264 | 9,69 | ||||
| 2026-04-13 | 13F | IFP Advisors, Inc | 30 | -14,29 | 4 | -25,00 | ||||
| 2026-02-17 | 13F | Aqr Capital Management Llc | 62.420 | -12,04 | 7.474 | -19,94 | ||||
| 2026-02-11 | 13F | Jpmorgan Chase & Co | 24.517 | -44,23 | 2.936 | -49,25 | ||||
| 2026-02-17 | 13F | Raymond James Financial Inc | 12.321 | 3,30 | 1.475 | -5,99 | ||||
| 2026-02-12 | 13F | Alps Advisors Inc | 3.628 | 0,83 | 434 | -8,25 | ||||
| 2026-02-13 | 13F | Arrowstreet Capital, Limited Partnership | 17.178 | -7,80 | 2.057 | -16,08 | ||||
| 2025-11-10 | 13F | Semanteon Capital Management, LP | 0 | -100,00 | 0 | |||||
| 2026-02-13 | 13F | Sei Investments Co | 9.949 | 125,75 | 1.193 | 105,87 | ||||
| 2026-02-12 | 13F | Commonwealth Equity Services, Llc | 6.441 | -8,50 | 771 | |||||
| 2026-02-11 | 13F | Capital Analysts, Inc. | 3.106 | -8,27 | 0 | |||||
| 2026-02-09 | 13F | Jefferies Financial Group Inc. | 1.671 | 200 | ||||||
| 2026-02-17 | 13F | Algert Global Llc | 92.087 | -22,10 | 11 | -26,67 | ||||
| 2026-01-26 | 13F | Moran Wealth Management, LLC | 8.742 | 9,12 | 1.047 | -0,66 | ||||
| 2026-04-17 | 13F | AdvisorNet Financial, Inc | 150 | 0,00 | 20 | 11,76 | ||||
| 2026-02-13 | 13F | Mariner, LLC | 3.571 | 30,61 | 431 | 19,78 | ||||
| 2026-02-17 | 13F | Point72 Asset Management, L.P. | 5.369 | 643 | ||||||
| 2025-11-12 | 13F | Quantbot Technologies LP | 0 | -100,00 | 0 | |||||
| 2026-02-17 | 13F | Schonfeld Strategic Advisors LLC | 0 | -100,00 | 0 | |||||
| 2026-02-11 | 13F | Los Angeles Capital Management Llc | 3.220 | -1,83 | 395 | -8,58 | ||||
| 2026-02-18 | 13F | Vident Advisory, LLC | 22.992 | 7,84 | 2.753 | -1,82 | ||||
| 2026-02-17 | 13F | Susquehanna Portfolio Strategies, LLC | 5.114 | -17,10 | 612 | -24,54 | ||||
| 2026-02-03 | 13F | SBI Securities Co., Ltd. | 30 | 0,00 | 4 | 0,00 | ||||
| 2026-02-02 | 13F | Cornerstone Planning Group LLC | 56 | -91,40 | 7 | -97,32 | ||||
| 2026-02-11 | 13F | Franklin Resources Inc | 46.508 | -1,46 | 5.569 | -10,31 | ||||
| 2026-02-17 | 13F | Susquehanna Fundamental Investments, Llc | 6.335 | -7,32 | 759 | -15,68 | ||||
| 2025-11-14 | 13F | XTX Topco Ltd | 0 | -100,00 | 0 | -100,00 |
Other Listings
| US:USLM | 131,49 $ |