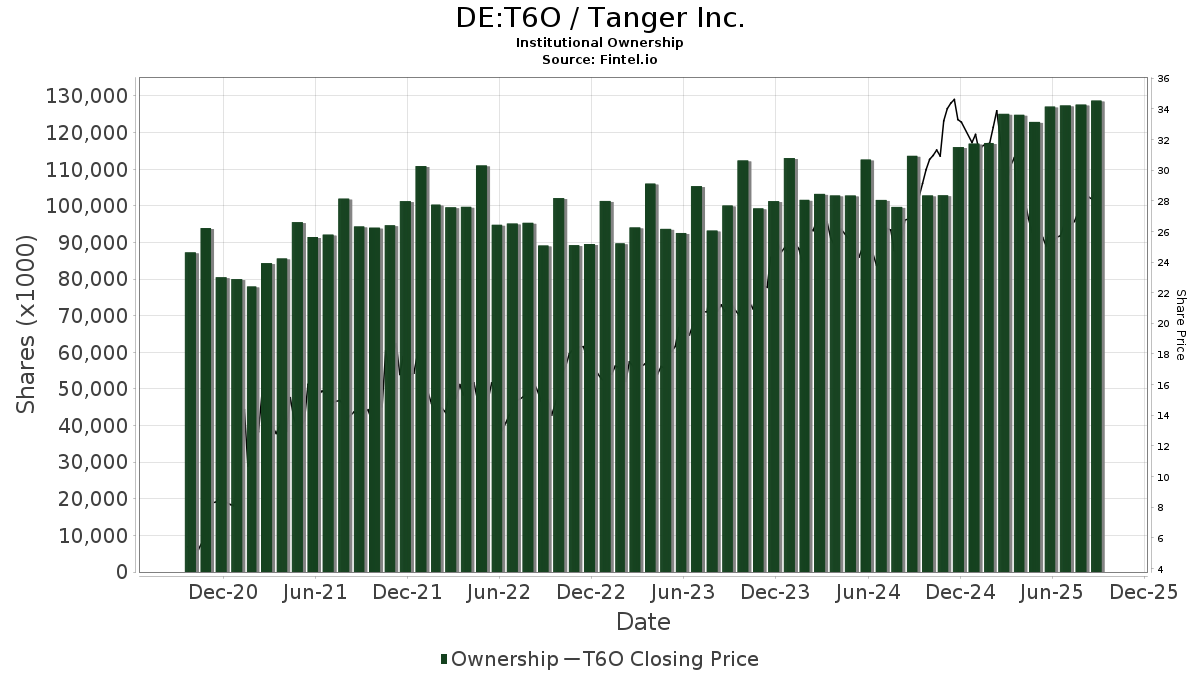
Grundlæggende statistik
| Institutionelle aktier (lange) | 105.144.442 - 91,80% (ex 13D/G) - change of -22,18MM shares -17,42% MRQ |
| Institutionel værdi (lang) | $ 3.418.152 USD ($1000) |
Institutionelt ejerskab og aktionærer
Tanger Inc. (DE:T6O) har 346 institutionelle ejere og aktionærer, der har indsendt 13D/G- eller 13F-formularer til Securities Exchange Commission (SEC). Disse institutioner har i alt 105,144,442 aktier. Største aktionærer omfatter BlackRock, Inc., Vanguard Group Inc, Fmr Llc, State Street Corp, Geode Capital Management, Llc, Wellington Management Group Llp, Invesco Ltd., Charles Schwab Investment Management Inc, Northern Trust Corp, and Nuveen, LLC .
Tanger Inc. (DB:T6O) institutionel ejerskabsstruktur viser aktuelle positioner i virksomheden efter institutioner og fonde, samt seneste ændringer i positionsstørrelse. Større aktionærer kan omfatte individuelle investorer, investeringsforeninger, hedgefonde eller institutioner. Skema 13D angiver, at investoren besidder (eller besidder) mere end 5 % af virksomheden og har til hensigt (eller har til hensigt at) aktivt at forfølge en ændring i forretningsstrategi. Skema 13G indikerer en passiv investering på over 5%.
The share price as of April 28, 2026 is 30,78 / share. Previously, on April 29, 2025, the share price was 27,77 / share. This represents an increase of 10,84% over that period.
Fondens stemningsscore
Fund Sentiment Score (fka Ownership Accumulation Score) finder de aktier, der bliver mest købt af fonde. Det er resultatet af en sofistikeret, multi-faktor kvantitativ model, der identificerer virksomheder med de højeste niveauer af institutionel akkumulering. Scoringsmodellen bruger en kombination af den samlede stigning i oplyste ejere, ændringerne i porteføljeallokeringer i disse ejere og andre målinger. Tallet går fra 0 til 100, hvor højere tal indikerer et højere niveau af akkumulering for sine jævnaldrende, og 50 er gennemsnittet.
Opdateringsfrekvens: Dagligt
Se Ownership Explorer, som giver en liste over højest rangerende virksomheder.
AI+ Ask Fintel’s AI assistant about Tanger Inc..
Select a question to share a public post with an AI-crafted answer.
Thinking of good questions…
13F og NPORT arkivering
Detaljer om 13F-arkivering er gratis. Detaljer om NP-ansøgninger kræver et premium-medlemskab. Grønne rækker angiver nye positioner. Røde rækker angiver lukkede positioner. Klik på linket ikon for at se den fulde transaktionshistorik.
Opgrader
for at låse premium-data op og eksportere til Excel ![]() .
.
| Fil dato | Kilde | Investor | Type | Gennemsnitlig pris (Øst) |
Aktier | Δ Aktier (%) |
Rapporteret Værdi ($1000) |
Δ Værdi (%) |
Port Alloc (%) |
|
|---|---|---|---|---|---|---|---|---|---|---|
| 2026-02-09 | 13F | Jefferies Financial Group Inc. | 31.730 | -72,32 | 1.059 | -72,72 | ||||
| 2026-02-17 | 13F | Canada Pension Plan Investment Board | 23.900 | 798 | ||||||
| 2025-11-14 | 13F | Susquehanna Fundamental Investments, Llc | 0 | -100,00 | 0 | -100,00 | ||||
| 2026-02-10 | 13F | Cbre Clarion Securities Llc | 1.009.226 | 39,86 | 33.678 | 37,92 | ||||
| 2026-01-16 | 13F | Standard Life Aberdeen plc | 39.998 | -4,44 | 1.335 | -4,24 | ||||
| 2026-02-04 | 13F | Ameritas Advisory Services, LLC | 0 | -100,00 | 0 | |||||
| 2026-04-24 | 13F | Profund Advisors Llc | 0 | -100,00 | 0 | |||||
| 2026-01-23 | 13F | Burney Co/ | 56.916 | -0,89 | 1.899 | -2,26 | ||||
| 2026-02-17 | 13F | Citadel Advisors Llc | Put | 16.800 | -71,03 | 561 | -71,46 | |||
| 2026-02-17 | 13F | Citadel Advisors Llc | Call | 25.600 | -58,97 | 854 | -59,55 | |||
| 2026-02-06 | 13F | EverSource Wealth Advisors, LLC | 968 | -11,76 | 32 | -13,51 | ||||
| 2026-02-17 | 13F | RMB Capital Management, LLC | 220.816 | 28,56 | 7.369 | 26,77 | ||||
| 2026-02-13 | 13F | Sei Investments Co | 80.851 | -8,33 | 2.698 | -9,62 | ||||
| 2026-02-12 | 13F | Federation des caisses Desjardins du Quebec | 8.948 | 27,61 | 299 | 25,74 | ||||
| 2026-04-02 | 13F | Ares Financial Consulting, LLC | 876 | 30 | ||||||
| 2026-04-20 | 13F | Louisiana State Employees Retirement System | 51.000 | -3,23 | 1.733 | -1,48 | ||||
| 2026-04-20 | 13F | State of Alaska, Department of Revenue | 119.744 | -0,06 | 4 | 33,33 | ||||
| 2026-01-14 | 13F | Hennion & Walsh Asset Management, Inc. | 14.907 | -3,61 | 497 | -4,97 | ||||
| 2026-02-13 | 13F | First Trust Advisors Lp | 66.688 | 13,08 | 2.225 | 11,53 | ||||
| 2026-01-30 | 13F | United Community Bank | 0 | -100,00 | 0 | |||||
| 2026-02-04 | 13F | Atlantic Union Bankshares Corp | 3.050 | -21,71 | 102 | -22,90 | ||||
| 2025-11-14 | 13F | Point72 Europe (London) LLP | 278 | 9 | ||||||
| 2026-04-10 | 13F | Marshall Financial Group LLC | 27.903 | 0,45 | 948 | 2,38 | ||||
| 2026-02-10 | 13F | Presima Inc. | 142.545 | -63,69 | 4.757 | -64,20 | ||||
| 2026-02-12 | 13F | Campbell & CO Investment Adviser LLC | 11.966 | 87,17 | 399 | 84,72 | ||||
| 2026-02-17 | 13F | Citadel Advisors Llc | 56.284 | -89,34 | 1.878 | -89,49 | ||||
| 2026-02-06 | 13F | Larson Financial Group LLC | 438 | 0,00 | 15 | 0,00 | ||||
| 2026-01-26 | 13F | Mirae Asset Global Investments Co., Ltd. | 3.308 | 33,44 | 110 | 32,53 | ||||
| 2025-11-14 | 13F | Jain Global LLC | 0 | -100,00 | 0 | |||||
| 2025-11-17 | 13F | Adelante Capital Management LLC | 0 | -100,00 | 0 | -100,00 | ||||
| 2026-02-12 | 13F | Cibc World Markets Corp | 7.399 | -46,31 | 247 | -41,57 | ||||
| 2026-04-10 | 13F | Abound Wealth Management | 8 | 0,00 | 0 | |||||
| 2026-02-13 | 13F | Ubs Oconnor Llc | Put | 0 | -100,00 | 0 | ||||
| 2026-02-09 | 13F | MQS Management LLC | 0 | -100,00 | 0 | |||||
| 2026-02-10 | 13F | Daiwa Securities Group Inc. | 43.934 | 6,97 | 1 | 0,00 | ||||
| 2026-01-29 | 13F | DecisionPoint Financial, LLC | 9 | 0,00 | 0 | |||||
| 2026-01-28 | 13F | Universal- Beteiligungs- und Servicegesellschaft mbH | 29.823 | 10,87 | 995 | 9,34 | ||||
| 2026-02-17 | 13F | Bayesian Capital Management, LP | 0 | -100,00 | 0 | |||||
| 2026-02-18 | 13F | Vident Advisory, LLC | 15.466 | -6,71 | 516 | -8,02 | ||||
| 2026-01-28 | 13F | Geneos Wealth Management Inc. | 500 | 0,00 | 17 | 0,00 | ||||
| 2026-02-11 | 13F | Franklin Resources Inc | 134.155 | 4,13 | 4.477 | 2,68 | ||||
| 2026-01-29 | 13F | Vanguard Group Inc | 17.949.640 | 4,60 | 598.979 | 3,15 | ||||
| 2026-01-30 | 13F | State of New Jersey Common Pension Fund D | 25.000 | 834 | ||||||
| 2026-02-12 | 13F | Commonwealth Equity Services, Llc | 45.142 | -15,34 | 1.506 | 150.500,00 | ||||
| 2026-02-17 | 13F | Spears Abacus Advisors LLC | 18.473 | -95,15 | 616 | -95,22 | ||||
| 2025-11-04 | 13F | State of Wyoming | 0 | -100,00 | 0 | -100,00 | ||||
| 2026-02-12 | 13F | Wealthspire Advisors, LLC | 0 | -100,00 | 0 | |||||
| 2026-02-17 | 13F | FIL Ltd | 2.731 | -36,86 | 91 | -37,67 | ||||
| 2026-04-20 | 13F | Ronald Blue Trust, Inc. | 31 | 19,23 | 1 | |||||
| 2026-01-15 | 13F | Nisa Investment Advisors, Llc | 100.736 | -4,32 | 3.362 | -5,64 | ||||
| 2026-04-13 | 13F | Massmutual Trust Co Fsb/adv | 0 | -100,00 | 0 | |||||
| 2026-02-17 | 13F | Tower Research Capital LLC (TRC) | 6.304 | -8,28 | 210 | -9,48 | ||||
| 2026-02-17 | 13F | Kemnay Advisory Services Inc. | 243 | 8 | ||||||
| 2026-02-13 | 13F | Van Eck Associates Corp | 29.879 | 9,83 | 1 | |||||
| 2026-02-11 | 13F | O'shaughnessy Asset Management, Llc | 38.649 | -13,98 | 1.290 | -15,20 | ||||
| 2025-11-14 | 13F | CI Private Wealth, LLC | 0 | -100,00 | 0 | -100,00 | ||||
| 2025-10-30 | 13F | Twin Peaks Wealth Advisors, LLC | 0 | -100,00 | 0 | -100,00 | ||||
| 2026-02-09 | 13F | Key FInancial Inc | 0 | -100,00 | 0 | |||||
| 2026-02-17 | 13F | Advisory Services Network, LLC | 0 | -100,00 | 0 | |||||
| 2026-02-12 | 13F | APG Asset Management US Inc. | 887.091 | 0,00 | 29.602 | -1,24 | ||||
| 2026-02-13 | 13F | Public Employees Retirement Association Of Colorado | 12.396 | 0,00 | 0 | |||||
| 2026-04-13 | 13F | IFP Advisors, Inc | 902 | 0,00 | 31 | 0,00 | ||||
| 2026-02-05 | 13F | Dana Investment Advisors, Inc. | 59.847 | -3,01 | 1.997 | -4,36 | ||||
| 2026-02-11 | 13F | Manchester Capital Management LLC | 48 | 2 | ||||||
| 2026-01-21 | 13F | Rocky Mountain Advisers, Llc | 1.066 | -81,30 | 36 | -81,77 | ||||
| 2026-02-10 | 13F | Intech Investment Management Llc | 55.130 | -12,06 | 1.840 | -13,30 | ||||
| 2026-04-15 | 13F | Albert D Mason Inc | 64.383 | 1,00 | 2.188 | 2,82 | ||||
| 2026-02-12 | 13F | BRYN MAWR TRUST Co | 0 | -100,00 | 0 | -100,00 | ||||
| 2026-02-17 | 13F | Aqr Capital Management Llc | 47.676 | 22,38 | 1.591 | 20,64 | ||||
| 2026-02-18 | 13F | Garton & Associates Financial Advisors LLC | 1.226 | 41 | ||||||
| 2026-04-15 | 13F | DAVENPORT & Co LLC | 16.200 | -20,20 | 550 | -18,76 | ||||
| 2025-11-14 | 13F | Skopos Labs, Inc. | 0 | -100,00 | 0 | |||||
| 2026-04-15 | 13F | Spirit Of America Management Corp/ny | 12.000 | 0,00 | 408 | 1,75 | ||||
| 2026-02-12 | 13F | Hohimer Wealth Management, Llc | 0 | -100,00 | 0 | |||||
| 2026-04-27 | 13F | HB Wealth Management, LLC | 9.720 | 7,95 | 330 | 10,00 | ||||
| 2026-04-15 | 13F | Journey Strategic Wealth Llc | 6.884 | 2,20 | 234 | 4,02 | ||||
| 2026-02-09 | 13F | Geode Capital Management, Llc | 2.879.693 | 0,95 | 96.111 | -0,45 | ||||
| 2026-04-08 | 13F | Wealth Enhancement Advisory Services, Llc | 0 | -100,00 | 0 | |||||
| 2026-02-13 | 13F | Umb Bank N A/mo | 1.197 | 4,45 | 40 | 2,63 | ||||
| 2026-02-11 | 13F | Vestcor Inc | 93.495 | 2,57 | 3 | 0,00 | ||||
| 2026-01-23 | 13F | Assetmark, Inc | 1.535 | 235,89 | 51 | 240,00 | ||||
| 2026-02-17 | 13F | Engineers Gate Manager LP | 8.075 | 269 | ||||||
| 2026-02-17 | 13F | Amundi | 72.316 | -5,12 | 2.413 | -5,15 | ||||
| 2026-02-13 | 13F | Truvestments Capital Llc | 98.185 | -1,82 | 3.276 | -3,19 | ||||
| 2026-02-26 | 13F | Anchor Investment Management, LLC | 50 | 0,00 | 2 | 0,00 | ||||
| 2026-02-17 | 13F | Mercer Global Advisors Inc /adv | 17.564 | 0,39 | 586 | -1,01 | ||||
| 2026-02-17 | 13F | Bank Of America Corp /de/ | 349.587 | 57,20 | 11.666 | 55,02 | ||||
| 2026-04-22 | 13F | Sterling Capital Management LLC | 143.614 | -3,16 | 4.880 | -1,37 | ||||
| 2026-02-12 | 13F | Hrt Financial Lp | 0 | -100,00 | 0 | |||||
| 2026-02-17 | 13F | Virtus Investment Advisers, Inc. | 0 | -100,00 | 0 | -100,00 | ||||
| 2026-02-13 | 13F | Beck Capital Management, Llc | 44.475 | 5,98 | 1.484 | 4,51 | ||||
| 2026-02-05 | 13F | 1620 Investment Advisors, Inc. | 10.349 | -0,19 | 345 | -1,43 | ||||
| 2026-02-13 | 13F | FJ Capital Management LLC | 27.829 | 929 | ||||||
| 2026-02-10 | 13F | Bank of New York Mellon Corp | 859.994 | -6,68 | 28.698 | -7,97 | ||||
| 2025-11-10 | 13F | Greenland Capital Management LP | 0 | -100,00 | 0 | -100,00 | ||||
| 2025-10-31 | 13F | Y-Intercept (Hong Kong) Ltd | 0 | -100,00 | 0 | -100,00 | ||||
| 2026-04-08 | 13F | Arlington Trust Co LLC | 27 | 1 | ||||||
| 2026-02-06 | 13F | Bare Financial Services, Inc | 212 | 7,61 | 7 | 16,67 | ||||
| 2026-02-17 | 13F | Schonfeld Strategic Advisors LLC | 0 | -100,00 | 0 | |||||
| 2026-04-28 | 13F | Aew Capital Management L P | 1.862 | 272,40 | 63 | 293,75 | ||||
| 2025-11-14 | 13F | Point72 (DIFC) Ltd | 974 | 33 | ||||||
| 2025-11-14 | 13F | Wolverine Trading, Llc | Put | 0 | -100,00 | 0 | -100,00 | |||
| 2026-04-17 | 13F | HHM Wealth Advisors, LLC | 1.000 | 0,00 | 34 | 0,00 | ||||
| 2026-01-29 | 13F | D.a. Davidson & Co. | 8.748 | 0,15 | 292 | -1,36 | ||||
| 2026-02-02 | 13F | Danske Bank A/s | 500 | 0,00 | 17 | 0,00 | ||||
| 2026-02-13 | 13F | Verition Fund Management LLC | 53.100 | -7,15 | 1.772 | -8,48 | ||||
| 2026-02-12 | 13F | Ensign Peak Advisors, Inc | 8.168 | -70,53 | 273 | -70,97 | ||||
| 2026-02-11 | 13F | Zions Bancorporation, National Association /ut/ | 100 | 3 | ||||||
| 2026-02-11 | 13F | Los Angeles Capital Management Llc | 39.130 | 0,00 | 1.267 | -4,31 | ||||
| 2026-02-12 | 13F | Ankerstar Wealth, LLC | 18 | 1 | ||||||
| 2026-02-12 | 13F | Voya Investment Management Llc | 206.926 | -6,53 | 6.905 | -7,82 | ||||
| 2026-02-10 | 13F | Goldman Sachs Group Inc | 580.897 | -34,85 | 19.385 | -35,76 | ||||
| 2026-02-13 | 13F | Macquarie Group Ltd | 60.046 | -94,12 | 2.004 | -94,21 | ||||
| 2026-02-17 | 13F | Land & Buildings Investment Management, LLC | 826.822 | -8,38 | 27.591 | -9,65 | ||||
| 2026-02-09 | 13F | Atlantic Trust, LLC | 0 | -100,00 | 0 | |||||
| 2026-04-24 | 13F | Root Financial Partners, LLC | 119 | 4 | ||||||
| 2026-02-05 | 13F | Amalgamated Bank | 33.353 | 2,99 | 1 | 0,00 | ||||
| 2026-02-02 | 13F | Principal Financial Group Inc | 550.071 | 0,55 | 18.356 | -0,85 | ||||
| 2026-04-09 | 13F | Tompkins Financial Corp | 340 | 12 | ||||||
| 2026-04-07 | 13F | Signaturefd, Llc | 233 | 0,00 | 8 | 0,00 | ||||
| 2026-04-21 | 13F | Xcel Wealth Management, LLC | 83.966 | 3,45 | 2.853 | 5,35 | ||||
| 2026-02-11 | 13F | Cerity Partners LLC | 8.110 | 29,10 | 271 | 27,36 | ||||
| 2026-02-10 | 13F | Commonwealth Of Pennsylvania Public School Empls Retrmt Sys | 64.790 | -0,50 | 2.162 | -1,86 | ||||
| 2026-02-06 | 13F | Legato Capital Management LLC | 84.233 | 41,36 | 2.811 | 39,38 | ||||
| 2026-02-11 | 13F | Hughes Financial Services, LLC | 1 | 0 | ||||||
| 2026-02-13 | 13F | Charles Schwab Investment Management Inc | 2.132.775 | 4,87 | 71.171 | 3,41 | ||||
| 2026-02-13 | 13F | State Street Corp | 6.480.548 | -0,37 | 216.256 | -1,75 | ||||
| 2025-11-07 | 13F | Shell Asset Management Co | 3.696 | -50,82 | 0 | |||||
| 2026-02-05 | 13F | High Note Wealth, LLC | 127 | -5,93 | 4 | 0,00 | ||||
| 2026-02-06 | 13F | Intrust Bank Na | 11.086 | -7,02 | 370 | -8,44 | ||||
| 2026-02-17 | 13F | Price T Rowe Associates Inc /md/ | 101.534 | 3,05 | 3 | 0,00 | ||||
| 2026-04-06 | 13F | Rosenberg Matthew Hamilton | 9 | 0,00 | 0 | |||||
| 2026-02-12 | 13F | Bank Of Montreal /can/ | 10.642 | -12,79 | 355 | -13,83 | ||||
| 2026-04-15 | 13F | Exchange Traded Concepts, Llc | 5.347 | 1,71 | 182 | 3,43 | ||||
| 2026-02-12 | 13F | Quadrant Capital Group Llc | 8.998 | 0,00 | 300 | -1,32 | ||||
| 2026-02-17 | 13F | Aster Capital Management (DIFC) Ltd | 1.443 | -32,44 | 48 | -33,33 | ||||
| 2026-04-22 | 13F | Pictet Asset Management Holding SA | 17.688 | 9,34 | 601 | 11,50 | ||||
| 2025-11-14 | 13F | Atom Investors LP | 0 | -100,00 | 0 | -100,00 | ||||
| 2026-02-17 | 13F | Cresset Asset Management, LLC | 7.700 | 0,00 | 257 | -1,54 | ||||
| 2026-02-12 | 13F | Jane Street Group, Llc | Call | 6.300 | -20,25 | 210 | -21,35 | |||
| 2026-04-07 | 13F | Eastern Bank | 428 | 0,00 | 15 | 0,00 | ||||
| 2026-04-10 | 13F | Novem Group | 31.869 | 4,74 | 1.083 | 6,60 | ||||
| 2026-02-17 | 13F | Boothbay Fund Management, Llc | 165.725 | -39,76 | 5.530 | -40,59 | ||||
| 2026-02-12 | 13F | Jane Street Group, Llc | 0 | -100,00 | 0 | -100,00 | ||||
| 2026-02-10 | 13F | Acadian Asset Management Llc | 27.562 | 1 | ||||||
| 2026-02-17 | 13F | Gillson Capital LP | 0 | -100,00 | 0 | |||||
| 2025-11-14 | 13F | Cubist Systematic Strategies, LLC | 20.216 | 684 | ||||||
| 2025-11-12 | 13F | Headlands Technologies LLC | 0 | -100,00 | 0 | |||||
| 2026-02-17 | 13F | Susquehanna International Group, Llp | Call | 49.600 | 30,18 | 1.655 | 28,39 | |||
| 2026-04-27 | 13F | New York State Teachers Retirement System | 149.289 | -2,28 | 5 | 0,00 | ||||
| 2026-02-13 | 13F | Smartleaf Asset Management LLC | 3.476 | 9,14 | 118 | 11,32 | ||||
| 2026-02-13 | 13F | Entropy Technologies, LP | 0 | -100,00 | 0 | |||||
| 2026-02-17 | 13F | Jones Financial Companies Lllp | 1.239 | 17,00 | 41 | 17,14 | ||||
| 2026-02-04 | 13F | First Eagle Investment Management, LLC | 179.769 | 3,93 | 5.999 | 2,48 | ||||
| 2026-04-23 | 13F | Oppenheimer & Co Inc | 8.807 | 0,00 | 299 | 2,05 | ||||
| 2026-02-18 | 13F | GWM Advisors LLC | 0 | -100,00 | 0 | |||||
| 2026-02-14 | 13F | Rockefeller Capital Management L.P. | 415 | -21,99 | 14 | -27,78 | ||||
| 2026-01-27 | 13F | Asset Management One Co., Ltd. | 160.979 | 2,10 | 5.460 | 2,34 | ||||
| 2026-01-28 | 13F | DekaBank Deutsche Girozentrale | 25.340 | 0,00 | 1 | |||||
| 2026-02-11 | 13F | Group One Trading, L.p. | Call | 100 | -88,89 | 3 | -90,00 | |||
| 2026-02-11 | 13F | Group One Trading, L.p. | Put | 100 | 3 | |||||
| 2026-02-12 | 13F | Dimensional Fund Advisors Lp | 1.652.493 | 1,88 | 55.146 | 0,48 | ||||
| 2026-02-17 | 13F | First Manhattan Co | 0 | -100,00 | 0 | |||||
| 2026-02-11 | 13F | Group One Trading, L.p. | 5 | 0 | ||||||
| 2026-02-13 | 13F | SRS Capital Advisors, Inc. | 10 | -62,96 | 0 | |||||
| 2026-02-13 | 13F | Squarepoint Ops LLC | 44.057 | -2,44 | 1.470 | -3,80 | ||||
| 2026-02-13 | 13F | Parkside Financial Bank & Trust | 146 | 15,87 | 5 | 0,00 | ||||
| 2025-11-17 | 13F | Alyeska Investment Group, L.P. | 0 | -100,00 | 0 | -100,00 | ||||
| 2026-04-28 | 13F | Abel Hall, LLC | 7.162 | 243 | ||||||
| 2026-02-17 | 13F | Royal Bank Of Canada | 37.182 | -44,82 | 1.241 | -45,57 | ||||
| 2025-11-14 | 13F | Texas Permanent School Fund | 0 | -100,00 | 0 | |||||
| 2026-02-12 | 13F | M&G Plc | 0 | -100,00 | 0 | |||||
| 2026-02-12 | 13F | Loomis Sayles & Co L P | 796 | 0,00 | 27 | 0,00 | ||||
| 2026-02-13 | 13F | Healthcare Of Ontario Pension Plan Trust Fund | 198.342 | 6.619 | ||||||
| 2026-02-17 | 13F | Lighthouse Investment Partners, LLC | 580.000 | 12,62 | 19.355 | 11,06 | ||||
| 2026-02-17 | 13F | Two Sigma Investments, Lp | 112.214 | -44,67 | 3.745 | -45,45 | ||||
| 2026-02-09 | 13F | New Age Alpha Advisors, LLC | 23.630 | -15,37 | 789 | -16,53 | ||||
| 2026-02-13 | 13F | Manufacturers Life Insurance Company, The | 0 | -100,00 | 0 | |||||
| 2026-02-13 | 13F | American Century Companies Inc | 701.793 | -10,93 | 23.419 | -12,16 | ||||
| 2026-02-17 | 13F | Lazard Asset Management Llc | 0 | -100,00 | 0 | |||||
| 2026-02-12 | 13F | Xponance, Inc. | 8.844 | 0,76 | 295 | -0,67 | ||||
| 2026-02-13 | 13F | Neo Ivy Capital Management | 0 | -100,00 | 0 | |||||
| 2025-11-07 | 13F | Beacon Capital Management, LLC | 0 | -100,00 | 0 | |||||
| 2026-02-17 | 13F | Masterton Capital Management, LP | 160.600 | 0,00 | 5.359 | -1,38 | ||||
| 2026-04-21 | 13F | GHP Investment Advisors, Inc. | 3 | 0 | ||||||
| 2026-02-17 | 13F | Quantinno Capital Management LP | 15.779 | 10,68 | 527 | 9,13 | ||||
| 2026-02-17 | 13F | Northern Trust Corp | 1.973.387 | 0,03 | 65.852 | -1,36 | ||||
| 2026-02-09 | 13F | Hantz Financial Services, Inc. | 638 | 5.700,00 | 0 | |||||
| 2026-04-17 | 13F | CENTRAL TRUST Co | 1.600 | 54 | ||||||
| 2026-02-17 | 13F | Man Group plc | 12.847 | -71,53 | 429 | -71,95 | ||||
| 2026-02-13 | 13F | Nicholas Investment Partners, LP | 450.672 | 3,94 | 15.039 | 2,49 | ||||
| 2026-02-17 | 13F | Summit Global Investments | 20.721 | 1 | ||||||
| 2026-02-11 | 13F | Allianz Asset Management GmbH | 108.325 | -1,06 | 3.615 | -2,46 | ||||
| 2026-02-17 | 13F | Voloridge Investment Management, Llc | 454.143 | -10,83 | 15.155 | -12,07 | ||||
| 2026-02-13 | 13F | Neuberger Berman Group LLC | 293.824 | 1,33 | 9.805 | -0,08 | ||||
| 2026-03-03 | 13F/A | Caitong International Asset Management Co., Ltd | 2 | -99,24 | 0 | -100,00 | ||||
| 2026-02-06 | 13F | Global Retirement Partners, LLC | 539 | 1,51 | 18 | 0,00 | ||||
| 2026-02-13 | 13F | Panagora Asset Management Inc | 294.235 | 1.804,43 | 9.819 | 1.780,84 | ||||
| 2026-01-30 | 13F | Us Bancorp \de\ | 6.182 | 9,57 | 206 | 8,42 | ||||
| 2026-02-17 | 13F | Alliancebernstein L.p. | 159.799 | 4,61 | 5.332 | 3,15 | ||||
| 2026-02-09 | 13F | Knights of Columbus Asset Advisors LLC | 100.631 | -20,77 | 3.358 | -21,87 | ||||
| 2026-02-12 | 13F | Nuveen, LLC | 1.669.970 | 7,19 | 55.727 | 5,70 | ||||
| 2026-04-28 | 13F | Bogart Wealth, LLC | 122 | 0,00 | 4 | 0,00 | ||||
| 2026-02-17 | 13F | Waterfront Capital Partners, LLC | 0 | -100,00 | 0 | -100,00 | ||||
| 2026-02-17 | 13F | ExodusPoint Capital Management, LP | 0 | -100,00 | 0 | -100,00 | ||||
| 2026-04-17 | 13F | Bell Investment Advisors, Inc | 19 | 0,00 | 1 | |||||
| 2026-02-17 | 13F | Creative Planning | 14.819 | 13,73 | 494 | 12,27 | ||||
| 2026-03-06 | 13F | Hsbc Holdings Plc | 268.603 | 28,78 | 8.987 | 27,55 | ||||
| 2026-02-09 | 13F | Putnam Fl Investment Management Co | 10.330 | 6,17 | 345 | 4,56 | ||||
| 2026-02-13 | 13F | Bridgefront Capital, LLC | 0 | -100,00 | 0 | |||||
| 2026-02-17 | 13F | D. E. Shaw & Co., Inc. | 73.267 | -71,03 | 2.445 | -71,44 | ||||
| 2026-04-15 | 13F | Diligent Investors, LLC | 13.238 | -1,28 | 450 | 0,45 | ||||
| 2026-02-13 | 13F | Morgan Stanley | 1.338.348 | -4,27 | 44.661 | -5,60 | ||||
| 2026-03-04 | 13F | SHP Wealth Management | 750 | 25 | ||||||
| 2026-02-17 | 13F | Public Employees Retirement System Of Ohio | 157.745 | -2,03 | 5.264 | -3,40 | ||||
| 2025-11-14 | 13F | Wolverine Trading, Llc | Call | 8.400 | 16,67 | 280 | 26,82 | |||
| 2026-02-05 | 13F | Allworth Financial LP | 142 | 132,79 | 5 | 100,00 | ||||
| 2026-02-13 | 13F | Ubs Asset Management Americas Inc | 760.084 | 25.364 | ||||||
| 2026-04-13 | 13F | Salem Investment Counselors Inc | 400 | 14 | ||||||
| 2025-11-04 | 13F | IMC-Chicago, LLC | Put | 0 | -100,00 | 0 | -100,00 | |||
| 2026-02-17 | 13F | MIRAE ASSET GLOBAL ETFS HOLDINGS Ltd. | 51.953 | -0,01 | 1.734 | -1,42 | ||||
| 2026-04-24 | 13F | Sumitomo Mitsui DS Asset Management Company, Ltd | 28.984 | 17,34 | 985 | 19,42 | ||||
| 2026-02-09 | 13F | Legal & General Group Plc | 862.321 | 10,87 | 28.776 | 9,33 | ||||
| 2026-02-13 | 13F | Victory Capital Management Inc | 37.086 | -9,22 | 1.238 | -10,49 | ||||
| 2026-04-16 | 13F | Future Financial Wealth Managment LLC | 6.146 | 0,29 | 223 | 8,82 | ||||
| 2026-02-13 | 13F | Prudential Financial Inc | 107.836 | -5,14 | 3.598 | -6,45 | ||||
| 2026-02-02 | 13F | Cornerstone Planning Group LLC | 9 | -95,93 | 0 | -100,00 | ||||
| 2026-02-03 | 13F | Crossmark Global Holdings, Inc. | 402.583 | -1,48 | 13.434 | -2,85 | ||||
| 2026-02-10 | 13F | Mutual Of America Capital Management Llc | 13.156 | 3,78 | 439 | 2,57 | ||||
| 2026-02-17 | 13F | Susquehanna Portfolio Strategies, LLC | 117.150 | -5,75 | 3.909 | -7,06 | ||||
| 2025-11-14 | 13F | Landmark Investment Partners, L.p. | Call | 0 | -100,00 | 0 | ||||
| 2026-04-16 | 13F | Everstar Asset Management, LLC | 16.286 | 553 | ||||||
| 2026-02-13 | 13F | Mariner, LLC | 7.893 | 263 | ||||||
| 2026-02-17 | 13F | LaSalle St. Investment Advisors, LLC | 6.316 | 0,38 | 0 | |||||
| 2026-02-03 | 13F | International Assets Investment Management, Llc | 450 | 15 | ||||||
| 2026-01-30 | 13F | Laurel Wealth Advisors LLC | 1.029 | 34 | ||||||
| 2026-04-21 | 13F | Vise Technologies, Inc. | 16.367 | 0,00 | 546 | 0,00 | ||||
| 2026-02-13 | 13F | BNP Paribas Asset Management Holding S.A. | 9.665 | 3,56 | 0 | |||||
| 2026-02-17 | 13F | Qube Research & Technologies Ltd | 1.236.844 | 16,74 | 41.273 | 15,12 | ||||
| 2026-04-24 | 13F | IFM Investors Pty Ltd | 18.452 | 2,41 | 627 | |||||
| 2026-02-17 | 13F | Freestone Grove Partners LP | 1.184.674 | 6.634,55 | 39.533 | 6.544,03 | ||||
| 2026-01-29 | 13F | Dunhill Financial, LLC | 6 | 0 | ||||||
| 2026-04-21 | 13F | Gilpin Wealth Management, Llc | 19 | 111,11 | 1 | |||||
| 2026-02-12 | 13F | Swiss National Bank | 223.200 | 1,78 | 7.448 | 0,36 | ||||
| 2026-02-02 | 13F | Fifth Third Bancorp | 679 | 13,55 | 23 | 10,00 | ||||
| 2026-02-17 | 13F | Jump Financial, LLC | 0 | -100,00 | 0 | |||||
| 2026-02-12 | 13F | Colonial Trust Co / SC | 75 | 0,00 | 3 | 0,00 | ||||
| 2026-02-10 | 13F | CIBC Asset Management Inc | 6.007 | 200 | ||||||
| 2026-04-22 | 13F | Spire Wealth Management | 267 | 1,14 | 9 | 12,50 | ||||
| 2026-01-26 | 13F | Greenwood Capital Associates Llc | 50.925 | 5,36 | 1.699 | 3,91 | ||||
| 2026-02-03 | 13F | Bokf, Na | 10.366 | -0,54 | 346 | -1,99 | ||||
| 2026-02-04 | 13F | Swiss Life Asset Management Ltd | 10.599 | 354 | ||||||
| 2026-02-11 | 13F | Empowered Funds, LLC | 3.547 | 118 | ||||||
| 2026-04-17 | 13F | Outlook Wealth Advisors, LLC | 8.763 | 0,60 | 298 | 2,41 | ||||
| 2026-04-24 | 13F | Private Advisor Group, LLC | 15.349 | -0,58 | 522 | 1,17 | ||||
| 2026-01-26 | 13F | Private Trust Co Na | 0 | -100,00 | 0 | |||||
| 2026-04-27 | 13F | Truist Financial Corp | 7.253 | -0,29 | 246 | 1,65 | ||||
| 2026-04-28 | 13F | Everence Capital Management Inc | 10.710 | 0,00 | 0 | |||||
| 2026-01-30 | 13F | Sigma Planning Corp | 14.908 | -6,26 | 497 | -7,62 | ||||
| 2026-02-10 | 13F | Natixis Advisors, L.p. | 41.479 | 1,75 | 1 | 0,00 | ||||
| 2026-02-11 | 13F | Illinois Municipal Retirement Fund | 62.192 | 5,00 | 2.075 | 3,54 | ||||
| 2026-02-13 | 13F | Barclays Plc | 602.088 | 18,58 | 20.092 | 16,93 | ||||
| 2026-02-09 | 13F | Ar Asset Management Inc | 237.050 | 0,00 | 8 | -12,50 | ||||
| 2026-02-17 | 13F | Wellington Management Group Llp | 2.427.912 | 11,26 | 81.019 | 9,71 | ||||
| 2026-02-17 | 13F | GEM Realty Capital | 0 | -100,00 | 0 | |||||
| 2026-01-26 | 13F | Cwm, Llc | 2.350 | -4,47 | 0 | |||||
| 2026-04-06 | 13F | CX Institutional | 0 | -100,00 | 0 | |||||
| 2026-02-17 | 13F | Advisor Group Holdings, Inc. | 62.842 | 4,08 | 2.097 | 1,95 | ||||
| 2026-02-17 | 13F | Hancock Whitney Corp | 88.788 | 1,39 | 2.963 | -0,03 | ||||
| 2026-02-06 | 13F | Pnc Financial Services Group, Inc. | 34.017 | 0,14 | 1.135 | -1,22 | ||||
| 2026-02-10 | 13F | Nomura Asset Management Co Ltd | 172.840 | 5,73 | 5.768 | 4,27 | ||||
| 2025-11-13 | 13F | Employees Retirement System of Texas | 0 | -100,00 | 0 | -100,00 | ||||
| 2026-04-27 | 13F | Ethic Inc. | 6.438 | 219 | ||||||
| 2026-04-27 | 13F | Td Private Client Wealth Llc | 200 | 0,00 | 7 | 0,00 | ||||
| 2026-02-17 | 13F | Millennium Management Llc | 49.133 | -92,96 | 1.640 | -93,06 | ||||
| 2026-04-15 | 13F | Gf Fund Management Co. Ltd. | 1.711 | -8,75 | 58 | -6,45 | ||||
| 2026-02-12 | 13F | Elo Mutual Pension Insurance Co | 0 | -100,00 | 0 | |||||
| 2026-02-17 | 13F | Raymond James Financial Inc | 160.768 | -0,84 | 5.365 | -2,22 | ||||
| 2026-02-17 | 13F | Russell Investments Group, Ltd. | 33.134 | -13,81 | 1.106 | -15,07 | ||||
| 2025-11-06 | 13F | Financial Advocates Investment Management | 0 | -100,00 | 0 | -100,00 | ||||
| 2026-02-09 | 13F | Keating Financial Advisory Services, Inc. | 38 | 1 | ||||||
| 2026-04-27 | 13F | Sound Income Strategies, LLC | 322 | 54,81 | 11 | 66,67 | ||||
| 2026-02-13 | 13F | Gts Securities Llc | 0 | -100,00 | 0 | |||||
| 2026-04-24 | 13F | Yousif Capital Management, Llc | 31.178 | 0,53 | 1.059 | 2,32 | ||||
| 2026-02-09 | 13F | Quest Partners LLC | 1.125 | 29,16 | 38 | 27,59 | ||||
| 2026-02-12 | 13F | JPL Wealth Management, LLC | 0 | -100,00 | 0 | |||||
| 2026-02-17 | 13F | Optiver Holding B.V. | 0 | -100,00 | 0 | |||||
| 2026-02-03 | 13F | Mitsubishi UFJ Kokusai Asset Management Co., Ltd. | 90.844 | 7,26 | 3.008 | 4,92 | ||||
| 2026-01-29 | 13F | Teachers Retirement System Of The State Of Kentucky | 28.025 | -11,77 | 1 | -100,00 | ||||
| 2026-02-04 | 13F | Versor Investments LP | 11.600 | -15,33 | 387 | -16,41 | ||||
| 2026-02-12 | 13F | Steward Partners Investment Advisory, Llc | 1.320 | 0,00 | 44 | 0,00 | ||||
| 2026-01-23 | 13F | Rsm Us Wealth Management Llc | 7.762 | 2,02 | 264 | 2,72 | ||||
| 2026-04-24 | 13F | Strs Ohio | 19.700 | 0,00 | 669 | 1,83 | ||||
| 2026-02-11 | 13F | Metis Global Partners, LLC | 27.230 | 6,71 | 909 | 5,21 | ||||
| 2026-02-17 | 13F | Fmr Llc | 11.701.106 | 25,98 | 390.466 | 24,23 | ||||
| 2026-04-22 | 13F | Janney Montgomery Scott LLC | 327.882 | -1,12 | 11 | 0,00 | ||||
| 2026-02-12 | 13F | Alps Advisors Inc | 26.845 | 0,00 | 896 | -1,43 | ||||
| 2026-04-16 | 13F | SG Americas Securities, LLC | 224.636 | 45,77 | 8 | 40,00 | ||||
| 2026-02-10 | 13F | Lido Advisors, LLC | 12.440 | 3,02 | 420 | 2,70 | ||||
| 2026-02-17 | 13F | Investment Management Corp of Ontario | 99.327 | 0,00 | 3.315 | -1,40 | ||||
| 2026-02-12 | 13F | CIBC Private Wealth Group, LLC | 26 | 1 | ||||||
| 2026-04-15 | 13F | Sightline Wealth Advisors, LLC | 96.084 | 5,56 | 3.265 | 7,47 | ||||
| 2026-04-06 | 13F | GAMMA Investing LLC | 3.083 | 7,95 | 105 | 9,47 | ||||
| 2026-02-17 | 13F | Cambria Investment Management, L.P. | 19.544 | 0,03 | 652 | -1,36 | ||||
| 2026-04-28 | 13F | Handelsbanken Fonder AB | 34.953 | 0,00 | 1 | 0,00 | ||||
| 2026-02-13 | 13F | Walleye Trading LLC | Put | 0 | -100,00 | 0 | ||||
| 2026-02-09 | 13F | Fisher Asset Management, LLC | 459.942 | -6,62 | 15.348 | -7,92 | ||||
| 2026-02-13 | 13F | Walleye Trading LLC | Call | 0 | -100,00 | 0 | ||||
| 2026-04-15 | 13F | Bayforest Capital Ltd | 0 | -100,00 | 0 | |||||
| 2026-02-10 | 13F | Rothschild Investment Llc | 790 | 0,77 | 26 | 0,00 | ||||
| 2026-01-21 | 13F | Inlet Private Wealth, LLC | 27.600 | -45,45 | 921 | -46,20 | ||||
| 2025-11-14 | 13F | Corton Capital Inc. | 0 | -100,00 | 0 | |||||
| 2026-02-06 | 13F | HighTower Advisors, LLC | 505.757 | -0,43 | 16.877 | -1,81 | ||||
| 2026-02-17 | 13F | Susquehanna International Group, Llp | 0 | -100,00 | 0 | |||||
| 2026-02-11 | 13F | Simplex Trading, Llc | Put | 1.400 | 55,56 | 47 | ||||
| 2026-02-17 | 13F | California State Teachers Retirement System | 101.133 | -0,10 | 3.375 | -1,49 | ||||
| 2026-02-11 | 13F | Deutsche Bank Ag\ | 145.750 | 3,53 | 4.864 | 2,10 | ||||
| 2026-02-11 | 13F | Simplex Trading, Llc | Call | 700 | -75,86 | 23 | ||||
| 2026-02-13 | 13F | Jacobs Levy Equity Management, Inc | 104.004 | 3,37 | 3.471 | 1,94 | ||||
| 2026-01-15 | 13F | Allspring Global Investments Holdings, LLC | 154.759 | 31,60 | 5.124 | 28,97 | ||||
| 2026-04-16 | 13F | Diversified Trust Co | 21.680 | 8,52 | 737 | 10,51 | ||||
| 2026-01-22 | 13F | City Holding Co | 0 | -100,00 | 0 | |||||
| 2026-02-17 | 13F | Delaware Management Holdings, Inc. | 955.933 | 31.899 | ||||||
| 2026-02-17 | 13F | Susquehanna International Group, Llp | Put | 0 | -100,00 | 0 | ||||
| 2026-02-09 | 13F | Harbour Investments, Inc. | 52 | 2 | ||||||
| 2026-02-13 | 13F | Kayne Anderson Rudnick Investment Management Llc | 1.000 | 0,00 | 33 | 0,00 | ||||
| 2026-02-10 | 13F | Envestnet Asset Management Inc | 66.874 | 5,35 | 2.232 | 3,86 | ||||
| 2026-02-17 | 13F | PharVision Advisers, LLC | 0 | -100,00 | 0 | |||||
| 2026-02-18 | 13F | State of Tennessee, Treasury Department | 43.327 | -9,95 | 1.418 | -12,96 | ||||
| 2026-02-13 | 13F | Great West Life Assurance Co /can/ | 286.880 | -10,69 | 10 | -10,00 | ||||
| 2026-02-11 | 13F | Parallel Advisors, LLC | 154 | 0,00 | 5 | 0,00 | ||||
| 2026-01-29 | 13F | Seven Post Investment Office LP | 8.000 | 0,00 | 267 | -1,48 | ||||
| 2026-04-01 | 13F | Pensionfund Sabic | 6.000 | 0,00 | 0 | |||||
| 2026-01-23 | 13F | Sumitomo Mitsui Trust Holdings, Inc. | 206.090 | -2,13 | 6.877 | -3,48 | ||||
| 2026-02-12 | 13F | State Board Of Administration Of Florida Retirement System | 83.707 | -2,19 | 2.793 | -3,52 | ||||
| 2026-02-13 | 13F | Public Sector Pension Investment Board | 0 | -100,00 | 0 | |||||
| 2026-04-16 | 13F | ARS Investment Partners, LLC | 0 | -100,00 | 0 | |||||
| 2026-01-30 | 13F/A | M&t Bank Corp | 11.564 | 386 | ||||||
| 2026-01-28 | 13F | Salomon & Ludwin, LLC | 692 | -10,48 | 23 | -11,54 | ||||
| 2026-02-06 | 13F | Resona Asset Management Co.,Ltd. | 48.104 | -3,75 | 1.629 | -2,22 | ||||
| 2026-04-23 | 13F | Farmers & Merchants Investments Inc | 65 | 0,00 | 2 | 0,00 | ||||
| 2026-02-12 | 13F | Pitcairn Co | 0 | -100,00 | 0 | |||||
| 2026-02-13 | 13F | Citigroup Inc | 132.754 | 19,37 | 4.430 | 17,73 | ||||
| 2026-02-18 | 13F | Mackenzie Financial Corp | 10.846 | 44,44 | 369 | 44,88 | ||||
| 2025-11-14 | 13F | Mount Yale Investment Advisors, LLC | 0 | -100,00 | 0 | -100,00 | ||||
| 2026-02-13 | 13F | MAI Capital Management | 300 | 10 | ||||||
| 2026-02-13 | 13F | Edgestream Partners, L.P. | 16.880 | -93,78 | 563 | -93,87 | ||||
| 2026-01-23 | 13F | Diversify Advisory Services, LLC | 0 | -100,00 | 0 | |||||
| 2026-02-05 | 13F | Thrivent Financial For Lutherans | 783.777 | 25,32 | 26 | 23,81 | ||||
| 2026-04-23 | 13F | CWM Advisors, LLC | 15.069 | 8,17 | 512 | 10,34 | ||||
| 2026-04-28 | 13F | Harbor Capital Advisors, Inc. | 629 | 102,25 | 0 | |||||
| 2025-11-05 | 13F | Gallacher Capital Management LLC | 0 | -100,00 | 0 | |||||
| 2026-02-10 | 13F | Quantbot Technologies LP | 5.335 | -93,83 | 178 | -93,91 | ||||
| 2026-02-17 | 13F | Two Sigma Advisers, Lp | 9.200 | -85,95 | 307 | -86,15 | ||||
| 2026-02-17 | 13F | Janus Henderson Group Plc | 48.130 | 0,00 | 1.607 | -1,35 | ||||
| 2026-02-13 | 13F | Quarry LP | 220 | -84,94 | 7 | -85,71 | ||||
| 2026-04-14 | 13F | Nbc Securities, Inc. | 881 | 1,38 | 30 | 3,57 | ||||
| 2026-02-11 | 13F | Jpmorgan Chase & Co | 1.188.442 | 20,67 | 39.658 | 19,00 | ||||
| 2026-02-17 | 13F | GeoWealth Management, LLC | 11.534 | -0,85 | 385 | -2,29 | ||||
| 2026-04-20 | 13F | Kestra Private Wealth Services, Llc | 17.518 | -3,71 | 595 | -1,98 | ||||
| 2026-02-12 | 13F | Johnson Financial Group, Inc. | 0 | -100,00 | 0 | |||||
| 2026-02-11 | 13F | Renaissance Group Llc | 6.686 | 3,87 | 223 | 2,76 | ||||
| 2026-02-17 | 13F | Snowden Capital Advisors LLC | 6.215 | 207 | ||||||
| 2026-02-11 | 13F | Capital Analysts, Inc. | 0 | -100,00 | 0 | |||||
| 2026-02-09 | 13F | MSH Capital Advisors LLC | 15.548 | -0,26 | 519 | -1,71 | ||||
| 2026-02-17 | 13F | Ameriprise Financial Inc | 919.631 | 2,43 | 30.693 | 1,00 | ||||
| 2026-02-12 | 13F | Renaissance Technologies Llc | 345.172 | -42,55 | 11.518 | -43,34 | ||||
| 2026-04-28 | 13F | Flagship Harbor Advisors, Llc | 0 | -100,00 | 0 | |||||
| 2025-12-09 | 13F/A | Tudor Investment Corp Et Al | 0 | -100,00 | 0 | |||||
| 2026-02-12 | 13F | MetLife Investment Management, LLC | 65.511 | -4,27 | 2.186 | -5,57 | ||||
| 2026-02-13 | 13F | Heritage Wealth Advisors | 406 | 0,00 | 14 | 0,00 | ||||
| 2026-04-01 | 13F | Pensionfund DSM Netherlands | 11.000 | 0,00 | 0 | |||||
| 2026-02-13 | 13F | Marshall Wace, Llp | 0 | -100,00 | 0 | |||||
| 2026-02-13 | 13F | Police & Firemen's Retirement System of New Jersey | 30.686 | -0,87 | 1.024 | -2,29 | ||||
| 2026-02-10 | 13F | Bnp Paribas Arbitrage, Sa | 64.188 | -66,42 | 2.142 | -66,89 | ||||
| 2026-02-10 | 13F | Norges Bank | 470.700 | 15.707 | ||||||
| 2026-02-13 | 13F | Virtus ETF Advisers LLC | 4.650 | 155 | ||||||
| 2026-02-02 | 13F | Horizon Investments, LLC | 21.435 | 28,19 | 715 | 27,68 | ||||
| 2026-01-27 | 13F | Meritage Portfolio Management | 12.050 | 15,58 | 402 | 14,20 | ||||
| 2026-02-12 | 13F | BlackRock, Inc. | 21.528.276 | 3,18 | 718.399 | 1,75 | ||||
| 2026-02-17 | 13F | Brevan Howard Capital Management LP | 15.534 | 64,33 | 518 | 62,38 | ||||
| 2026-04-20 | 13F | Vanderbilt University | 7.767 | 264 | ||||||
| 2026-01-28 | 13F | Arizona State Retirement System | 31.658 | -5,47 | 1.056 | -6,80 | ||||
| 2026-01-29 | 13F | UBS Group AG | 391.202 | -73,78 | 13.054 | -74,15 | ||||
| 2026-02-05 | 13F | Bessemer Group Inc | 870 | 24,64 | 0 | |||||
| 2026-02-06 | 13F | Gsa Capital Partners Llp | 0 | -100,00 | 0 | |||||
| 2026-02-17 | 13F | Holocene Advisors, LP | 15.078 | 503 | ||||||
| 2026-02-09 | 13F | Huntington National Bank | 552 | -2,82 | 18 | -5,26 | ||||
| 2026-02-09 | 13F | Jackson Creek Investment Advisors LLC | 52.072 | 2 | ||||||
| 2026-04-17 | 13F | Values First Advisors, Inc. | 41.363 | 1,66 | 1.406 | 3,54 | ||||
| 2026-02-12 | 13F | Federated Hermes, Inc. | 288.132 | 34,91 | 9.615 | 33,03 | ||||
| 2026-02-13 | 13F | Rhumbline Advisers | 383.309 | -4,10 | 12.791 | -5,43 | ||||
| 2026-02-13 | 13F | Pinnacle Wealth Planning Services, Inc. | 2.586 | 86 | ||||||
| 2026-02-06 | 13F | Covestor Ltd | 6 | -97,48 | 0 | |||||
| 2026-02-11 | 13F | LPL Financial LLC | 120.720 | 14,44 | 4.028 | 12,86 | ||||
| 2026-02-17 | 13F | Maryland State Retirement & Pension System | 16.952 | 4,19 | 566 | 2,73 | ||||
| 2026-04-07 | 13F | Farther Finance Advisors, LLC | 5.557 | 0,85 | 190 | 3,28 | ||||
| 2026-02-13 | 13F | Pathstone Holdings, LLC | 27.825 | 1,02 | 929 | -0,43 | ||||
| 2026-02-17 | 13F | State Of Wisconsin Investment Board | 240.941 | 2,86 | 8.040 | 1,44 | ||||
| 2026-02-11 | 13F | Fox Run Management, L.l.c. | 12.291 | -70,29 | 410 | -70,69 | ||||
| 2026-02-13 | 13F | Stifel Financial Corp | 130.513 | 3,61 | 4.355 | 2,18 | ||||
| 2026-02-17 | 13F | Polymer Capital Management (US) LLC | 10.488 | 350 | ||||||
| 2026-02-10 | 13F/A | Northwestern Mutual Wealth Management Co | 5.571 | -5,21 | 186 | -6,57 | ||||
| 2026-01-28 | 13F | Klp Kapitalforvaltning As | 24.200 | 1,26 | 808 | -0,12 | ||||
| 2026-04-06 | 13F | Versant Capital Management, Inc | 3.125 | 6,04 | 106 | 8,16 | ||||
| 2026-02-13 | 13F | Fieldview Capital Management, LLC | 14.327 | 478 | ||||||
| 2026-02-17 | 13F | Nissay Asset Management Corp /japan/ /adv | 18.032 | 3,81 | 602 | 2,39 | ||||
| 2025-11-14 | 13F | Ieq Capital, Llc | 0 | -100,00 | 0 | -100,00 | ||||
| 2026-01-28 | 13F | Teacher Retirement System Of Texas | 47.884 | -7,14 | 1.598 | -8,43 | ||||
| 2026-02-12 | 13F | UniSuper Management Pty Ltd | 22.700 | -29,06 | 757 | -30,04 | ||||
| 2026-02-11 | 13F | Ameritas Investment Partners, Inc. | 9.078 | 303 | ||||||
| 2025-11-13 | 13F | Brown Brothers Harriman & Co | 0 | -100,00 | 0 | |||||
| 2026-04-08 | 13F | Oliver Luxxe Assets LLC | 0 | -100,00 | 0 | |||||
| 2026-02-13 | 13F | Wells Fargo & Company/mn | 265.441 | 26,46 | 8.858 | 24,71 | ||||
| 2026-02-13 | 13F | Kestra Advisory Services, LLC | 0 | -100,00 | 0 | |||||
| 2026-02-17 | 13F | Cetera Investment Advisers | 40.707 | 4,93 | 1.358 | 3,51 | ||||
| 2026-04-24 | 13F | Ninety One UK Ltd | 7.190 | 244 | ||||||
| 2026-01-27 | 13F | Zurcher Kantonalbank (Zurich Cantonalbank) | 81.595 | 11,72 | 2.723 | 10,16 | ||||
| 2026-02-26 | 13F | TD Capital Management LLC | 9 | 0 | ||||||
| 2026-04-24 | 13F | ProShare Advisors LLC | 17.710 | -18,68 | 602 | -17,22 | ||||
| 2026-02-12 | 13F | Groupe la Francaise | 17.677 | -6,42 | 590 | -7,82 | ||||
| 2025-11-21 | 13F/A | CIBC Bancorp USA Inc. | 11.922 | 403 | ||||||
| 2026-01-26 | 13F | KBC Group NV | 3.531 | 0,00 | 0 | |||||
| 2026-02-19 | 13F | Invesco Ltd. | 2.254.556 | -2,02 | 75.235 | -3,39 | ||||
| 2026-02-12 | 13F | Rossby Financial, LCC | 16 | 33,33 | 1 | |||||
| 2025-11-14 | 13F | DRW Securities, LLC | 0 | -100,00 | 0 | |||||
| 2026-04-06 | 13F | IFS Advisors, LLC | 500 | 0,00 | 17 | 0,00 | ||||
| 2026-02-04 | 13F | Oregon Public Employees Retirement Fund | 26.338 | 3,13 | 879 | 1,62 | ||||
| 2026-04-22 | 13F | Samalin Investment Counsel, LLC | 8.946 | 0,82 | 304 | 2,36 | ||||
| 2026-02-12 | 13F | New York State Common Retirement Fund | 106.814 | 1,36 | 3.564 | -0,06 | ||||
| 2026-02-17 | 13F | Wiley Bros.-aintree Capital, Llc | 30.514 | 23,33 | 1.019 | 21,74 | ||||
| 2026-01-27 | 13F | Evergreen Capital Management Llc | 9.352 | 43,70 | 312 | 41,82 |
Other Listings
| US:SKT | 36,94 $ |