Grundlæggende statistik
| Institutionelle aktier (lange) | 30.157.893 - 60,27% (ex 13D/G) - change of 20,92MM shares 226,46% MRQ |
| Institutionel værdi (lang) | $ 246.844 USD ($1000) |
Institutionelt ejerskab og aktionærer
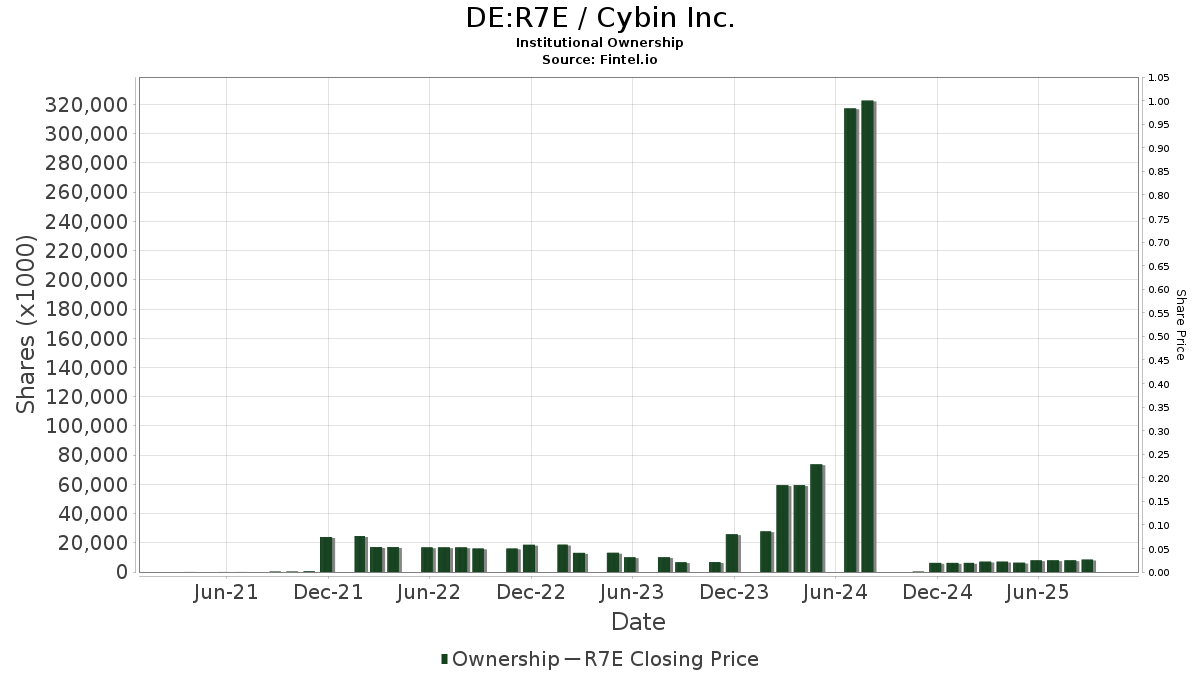
Cybin Inc. (DE:R7E) har 82 institutionelle ejere og aktionærer, der har indsendt 13D/G- eller 13F-formularer til Securities Exchange Commission (SEC). Disse institutioner har i alt 30,157,893 aktier. Største aktionærer omfatter Point72 Asset Management, L.P., Orbimed Advisors Llc, VR Adviser, LLC, Deep Track Capital, LP, Rosalind Advisors, Inc., Acorn Capital Advisors, Llc, Morgan Stanley, Eventide Asset Management, Llc, Millennium Management Llc, and Sphera Funds Management Ltd. .
Cybin Inc. (DB:R7E) institutionel ejerskabsstruktur viser aktuelle positioner i virksomheden efter institutioner og fonde, samt seneste ændringer i positionsstørrelse. Større aktionærer kan omfatte individuelle investorer, investeringsforeninger, hedgefonde eller institutioner. Skema 13D angiver, at investoren besidder (eller besidder) mere end 5 % af virksomheden og har til hensigt (eller har til hensigt at) aktivt at forfølge en ændring i forretningsstrategi. Skema 13G indikerer en passiv investering på over 5%.
The share price as of April 24, 2026 is 4,64 / share. Previously, on April 28, 2025, the share price was 5,85 / share. This represents a decline of 20,68% over that period.
Fondens stemningsscore
Fund Sentiment Score (fka Ownership Accumulation Score) finder de aktier, der bliver mest købt af fonde. Det er resultatet af en sofistikeret, multi-faktor kvantitativ model, der identificerer virksomheder med de højeste niveauer af institutionel akkumulering. Scoringsmodellen bruger en kombination af den samlede stigning i oplyste ejere, ændringerne i porteføljeallokeringer i disse ejere og andre målinger. Tallet går fra 0 til 100, hvor højere tal indikerer et højere niveau af akkumulering for sine jævnaldrende, og 50 er gennemsnittet.
Opdateringsfrekvens: Dagligt
Se Ownership Explorer, som giver en liste over højest rangerende virksomheder.
AI+ Ask Fintel’s AI assistant about Cybin Inc..
Select a question to share a public post with an AI-crafted answer.
Thinking of good questions…
13F og NPORT arkivering
Detaljer om 13F-arkivering er gratis. Detaljer om NP-ansøgninger kræver et premium-medlemskab. Grønne rækker angiver nye positioner. Røde rækker angiver lukkede positioner. Klik på linket ikon for at se den fulde transaktionshistorik.
Opgrader
for at låse premium-data op og eksportere til Excel ![]() .
.
| Fil dato | Kilde | Investor | Type | Gennemsnitlig pris (Øst) |
Aktier | Δ Aktier (%) |
Rapporteret Værdi ($1000) |
Δ Værdi (%) |
Port Alloc (%) |
|
|---|---|---|---|---|---|---|---|---|---|---|
| 2026-02-17 | 13F | VR Adviser, LLC | 3.840.250 | 31.413 | ||||||
| 2026-02-17 | 13F | Boxer Capital Management, LLC | 715.000 | 5.849 | ||||||
| 2026-02-17 | 13F | Graham Capital Management, L.P. | 35.509 | 290 | ||||||
| 2026-04-23 | 13F | North Star Investment Management Corp. | 3.380 | 35,20 | 16 | -20,00 | ||||
| 2026-02-06 | 13F | Larson Financial Group LLC | 21 | 0,00 | 0 | |||||
| 2026-01-20 | 13F | Nvwm, Llc | 59 | 0,00 | 0 | |||||
| 2026-02-10 | 13F | Tidemark, LLC | 131 | 0,00 | 1 | |||||
| 2026-02-13 | 13F | Barclays Plc | 862 | 0,00 | 7 | 40,00 | ||||
| 2026-02-12 | 13F | Steward Partners Investment Advisory, Llc | 0 | -100,00 | 0 | |||||
| 2026-02-13 | 13F | Nan Fung Group Holdings Ltd | 460.000 | 3.763 | ||||||
| 2026-02-11 | 13F | Simplex Trading, Llc | 0 | -100,00 | 0 | |||||
| 2025-11-14 | 13F | Raymond James Financial Inc | 0 | -100,00 | 0 | |||||
| 2026-04-24 | 13F | Root Financial Partners, LLC | 0 | -100,00 | 0 | |||||
| 2026-02-12 | 13F | Federation des caisses Desjardins du Quebec | 3.121 | 0,00 | 25 | 38,89 | ||||
| 2026-02-17 | 13F | Susquehanna International Group, Llp | Call | 196.100 | 73,39 | 1.604 | 140,84 | |||
| 2026-02-17 | 13F | Susquehanna International Group, Llp | 300.230 | 9,66 | 2.456 | 52,30 | ||||
| 2026-02-17 | 13F | Quadrature Capital Ltd | 79.697 | 652 | ||||||
| 2025-10-28 | 13F | Wolverine Asset Management Llc | Call | 0 | -100,00 | 0 | -100,00 | |||
| 2026-02-17 | 13F | Susquehanna International Group, Llp | Put | 36.500 | 41,47 | 299 | 97,35 | |||
| 2026-01-21 | 13F | Flagship Harbor Advisors, Llc | 105 | 1 | ||||||
| 2025-10-28 | 13F | Wolverine Asset Management Llc | Put | 0 | -100,00 | 0 | -100,00 | |||
| 2026-02-12 | 13F | Knott David M Jr | 285.182 | 103,35 | 2.333 | 182,32 | ||||
| 2025-11-14 | 13F | Oxford Asset Management Llp | 50.805 | 299 | ||||||
| 2026-02-17 | 13F | Jump Financial, LLC | 0 | -100,00 | 0 | |||||
| 2026-02-10 | 13F | Bnp Paribas Arbitrage, Sa | 925 | 8 | ||||||
| 2026-02-13 | 13F | DLD Asset Management, LP | 0 | -100,00 | 0 | -100,00 | ||||
| 2026-02-13 | 13F | Stonepine Capital Management, LLC | 339.902 | 2.780 | ||||||
| 2026-01-26 | 13F | Cwm, Llc | 0 | -100,00 | 0 | |||||
| 2026-02-04 | 13F | Atlantic Union Bankshares Corp | 0 | -100,00 | 0 | |||||
| 2026-02-11 | 13F | Fore Capital, LLC | 66.421 | -7,00 | 543 | 29,29 | ||||
| 2026-02-17 | 13F | Ikarian Capital, LLC | 132.153 | -5,92 | 1.081 | 30,71 | ||||
| 2026-01-15 | 13F | Lewis Asset Management, LLC | 0 | -100,00 | 0 | |||||
| 2026-04-07 | 13F | Farther Finance Advisors, LLC | 221 | -10,53 | 1 | -50,00 | ||||
| 2026-02-10 | 13F | AdvisorShares Investments LLC | 98.058 | -15,54 | 802 | 17,42 | ||||
| 2026-02-17 | 13F | ArrowMark Colorado Holdings LLC | 598.419 | 4.895 | ||||||
| 2026-01-29 | 13F | UBS Group AG | 233.714 | -23,05 | 1.912 | 6,82 | ||||
| 2026-04-03 | 13F | Global Wealth Strategies & Associates | 0 | -100,00 | 0 | -100,00 | ||||
| 2026-02-12 | 13F | Rosalind Advisors, Inc. | 1.657.540 | 10,50 | 13.559 | 53,46 | ||||
| 2026-02-17 | 13F | Ameriflex Group, Inc. | 131 | 1 | ||||||
| 2026-02-13 | 13F | Walleye Capital LLC | 0 | -100,00 | 0 | |||||
| 2026-02-17 | 13F | Advisory Services Network, LLC | 0 | -100,00 | 0 | |||||
| 2026-02-11 | 13F | Group One Trading, L.p. | 10.725 | 88 | ||||||
| 2026-02-17 | 13F | Bank Of America Corp /de/ | 4.248 | -93,26 | 35 | -90,84 | ||||
| 2026-02-11 | 13F | CNB Bank | 4 | 0,00 | 0 | |||||
| 2026-02-17 | 13F | Credit Agricole S A | 0 | -100,00 | 0 | |||||
| 2026-02-17 | 13F | Boothbay Fund Management, Llc | 29.404 | -22,06 | 241 | 8,11 | ||||
| 2026-02-10 | 13F/A | Northwestern Mutual Wealth Management Co | 7 | 600,00 | 0 | |||||
| 2026-03-12 | 13F/A | Peak6 Llc | 283.507 | 242,78 | 2.776 | 470,02 | ||||
| 2026-02-10 | 13F | Goldman Sachs Group Inc | 47.931 | 392 | ||||||
| 2026-04-17 | 13F | CENTRAL TRUST Co | 26 | 0,00 | 0 | |||||
| 2026-02-05 | 13F | Allworth Financial LP | 20 | -56,52 | 0 | |||||
| 2026-02-10 | 13F | Goldman Sachs Group Inc | Call | 90.000 | 736 | |||||
| 2026-02-17 | 13F | Point72 Asset Management, L.P. | 4.432.559 | 257,57 | 36.258 | 396,62 | ||||
| 2026-02-17 | 13F | Millennium Management Llc | 1.028.549 | 1.388,47 | 8.414 | 1.967,08 | ||||
| 2026-02-12 | 13F | Principal Securities, Inc. | 0 | -100,00 | 0 | |||||
| 2026-02-11 | 13F | DCF Advisers, LLC | 775.588 | 6.344 | ||||||
| 2026-02-17 | 13F | Squadron Capital Management LLC | 525.000 | 4.294 | ||||||
| 2026-02-06 | 13F | Global Retirement Partners, LLC | 3.100 | -16,33 | 25 | 19,05 | ||||
| 2026-02-12 | 13F | Jane Street Group, Llc | Call | 0 | -100,00 | 0 | -100,00 | |||
| 2026-02-13 | 13F | Deep Track Capital, LP | 1.854.255 | 85,43 | 15.168 | 157,50 | ||||
| 2026-02-17 | 13F | Sphera Funds Management Ltd. | 825.576 | 122,90 | 6.753 | 209,63 | ||||
| 2026-01-23 | 13F | Westside Investment Management, Inc. | 26 | 0,00 | 0 | |||||
| 2026-02-10 | 13F | IAG Wealth Partners, LLC | 2.750 | 0,00 | 22 | 37,50 | ||||
| 2026-04-22 | 13F | Formidable Asset Management, LLC | 10.649 | 87 | ||||||
| 2026-02-09 | 13F | Harbour Investments, Inc. | 250 | 0,00 | 2 | 100,00 | ||||
| 2026-02-13 | 13F | DLD Asset Management, LP | Call | 283.600 | 1,29 | 2.326 | 41,25 | |||
| 2026-02-13 | 13F | Morgan Stanley | 1.299.756 | 470,92 | 10.632 | 693,43 | ||||
| 2026-02-17 | 13F | DAFNA Capital Management LLC | 455.018 | 3.722 | ||||||
| 2026-02-04 | 13F | Tsfg, Llc | 2 | -86,67 | 0 | |||||
| 2026-02-17 | 13F | Advisor Group Holdings, Inc. | 2.928 | -27,79 | 24 | -17,86 | ||||
| 2026-02-17 | 13F | Royal Bank Of Canada | 51.082 | 113,78 | 418 | 196,45 | ||||
| 2026-02-17 | 13F | Tower Research Capital LLC (TRC) | 2.556 | 4,67 | 21 | 42,86 | ||||
| 2026-02-13 | 13F | Pale Fire Capital SE | 153.505 | 0,00 | 1.256 | 38,83 | ||||
| 2026-02-13 | 13F | Spruce Street Capital LP | 770.000 | 6.299 | ||||||
| 2026-01-27 | 13F | TD Waterhouse Canada Inc. | 2.033 | -26,15 | 16 | 0,00 | ||||
| 2025-10-28 | 13F | CarsonAllaria Wealth Management, Ltd. | 0 | -100,00 | 0 | |||||
| 2026-04-22 | 13F | Atlantic Edge Private Wealth Management, LLC | 137 | 0,00 | 1 | -100,00 | ||||
| 2026-02-19 | 13F | Mcguire Capital Advisors Inc | 1 | 0 | ||||||
| 2026-02-17 | 13F | Tang Capital Management Llc | 0 | -100,00 | 0 | -100,00 | ||||
| 2026-02-17 | 13F | Acorn Capital Advisors, Llc | 1.573.023 | 114,19 | 12.874 | 198,68 | ||||
| 2026-02-09 | 13F | Avalon Trust Co | 197 | 0,00 | 2 | 0,00 | ||||
| 2026-02-13 | 13F | SRS Capital Advisors, Inc. | 13 | 0,00 | 0 | |||||
| 2026-04-21 | 13F | PDS Planning, Inc | 30.344 | 0,00 | 145 | -41,53 | ||||
| 2026-02-12 | 13F | Jane Street Group, Llc | 99.034 | 157,47 | 810 | 258,41 | ||||
| 2026-02-12 | 13F | Wealthspire Advisors, LLC | 0 | -100,00 | 0 | |||||
| 2026-02-13 | 13F | Diametric Capital, LP | 17.758 | 10,12 | 145 | 54,26 | ||||
| 2026-02-12 | 13F | BlackRock, Inc. | 25.403 | -82,02 | 208 | -75,12 | ||||
| 2026-02-13 | 13F | Eventide Asset Management, Llc | 1.257.000 | 10.282 | ||||||
| 2025-12-18 | 13F | Danske Bank A/s | 0 | -100,00 | 0 | |||||
| 2026-02-12 | 13F | Cowa, Llc | 0 | -100,00 | 0 | |||||
| 2026-02-18 | 13F | GWM Advisors LLC | 95 | 0,00 | 1 | |||||
| 2026-02-17 | 13F | Orbimed Advisors Llc | 3.840.500 | 31.415 | ||||||
| 2025-11-13 | 13F | Crewe Advisors LLC | 0 | -100,00 | 0 | -100,00 | ||||
| 2026-02-13 | 13F | MYDA Advisors LLC | 30.000 | 245 | ||||||
| 2026-02-03 | 13F | McIlrath & Eck, LLC | 10 | 0,00 | 0 | |||||
| 2026-02-13 | 13F | Marshall Wace, Llp | 0 | -100,00 | 0 | |||||
| 2026-02-06 | 13F | Pnc Financial Services Group, Inc. | 11.010 | 90 | ||||||
| 2026-02-11 | 13F | LPL Financial LLC | 18.125 | 38,25 | 148 | 92,21 | ||||
| 2025-11-14 | 13F | Bollard Group LLC | 0 | -100,00 | 0 | -100,00 | ||||
| 2026-02-17 | 13F | Citadel Advisors Llc | Put | 26.700 | 19,20 | 218 | 66,41 | |||
| 2026-02-17 | 13F | Adage Capital Partners Gp, L.l.c. | 700.000 | 5.726 | ||||||
| 2026-04-20 | 13F | Hilton Head Capital Partners, LLC | 117 | 0,00 | 1 | |||||
| 2026-02-17 | 13F | Citadel Advisors Llc | Call | 43.500 | -31,60 | 356 | -5,08 | |||
| 2026-04-23 | 13F | Mayflower Financial Advisors, LLC | 10.290 | 49 | ||||||
| 2026-04-15 | 13F | FNY Investment Advisers, LLC | 100 | 0,00 | 0 | |||||
| 2026-02-17 | 13F | Citadel Advisors Llc | 805.377 | 729,48 | 6.588 | 1.053,59 | ||||
| 2026-02-11 | 13F | Jpmorgan Chase & Co | 22.443 | 1.795,52 | 184 | 6.000,00 | ||||
| 2026-02-17 | 13F | ADAR1 Capital Management, LLC | 238.390 | 616,36 | 1.950 | 894,90 | ||||
| 2026-04-20 | 13F | City State Bank | 25 | 0,00 | 0 | |||||
| 2026-04-07 | 13F | CoreCap Advisors, LLC | 3 | 0,00 | 0 | |||||
| 2026-02-13 | 13F | National Bank Of Canada /fi/ | 5.408 | -1,26 | 33 | 39,13 | ||||
| 2026-04-13 | 13F | IFP Advisors, Inc | 200 | 0,00 | 1 | -100,00 |
Other Listings
| US:HELP | 5,61 $ |